


1. Introduction
Measurement of precipitation using a snow gauge presents severe problems, since it is almost impossible to distinguish between precipitation and drifting snow in the strong winds that often accompany precipitation. in the present study, a method of estimating the amount of snowfall by using continuous meteorological radar data is described.This method can provide the amount of snowfall in each series of snowfall events because the radar reflectivity converted to snowfall intensity is measured at short time intervals automatically, irre-spective of wind speed. The analysis also provides useful information on the mesoscale structure of clouds causing precipitation. Previous studies estimating the amount of snowfall in Antarctica (e.g. Reference BuddBudd, 1966; Bromwich, 1990! seldom refer to the structure of precipitation clouds, as they emphasize the results rather than the causes of precipitation.
The present study also deals with seasonal variations of precipitation phenomena. Since the sea-ice edge varies seasonally from 200 to 1500 km off Syowa station and the surface temperature varies from 0 to -40 C, precipitation phenomena affected by these factors vary with the season. The seasonal changes of atmospheric circulation in the Southern Hemisphere are related to semi-annual oscillations of the circumpolar trough (Reference Van LoonVan Loon, 1984). The symmetric circumpolar zone of low pressure at high latitudes ret reals inward the coast of Antarctica in March and October (Strelen, 1980). The clouds and precipitation around Syowa station are examined as possible indicators for impacts of the seasonal oscillation.
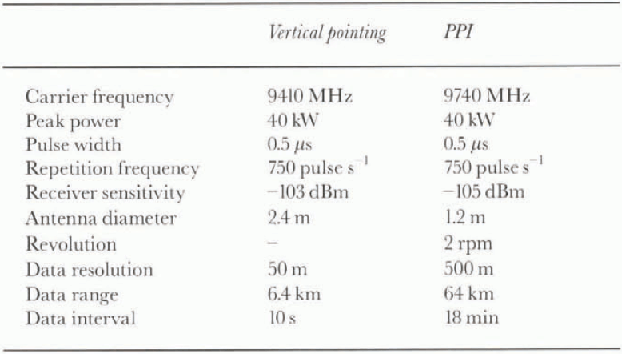
Specifications of vertical-pointing and PPI radar
2. Methods of Observation
Long-term observations of precipitating clouds were carried out by a vertically pointing radar and plan-position indicator (PPI) radar at Syowa station (69.0°S, 40.5° E), Antarctica, in 1989. Syowa station is situated on the north side of the Ongnl Islands near the cast coast of Lutzow-Holm Ray. The specifications of the vertical radar and the FFI radar are summarized inTable 1. Their detailed characteristics are specified by Wada (1990) and Konishi (1992).
A highly sensitive snow gauge (Konishi and others, 1988) was used to measure snowfall rale. The weight of snow falling in a bucket on a balance was measured automatically at 1 min intervals and the data were computer-monitored;The minimum detectable snowfall rate for this gauge is 0.062 mm h−1 liquid water equivalent). The electric balance was shielded by wooden walls to protect it from strong winds. However, we used the weight data only when the wind speed was <5ms−1, because the balance measured the weight not only of precipitation partirles hut also of blowing snow particles.
Surface synoptic data such as temperature, humidity, pressure and wind velocity and direction were measured every hour, and upper-air sounding data were obtained twice a day at 00Z (03LT) and 12Z (15LT) at Syowa station.
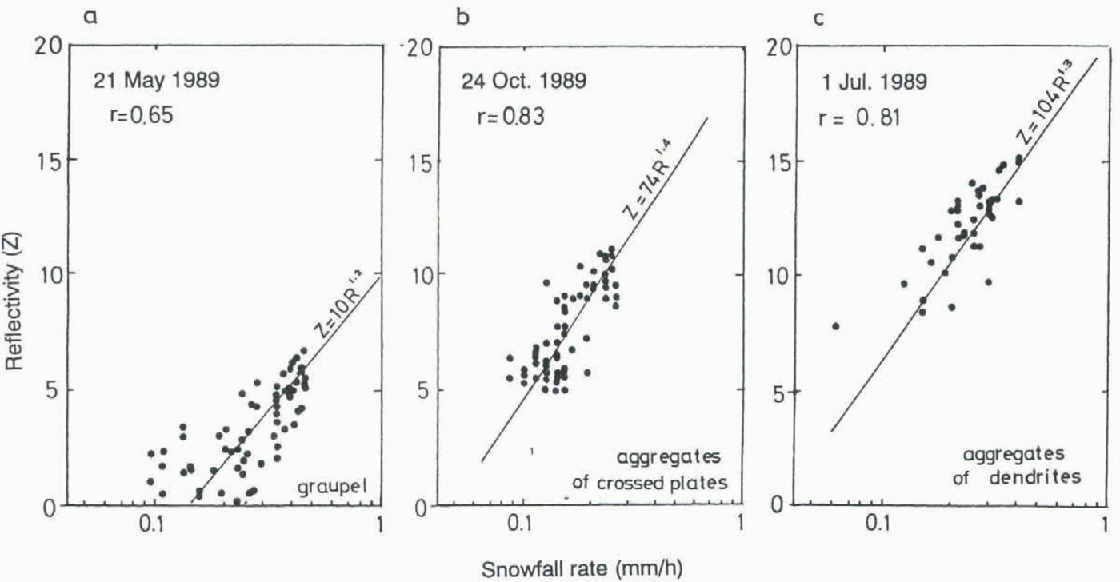
Relationship between radar reflectivityfactor, Z, and snowfall rate, R, observed in a series of snowfalls at Syowa station. The types ofcrystals were mainly graupel (a) aggregates of crossed plates (b) and aggregates of dendrites (c).
Sea-ice extent was derived from weekly reports of satellite data obtained by the U.S. Navy-National Oceanic and Atmospheric Administration Joint Ice Center. Synoptic charts were also used to trace the trajectories of low-pressure centers in twice daily European Centre for Medium-range Weather Forecasts analysis grid data for 1000 hPa, at a resolution of 2.5°.
3. Estimation of Precipitation Amount
The relationship between the radar reflectivity factor z (mm6m−3) and the snowfall rate R (mm h−1) is usually expressed as  where Β and β are empirically deter-mined constants. Three examples of the Z-R relationship are shown in Figure 1, representing different types of snow particles. These data are from single snowfall events on 21 May, 24 October and 1 July 1989. The figure compares the average reflectivity, Z, calculated from 30 pulses of the vertical pointing radar, with the corresponding snowfall rate, R, measured by the gauge over 5 min intervals. Because the radar reflectivity below the 400 m level was influenced by ground clutter, only data above 400 m are used in the plot.The values of B and β for each snowfall are determined from linear fits to the log-log data of Figure 1.
Values of Band β in the Z-R relation derived from 14 snoufall events observed at Syowa station in 1989
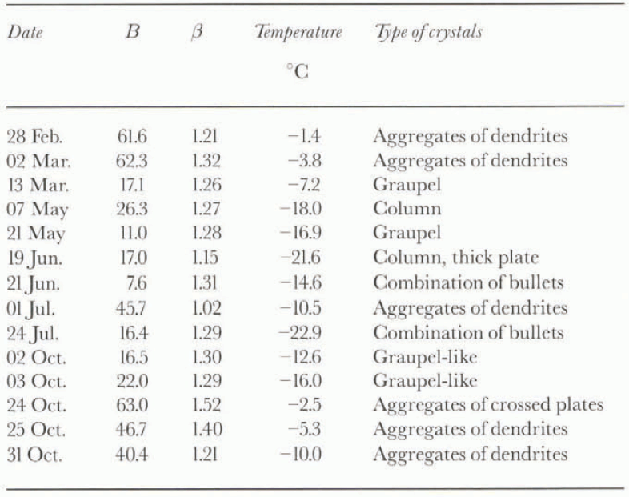
Values of B and β obtained in 1989 are shown in Table 2, together with the type of snow crystals and the daily mean temperature. These values of Β and β are mean values over several series of observations in the day. Since snowfall is usually accompanied by strong wind, a total of only 14 days occurred which were suitable for these observations to be made. Β ranged from 7.6 to 63.0, and β from 1.02 to 1.52. β is adec|uately represented by an average value of 1.3 (mean = 1.27; std dev. = 0.11). These values are almost the same as those summarized for various types of solid precipitation by Reference Sato, Kikuchi, Barnard and HoganSato and others (1981).
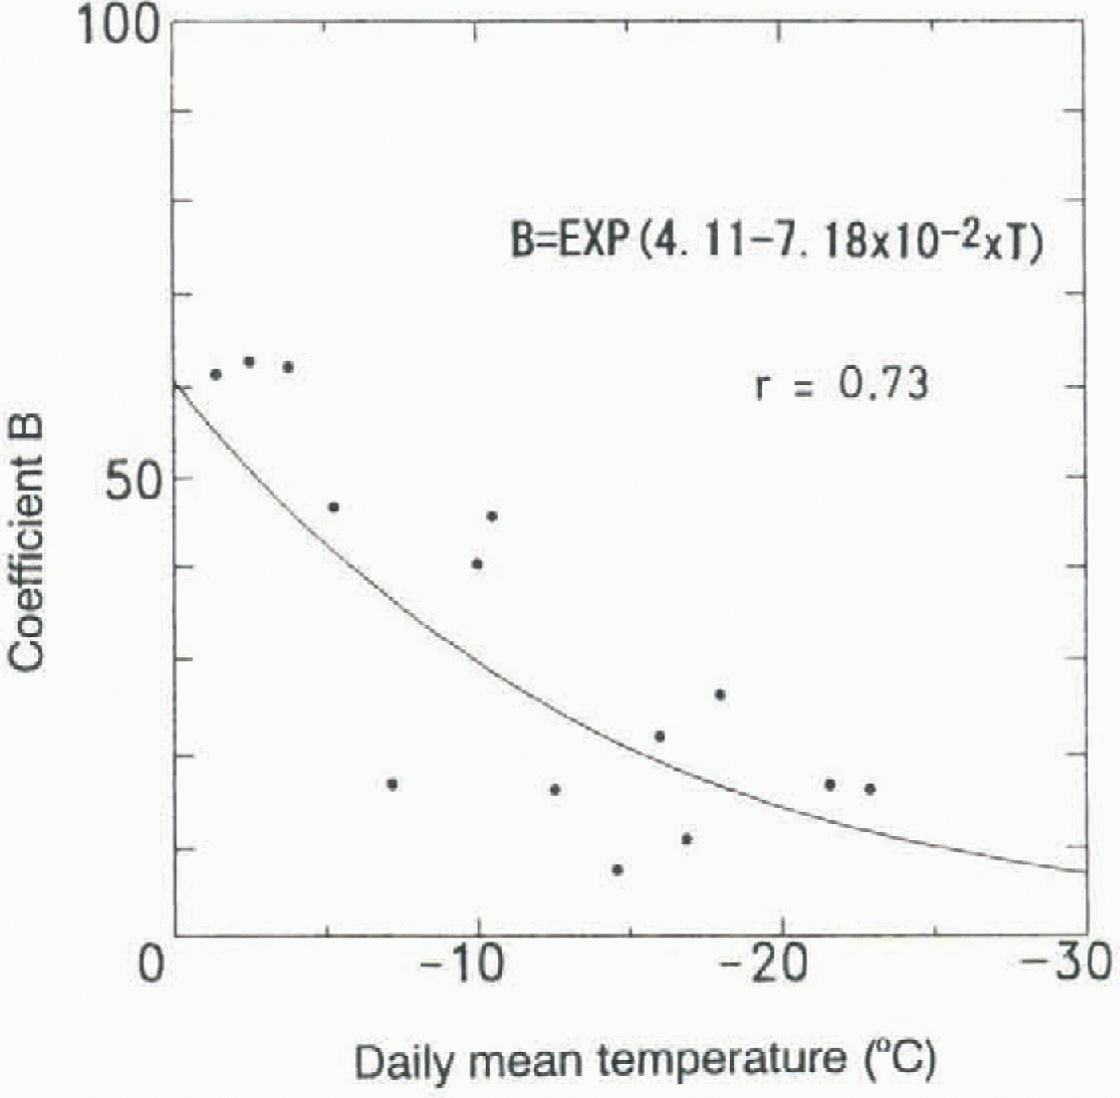
Comparing the cases of graupel on 21 May and aggregates of dendrites on 1 July, the radar reflectivity factors of the former were about 7 times greater than those of the latter at the same snowfall rale. If we use the same values of Β and β for all precipitation, the estimated snowfall rates may contain large errors. We must use the best Ζ-R relation for each type of snow particle to estimate the snowfall rates accurately by using radar data. However, it is impossible to delect the types of snow particles continuously in the strong wind conditions that often prevail in Antarctica. Because the types of snow particles are approximately defined by the surface air temperature, the values of β can be parameterized by air temperature. A large value for Β is induced at higher temperatures, when the snow particles are typically aggregates of dendrites, while a small value for Β is induced at lower temperature when the snow particles are typically columns or bullets. The dependence of Β on temperature in Table 2 is illustrated in Figure 2. It can be seen that the relation between Β and daily mean surface temperature, Τ (°C), is approximated by the regression curve Β = exp (4.11-7.18 x 10 a x T). figure 3b shows the amount of daily snowfall calculated using the Z-R relation, with Β selected according to this temperature dependence and β set to 1.3.
Precipitation was delected by the radar on more than 130 days in 1989. almost all the daily amounts of snowfall were less than 5 mm. The total amount of snowfall was deduced to be 204 mm in 1989. Since the correlation coefficient of the regression in Figure 2 is 0.73, the error in this estimate of the amount of snowfall is about 36%.
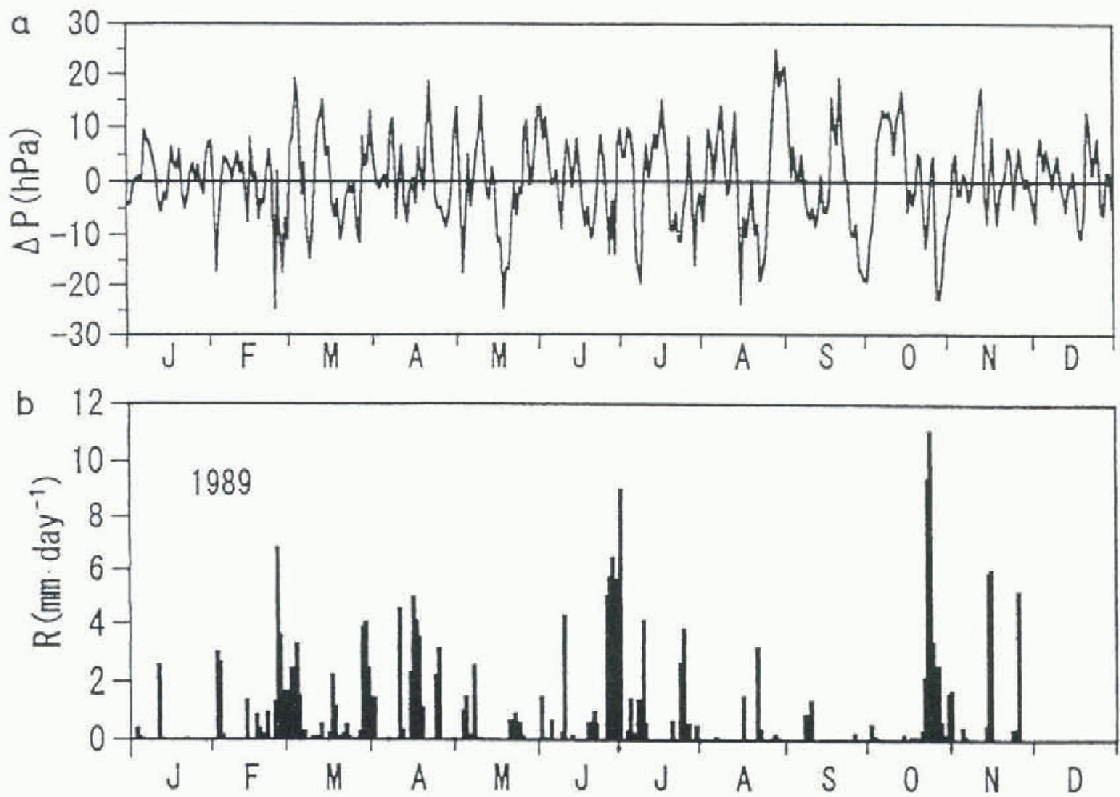
figure 3a represents variations in mean sea-level pressure shown as deviations from 30 day mean values. The ligure indicates that the snowfall usually occurred when the deviation of pressure was negative. This suggests that the snowfalls were associated with low-pressure systems. Carle-ton (1992) also noted that synoptic-scale cyclones are important in the supply of moisture in the form of clouds and precipitation in Antarctica. However, snowfalls did not always occur whenever the deviation of pressure was negative. Some lows did not bring snowfall to Syowa station.
4. Seasonal Variations of Precipitation Amount, 1989
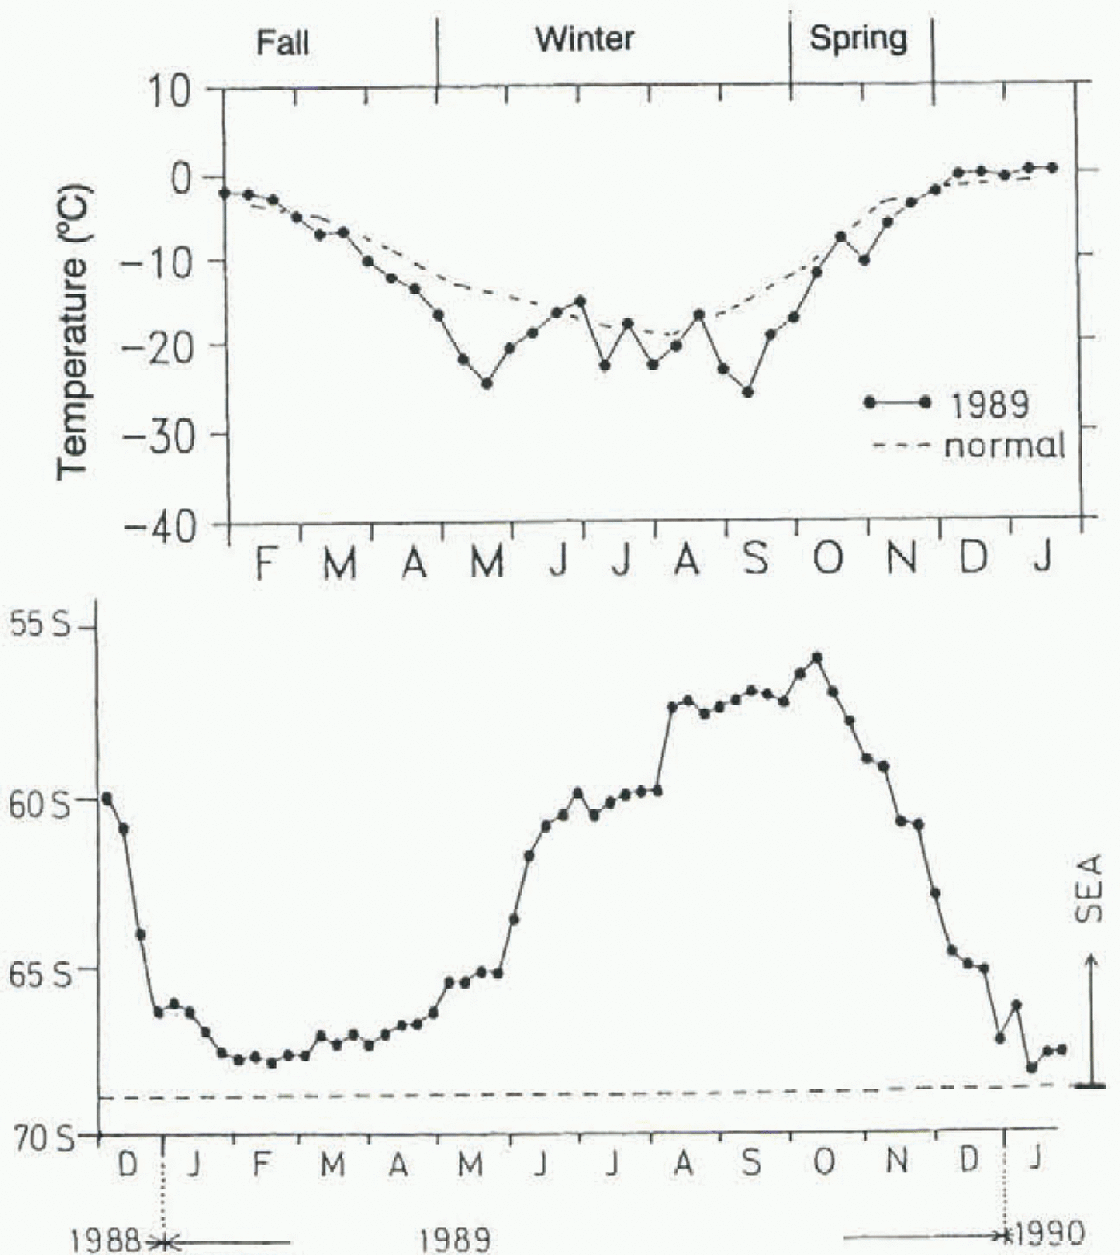
Changes of the surface air temperature and sea-ice extent were investigated to determine whether they affect precipitation at Syowa station. Seasonal variations of surface air temperature at Syowa station, shown in Figure la, are represented by averaged values at intervals of 10 days. Assuming that the winter season is defined by the persistence of low temperatures, it lasted from May to September in 1989. The autumn and spring seasons are similarly defined by the persistence of a tendency for temperature to decrease and increase, respectively. in 1989, these seasons lasted from February to April and from October to November, respectively.
The sea-ice extent along longitude 40° Ε is shown in figure 4b. The autumn season defined by the air temperature corresponds with the season of minimum sea ice. The winter season corresponds with the season of expansion of the sea ice, and the spring and summer season corresponds with the season of rapid reduction of the sea ice.
figure 3b indicates that in 1989 there were three seasons with relatively abundant snowfall at Syowa station. The longest snowy season was in autumn. The total amount of snowfall in this season was about 74 mm. The total amount of snowfall in winter was also 74mm. The other snowy season was spring; the loial amount of snowfall in this season was 53 mm. The peak value of daily snowfall in this season was 11.0 mm d−1, larger than those in other seasons. This indicates that the amount of snowfall tended to be larger for each indiv idual snowfall event in this season than for those in other seasons.
Dependence of Β on daily mean surface air temperature based on the values summarized in lable 2.
The precipitation amounts shown in figure 3b were derived from vertical radar dala, which were obtained at only one observation point, Syowa station. Thus these values are less representative of the area around Syowa station than are those measured by PPI radar within an area extending 64 km around Syowa station. The monthly accumulated snowfall rate is shown in Figure 5, where the values have been estimated from the PPI radar data at 2.0 elevation angle, using the Ζ-R relation z = 53R0.78. This Ζ-R relation has been deduced from a comparison between the snowfall rate at Syowa station and the radar reflectivity factor 10 km north of Syowa station, while sweeping at 6.0 elevation angle. The site of the PPI radar data (to be compared to the snowfall rate) was decided by consideration of the drifting distance due to the horizontal wind. Since the height attained at a distance of 10 km at 6.0° elevation angle is 1000 m, 1000 seconds are needed for snow particles to reach the ground, assuming a falling speed of 1 m s−1, which corresponds to a distance of 10 km drift in a horizontal wind of 10 m s−1. almost all precipitation at Syowa station occurred in northerly wind.
(a) Deviation of surface pressure from 30 day mean values, (b) Daily snowfall rate calculatedfrom vertical pointing radar data.
The small amount of snowfall near the periphery of the observation circle shown in Figure 5 is due to the radar beam reaching the upper parts of precipitating clouds or passing above the cloud lops. Since the radar-echo height was 2.2 km at a distance of 64 km at 2.0° elevation angle, and the heights of echo tops are mostly lower than 4 km at Syowa station (Konishi and others, 1991), the radar beam reached the upper part of clouds or passed above the cloud top near the periphery of the circle. Thus the radar-echo intensity was often small near the periphery.
The snowfall distribution shows that the maximum falls every month were localized near the coast near Syowa station. This local increase of snowfall was caused by orographic effects along the slope near the coast. However, careful investigation reveals some differences in the distribution of snowfall in autumn, spring and winter. in the autumn and spring, the snowfall maxima extend 10-20 km into the continent, whereas, in winter the peak snowfall occurs on the coast or on the sea, and the snowfall is less enhanced. The differences in distribution suggest that the amount of snowfall is larger in autumn and spring than in winter.
5. Seasonal Tendency of Low-Pressure Center Trajectories
Figure 6 shows trajectories of low-pressure centers progressing south of 60° S in the area 0-45° Ε in 1989. The trajectories indicate that the low-pressure centers mainly move eastward, although sometimes they remain stationary or move westward at a high latitude near the continent. The well-developed lows often dissipate near the coast after attaining a high latitude. The lows are classified by trajectory into two groups: one dissipating near the coast, the other moving to the east along the coast. The moving lows often appear in winter and spring, especially in May. in late winter and spring (August-November) some lows pass to the east and retreat Equatorward.
Seasonal variations in the trajectories of low-pressure centers are summarized in Table 3. in total, 64 lows dissipated in the area and 27 lows moved to the east. The ratio between the numbers of dissipating lows and moving lows changed with the season, the percentage of dissipating lows being 81%, 72% and 58% in autumn, winter and spring, respectively.
Numbers of types of low-pressure systems in 1989 (0-45° E, 60-70° S)
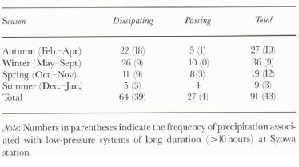
The numbers in parentheses in the table show the frequency of precipitation lasting more than 10 hours for each type of low-pressure system. almost all of the longest precipitation events at Syowa station are associated with dissipating lows. These low-pressure centers usually approach the continent and stay several tens of hours. Therefore the dissipating lows in the area contribute more water supply near Syowa station than do the passing lows.
(a) 10 day averages of temperature observed at Syowa station. Solid line and dashed line show values in 1989 and in a normal year, respectively, (b) Sea-ice edge along longitude 40° Ε defined as the boundary of ice concentration larger than 80%.
6. Discussion and Conclusions
Precipitation phenomena at Syowa station, Antarctica, were observed continuously using two kinds of radars in 1989. The results reveal that the total amount of snowfall was deduced to be 204 mm in 1989. This is lower than the values in earlier works (Reference Kikuchi, Sato and KondoKikuchi and others, 1981) near Syowa station; however, the comparison with other results is meaningless since the methods of measurement are very different. It is thought that our results are more reliable, because the measurements were carried out at short time inervals continuously through the year.
The results also reveal that there were three seasons of abundant snowfall at Syowa station, and the amount of snowfall was uniform in all seasons except summer. The amounts of precipitation (liquid water equivalent) for each season were 74, 74 and 53 mm for autumn, winter and spring, respectively. However, the amount of snow inland from Syowa station is expected to be small in winter, indicated by the distributions of precipitation measured by the PPI radar. Thus the main seasons contributing to the snow accumulation are autumn and spring, when the circumpolar trough develops and moves poleward to high latitudes. However, there are some differences in characteristics of precipitation between these two seasons.
The amount of precipitation in spring associated with a few snowfall events was as large as the amount of precipitation in autumn associated with frequent snowfall events. However, the activities ofcloud systems that bring precipitation are weakened in spring because of a reduced supply of water vapor as the sea ice expands Equatorward. The liquid water content data described by Konishi and others (1994) suggest that cloud systems are more influenced by the sea-ice area in spring than in autumn. and the seasonal variation of the frequency of solid-phase clouds corresponds to the seasonal variation of the sca-ice edge. Thus the frequency of occurrence of low-level clouds was small in spring, as described in Konishi and others (1991).
Monthly accumulated snowfall rate obtained by PPI radar. The amount of snowfall is contoured every 10 mm month. The thick solid line shows the coast of Antarctica.

Therefore, if the number of snowfall events changes from year to year due to some cause such as changing trajectories or the frequency of lows, it is expected that the interannual variation of the amount of precipitation will be less in autumn but greater in spring. The amount of precipitation summed for several snowfall events does not greatly affect the total amount of precipitation in autumn, because precipitation in autumn occurs in many snowfall events. in contrast, in spring, precipitation occurs in only a few snowfall events. Furthermore, since the sea-ice extent in late spring decreases rapidly, it is expected that the location of the sea-ice edge will also vary from year to year, producing variations in the amount of precipitation from year to year. It is thus expected that the amount of precipitation around Syowa station consists mainly of a relatively constant com-ponent in autumn and a yearly fluctuating component in spring.
Since this study is based on only one year's data at one observation point, further work is needed to compare these results with data at other points and from other years.
Trajectories of low-pressure centers south of latitude 60° S. Crosses show where low-pressure centers dissipated. The hatched region shows the continent, and the shaded area shows the sea-ice extent at the heginning of each month.

Acknowledgements
This sludy was carried out as a link in the chain of the project of Antarctic Climate Research (ACR). The authors wish to thank all the wintering members of the 30th Japanese Antarctic Research Expedition for their support in setting up and maintaining the observation instruments. They especially wish to thank the wintering members of the Japanese Meteorological Agency for their generous offering of useful data.



