


Introduction
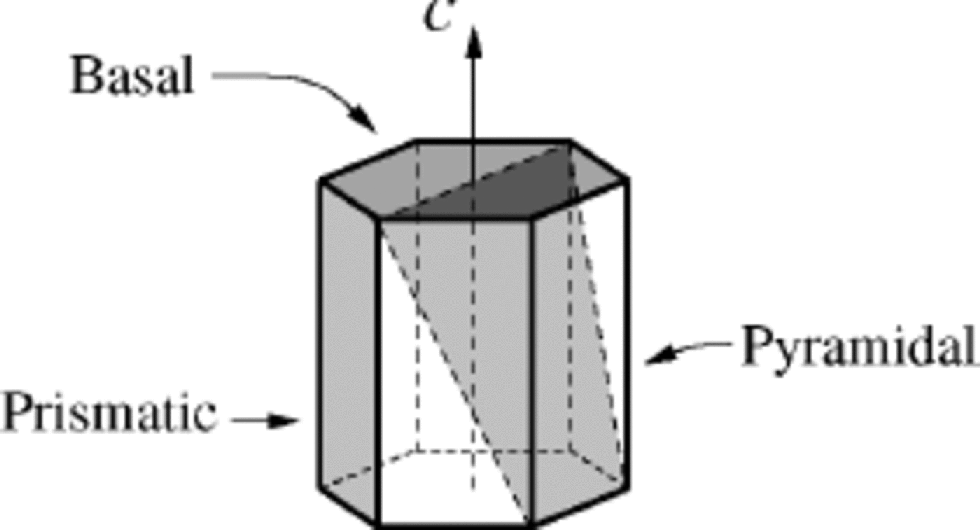
In most aspects, monocrystalline ice is a very an isotropic material. As discussed more than a century ago by Reference NordenskjöldNordenskjöld (1861), some of its basic features can be well represented by considering a right hexagonal monocrystalline prism (see Fig. 1). Basal planes (0001) are the planes of densest packing of molecules and lie orthogonal to the c axis, which is the axis of optical and crystallographic (hexagonal) symmetry of the crystal. the prismatic faces {1·100}, on the other hand, are parallel to this axis, while pyramidal planes, like {1·101},are those which cross the bulk of the prism.
In the range of plastic deformation, the anisotropy of ice is quite marked, being expressed through the fact that ice single crystals creep very readily by basal slide. This kind of deformation, also called easy glide creep, has been recognized in ice since the end of the 19th century (Reference McConnelMcConnel,1891; see also Reference Faria, Kim and JungFaria and Hutter, 2001), and was later confirmed in a number of different mechanical tests and field observations (see, e.g., the reviews of Reference SteinemannSteinemann, 1958; Reference GlenGlen, 1975; Reference WeertmanWeertman, 1983). Such a highly anisotropic plasticity renders the mechanics of the polycrystalline ice of glaciers and ice sheets a rather complex matter. Numerous attempts have been made to establish a ``universal’’ flow law, relating the strain rate to the stress, which could be used in simulations of ice dynamics. This sought-after flow law has proven to be strongly dependent, among other factors, on the anisotropic distribution of crystallographic orientations (fabric) slowly induced by ice flow (Reference Budd and Jacka.Budd and Jacka, 1989; Reference PatersonPaterson, 1991; Reference AlleyAlley, 1992). Additionally, recent studies (Reference HutterHutter and Vulliet, 1985; Reference Thorsteinsson, Waddington, Taylor, Alley and BlankenshipThorsteinsson and others, 1999; Reference Cuffey, Thorsteinsson and WaddingtonCuffey and others, 2000) have suggested that the distribution of grain-sizes (texture) and/or impurity content may play some role.
Usually, anisotropic ice models reckon the crystalline deformation is produced entirely by basal glide, under the assumption that the stress is uniform, i.e. it is the same for all grains of the polycrystal (Reference SachsSachs, 1928; Reference ReussReuss, 1929). In this case, it is expected that additional mechanisms (often not considered in the modelling), such as diffusional flow, dislocation climb, kink bands, grain-boundary sliding and migration, polygonization and dynamic recrystallization, can fulfil the necessity of coherence within the aggregate. Although many models based on these two premises (easy glide creep and uniform stress) were proposed to simulate the dynamics of ice fabrics, they usually considered only the kinematic rotation of c axes due to the applied stress (e.g. Reference Azuma and HigashiAzuma and Higashi, 1985; Reference Fujita, Nakawo and MaeFujita and others, 1987; Reference AlleyAlley, 1988; Reference Lipenkov, Barkov, Duval and PimientaLipenkov and others, 1989; Reference LliboutryLliboutry, 1993; Reference Van der Veen and Whillans.Van der Veen and Whillans, 1994; Reference GagliardiniGagliardini and Meyssonnier, 1999; Reference Thorsteinsson, Waddington, Taylor, Alley and BlankenshipThorsteinsson and others, 1999). Clearly, consideration of c-axis rotation alone builds an incomplete picture of the evolving anisotropy, since microscopic processes referred to by the common term recrystallization, such as grain growth, bending and fragmentation of existing crystals (polygonization) as well as the nucleation of entirely new crystals (dynamic recrystallization), can strikingly affect the final grain-sizes and c-axis fabric.
Whereas recrystallization has been intensively investigated and modelled in metallurgy (e.g. Derby, 1991; Reference Humphreys and HatherlyHumphreys and Hatherly, 1996; Reference DohertyDoherty and others, 1997), in glaciological models it has often been neglected, despite recognition of its importance for the mechanics of polycrystalline ice (Reference PatersonPaterson, 1991; Reference DuvalDuval and Castelnau, 1995; Reference GowGow and others, 1997; De La Reference Chapelle, Castelnau, Lipenkov and DuvalChapelle and others, 1998; Reference Jacka, Jun and HondohJacka and Li, 2000). Moreover, pioneering approaches to incorporate dynamic recrystallization in ice models (e.g. Reference Van der Veen and Whillans.Van der Veen and Whillans,1994) are usually impaired by their artificial mechanisms based on physically flimsy grounds.
Sketch of a single ice crystal in the form of a right hexagonal prism. Three types of crystallographic planes are indicated.
The present work represents a preliminary attempt to construct a simulation tool, grounded on existing knowledge of ice microstructure evolution,which could be applied to test different physical hypotheses assumed in anisotropic ice models. the model is based on a Cellular Automaton (CA) algorithm developed by D. Ktitarev, in collaboration with G. Gödert and K. Hutte. (personal communication from D. Ktitarev, 2001), and contains several coupled microstructural mechanisms which promote changes in fabric and texture, such as grain growth, polygonization and dynamic recrystallization. At the present stage, however, the influence of impurity concentrations is not considered, due to lack of information for its mathematical modelling.
It has been shown in recent publications in the material science literature that the CA method represents a useful tool which is sufficiently flexible to model recrystallization processes (Reference Hesselbarth and GöbelHesselbarth and Göbel, 1991; Reference Goetz and SeetharamanGoetz and Seetharaman, 1998a, Reference Goetz and Seetharamanb; Reference Marx, Reher and GottsteinMarx and others, 1999). Like the finite-element method, which has also recently been employed to simulate the micromechanics of ice (Reference Meyssonnier and PhilipMeyssonnier and Philip, 2000), CA requires a partition of the body into discrete areas, so-called cells, which are associated with generalized state variables and arranged in a regular environment (e.g. a lattice structure). CA models are generally characterized by their local transformation rules and are more flexible than finite-element methods with respect to the interaction of cells, modelling singularities and spontaneous effects.
The Model
Theoretical grounds
The main objective of the model is to reproduce the typical features of texture and fabric of ice polycrystals as they evolve by descending from the top into deeper layers of an ice sheet. Aiming for a definite problem, the present simulation focuses on the evolution of a small sample of ice, formed from snow on a free surface located in the dome of a hypothetical ice sheet. As the mass of ice flows down to the bottom, it deforms under the action of vertical compression by the layers above it. for simplicity, we consider at this stage only the ideal situation where the compression is constant and no additional shear stresses occur (i.e. unconfined compression). the sample is assumed to be extremely thin, like a shallow pillbox or a slender slice of an ice core (Fig. 2, top). This yields the description of the polycrystalline piece to a two-dimensional aggregate, and allows the assumption that the sample has the same type of microstructure and experiences the same mechanical processes as the surrounding material. Moreover, for the simple case of uniaxial compression considered here, it is expected that the kinematic rotation as well as the recrystallization processes possess rotational symmetry. from these considerations it follows that the problem of characterizing the polycrystalline microstructure is reduced to a one-dimensional description of the aggregate (Fig. 2, centre) by two structural quantities, namely, the distribution of grain-sizes and the crystallographic orientations. Since the proposed algorithm aims at a qualitative description, only dimensionless variables and parameters will be considered.
To discretize the problem according to the CA method,
Top: model of ice sample employed in the CA simulation. the diameter is approximately that of an ice core (=10 cm), while the thickness is assumed to be many orders of magnitude smaller than this. Centre: radial slice of the sample. Cell divisions (dashed lines) and grain boundaries (solid lines) are presented. Bottom: one-dimensional representation of the sample used in the algorithm. Cell divisions (bars) and grain boundaries (circles) are indicated.
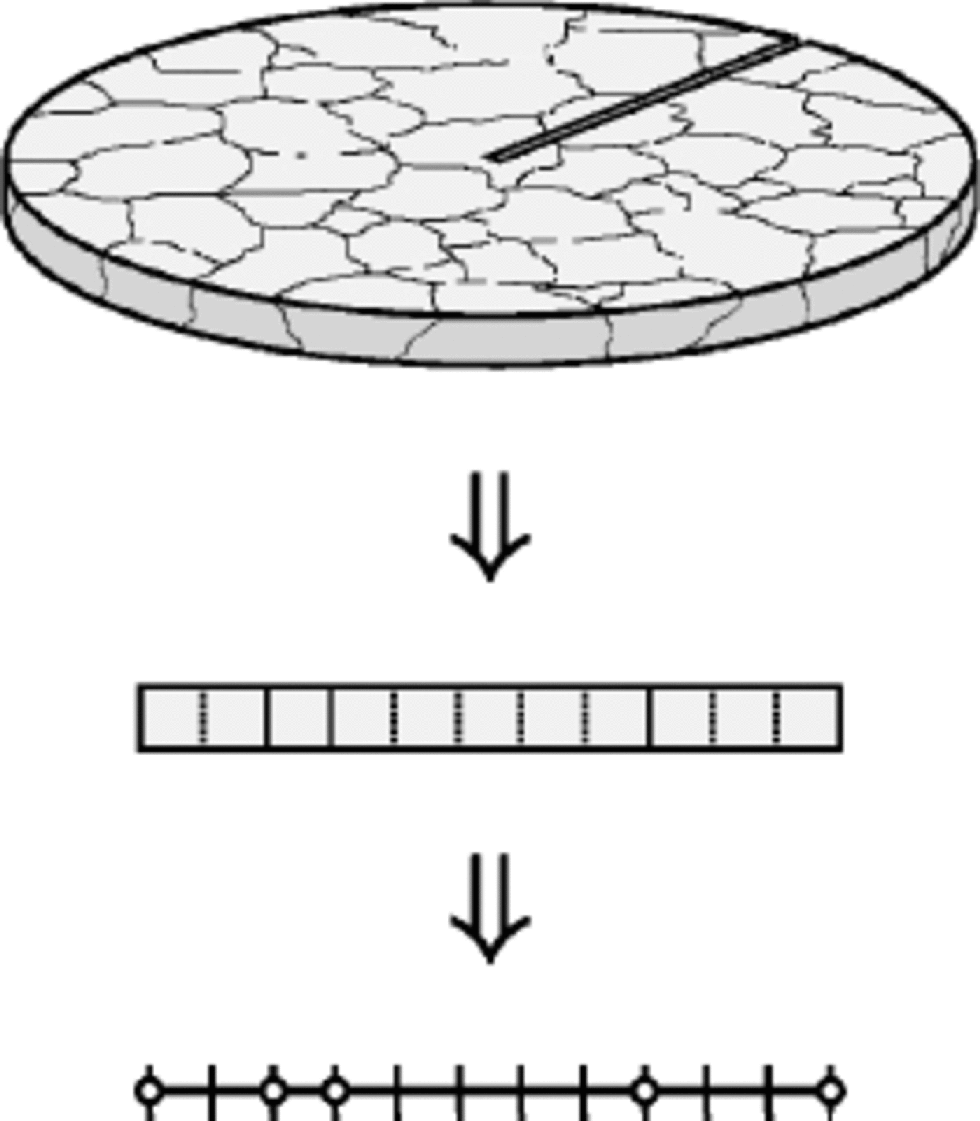
we take a one-dimensional lattice of N equal cells (Fig 2, bottom). Collections of neighbouring cells with the same crystallographic orientation represent the M grains of the polycrystal, in such a way that each grain k (k=1,....,M) contains lk cells. Every cell i(i=1,...,N) corresponds to a grain of minimum size Dmin (typically of the order of a millimetre), and therefore the size of a grain k is computed by Dk= Dminlk of course, M and lk can vary in time, while N and Dmin are constant. the basic dynamical quantity of the algorithm is the dislocation density of the cells ρi, which describes the length of dislocations per unit volume. Dislocations are created in ice during its deformation. Their production depends on the orientation of the particular grain, which is defined by the angle θk between the c-axis unit vector nkand the vertical. Texture and fabric changes in deforming ice develop as a result of kinematic (strain-induced) rotation and recrystallization processes, i.e. grain growth, polygonization and dynamic recrystallization, this last taking place when a critical value of the dislocation density is reached.
Kinematic rotation, normal grain growth and polygonization
Strain-induced rotation of grains is governed by a kinematic equation, which is easily derived using standard arguments of the micromechanical theory of crystals (see, e.g., Reference AsaroAsaro, 1983). for the case of ice under uniaxial compression, it can be shown (Reference Svendsen and HutterSvendsen and Hutter, 1996; Reference Gödert and HutterGödert and Hutter, 1998, Reference Gödert and Hutter2000) that this equation reads

where  is the inelastic (or plastic) spin tensor,
 is the basal shearing rate and S
k is a unit vector orthogonal to n
kand parallel to the shear direction−all these quantities related to a given grain k−while ⊗ denotes the tensor product. Considering the slow changes in the stress state and the comparatively low deviatoric stresses expected to occur near to the dome of an ice sheet (e.g. below 50 kPa in Greenland’s Summit, according to Reference Greve, Mügge, Baral, Albrecht, Savvin and BeerGreve and others, 1999), it becomes physically reasonable to propose, in a first approximation, a linearly viscous relation for the basal shearing rate This choice, which is not without precedents in the literature (see, e.g., Reference LileLile, 1978; Reference HutterHutter 1983; Reference LliboutryLliboutry, 1993; Reference Meyssonnier and PhilipMeyssonnier and Philip, 1996; Reference GagliardiniGagliardini and Meyssonnier,1999), implies that

where τk is the resolved shear stress on the basal plane of the crystal k, σ is the compressive stress (assumed the same for all grains of the sample) and the material constant η–1 is the basal fluidity (viscosity–1) of the ice crystals. Hence, by recalling the assumed rotational symmetry of the micro-structure with respect to the vertical axis of compression, one can deduce from Equations (1) and (2) the evolution equation for θk:

The homogeneous increase of grain-size, driven by the surface energy of grain boundaries, is called normal grain growth. According to Reference GowGow (1969) (see also Reference PatersonPaterson, 1994; De La Reference Chapelle, Castelnau, Lipenkov and DuvalChapelle and others, 1998), for the particular case of polar ice there holds the usual Burke–Turnbull parabolic growth law for the average grain-size

where the constants D0 and K denote the initial average grain-size and the normal grain-growth rate, respectively. In the numerical algorithm, the discretization of Equation (4) implies that a fraction  of grains are consumed by their larger neighbours at each time-step.
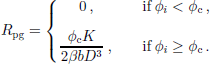
Nevertheless, ice crystals do not grow indefinitely, since they tend to bend and fragment under increasing strain by polygonization. Such a crystal breaking can be easily modelled by assuming that, for the case of polar ice, the dislocation density ρi is dominated by the density of geometrically necessary dislocations, which are arranged in a dynamic structure of subgrain walls, while the density of statistically stored dislocations is considered negligible (Reference AshbyAshby, 1970; Reference Sandström and LagneborgSandström and Lagneborg, 1975). Hence, we can introduce the misorientation subgrain angle by the formula (cf. Reference Humphreys and HatherlyHumphreys and Hatherly, 1996; Reference Montagnat and DuvalMontagnat and Duval,2000)

where b is the length of the Burgers vector and β is a scaling factor. When the misorientation angle of the cell i exceeds a certain threshold value ϕc, then the respective grain k polygonizes at that cell, i.e. it splits into two grains k1 and k2 with orientations  of the order of few degrees). Analogously to the normal grain growth, in the numerical algorithm we allow a fraction Φpg of grains to polygonize, when the corresponding condition above is fulfilled. At this moment it should be clear that such a random update is usually employed in CA simulations of polycrystals when the dynamic rule for the particular grain depends also on its neighbours (see, e.g., Reference Hesselbarth and GöbelHesselbarth and Göbel, 1991; Reference Goetz and SeetharamanGoetz and Seetharaman, 1998a, Reference Goetz and Seetharamanb). In the present simulation, reasonable results have been obtained for Φpg = 20%.
Recovery and dynamic recrystallization
Following Reference Montagnat and DuvalMontagnat and Duval (2000), we assume that the dislocation density of each cell is balanced by three distinct processes, namely, production by work-hardening, reduction by grain-growth recovery and decrease by polygonization recovery, which are respectively given by

with α denoting the recovery rate factor, while
Considering the argumentation of Reference Montagnat and DuvalMontagnat and Duval (2000) and results of the measurements of Reference Hondoh, Iwamatsu and MaeHondoh and others (1990), other mechanisms of recovery (e.g. by dislocation climb) are not considered in the model.
During dynamic recrystallization, new grains, with crystallographic orientations usually differing from those of the surrounding crystals, nucleate and grow rapidly, consuming older grains. In ice sheets, observations in situ show that dynamic recrystallization becomes significant only in the last few hundred metres above the bedrock, where the ice temperature becomes sufficiently high (close to –10˚C, as argued by Reference DuvalDuval and Castelnau, 1995), provided that a sufficient amount of mechanical energy is stored in the grains. Since the influence of temperature is not yet accounted in the modelling, dynamic recrystallization is activated in the simulation 0 only from a certain time-step on, which means that the corresponding modelled ice sample is located below a critical depth.
Currently, there are many hypotheses on the mechanisms of dynamic recrystallization, most of them based on the evidence that nucleation of a new crystal probably occurs at the boundary of an existing grain (Reference Sandström and LagneborgSandström and Lagneborg, 1975; Derby, 1991; Reference Humphreys and HatherlyHumphreys and Hatherly, 1996; Reference DohertyDoherty and others, 1997). Hence, as in the case of polygonization discussed above (see also Reference Hesselbarth and GöbelHesselbarth and Göbel, 1991; Reference Goetz and SeetharamanGoetz and Seetharaman, 1998a, Reference Goetz and Seetharamanb), the program checks a fraction Φrx of the total number of grains in the system at each time-step, verifying if the dislocation density at their boundary cells exceeds the threshold value  where
 is the average dislocation rate, m = 0.2 is the strain-rate sensitivity and Crx is a scaling factor (Reference PeczakPeczak and Luton, 1994; Reference Goetz and SeetharamanGoetz and Seetharaman, 1998a). If the condition is fulfilled, then the boundary cell i is converted into a new grain i → k and begins to grow. In the present simulation, we opted for the typical fraction Φrx =1%.
As remarked by Reference DuvalDuval and Castelnau (1995) and De La Reference Chapelle, Castelnau, Lipenkov and DuvalChapelle and others (1998), dynamic recrystallization is characterized by a very rapid grain-boundary migration rate, i.e. its rate is much higher than that of normal grain growth. to express such an abnormal grain growth in the algorithm, at every time-step we let the newly born grain consume up to 10 cells from both right and left. This consumption is possible if the neighbouring grains are not growing abnormally at the same time. the grain ceases to grow if it is hindered by another abnormally growing grain or if the critical size of the steady state  is reached, with Css denoting a proportionality factor (Derby, 1991; Reference Goetz and SeetharamanGoetz and Seetharaman, 1998a, Reference Goetz and Seetharamanb). the crystallographic orientation of the new grain is prescribed by the hypothesis proposed by Reference Kamb, Heard, Borg and RaleighKamb (1972) that the recrystallized grain takes the orientation of a soft crystal most favourable for plastic deformation by easy glide. In the particular case of vertical compression considered here, this corresponds to an angle θk = π/4.
Thus, these five rules, namely, increase of dislocation density, kinematic rotation, normal grain growth, polygonization and dynamic recrystallization, are used in the system of grains at each time-step. the first two rules are applied to all grains (sequential update), and the last three are applied to fractions of randomly chosen grains, for the reasons already explained.
Comparison With Data from Ice Cores At the Summit
In this section we compare the results of the CA simulation, as described above, with the microstructural features observed in ice cores from Greenland’s Summit, namely, the Greenland Ice Core Project (GRIP) and Greenland Ice Sheet Project 2 (GISP2) ice cores. of course, there is no pretension to reproduce accurately field observations, since the actual model is still constrained by suitable simplifications to the idealistic situation sketched in the previous section. Nevertheless, this comparison will prove fruitful in determining guidelines for further improvements of the model towards more realistic simulations of polar ice microstructures. the ice-core data utilized in this section were provided by the U.S. National Snow and Ice Data Center, University of Colorado at Boulder, and the World Data Center-A for Paleoclimatology, National Geophysical Data Center, Boulder, CO (see also Reference ThorsteinssonThorsteinsson, 1996; Reference GowGow and others, 1997; Reference Thorsteinsson, Kipfstuhl and MillerThorsteinsson and others, 1997) and include fabric, texture, age and impurity data.
For the CA simulation we choose a one-dimensional grid of N = 1000 cells. At the initial configuration, the same dislocation density is attributed to each cell, and different grain-sizes are uniformly distributed over M0 =100 grains, so that the initial mean grain-size is equal to 10 cells. the program executes 10 000 discrete time-steps of 25 years, corresponding to 250 000 years BP. In order to avoid the complications of the initial regime of deformation, where primary creep, firn densification and other transient processes dominate, the simulation starts 500 years BP, which corresponds to a depth of about 145m for GRIP (according to the ss09 scale) and 155m for GISP2 (Meese/ Sowers scale), with typical strains of just a few per cent (Reference Dahl-Jensen, Johnsen, Hammer, Jouzel and PeltierDahl-Jensen and others, 1993 ;Reference ThorsteinssonThorsteinsson, 1996). for the initial distribution of c axes at that depth, we take a fabric with slight anisotropy similar to that exhibited in the diagrams from GRIP and GISP2 ice cores (Reference ThorsteinssonThorsteinsson, 1996; Reference GowGow and others, 1997). All the rules of the algorithm depend on time and are applied at each step to the system of grains, except dynamic recrystallization. This last is built in the algorithm starting from the 4640th time-step (116 kyr BP), corresponding in GRIP to a temperature above –15˚C and a depth of approximately 2800 m, which is where coarse-grained ice was first observed (Reference ThorsteinssonThorsteinsson, 1996). This starting point for dynamic recrystallization also suits the estimations of Reference DuvalDuval and Castelnau (1995) and the GISP2 data (Reference GowGow and others, 1997).
Figure 3 presents a comparison of the fabrics from the GRIP ice core with those obtained in the CA simulation, for four different ages. These fabrics represent four different regimes, dominated respectively by normal grain growth, polygonization, strong single-maximum anisotropy and dynamic recrystallization. It can be seen that the qualitative agreement is remarkable, and even a quantitative consonance is found, except for the last fabric (151kyr BP). There are two main reasons for this last discrepancy. First, it has been
Comparison of fabric diagrams from GRIP and CA simulation. Correspondent histograms from simulation are also shown, indicating the fraction of c axes at each inclination from the vertical. the sinusoidal curve in histograms (dashed line) corresponds to an isotropic distribution of c axes.
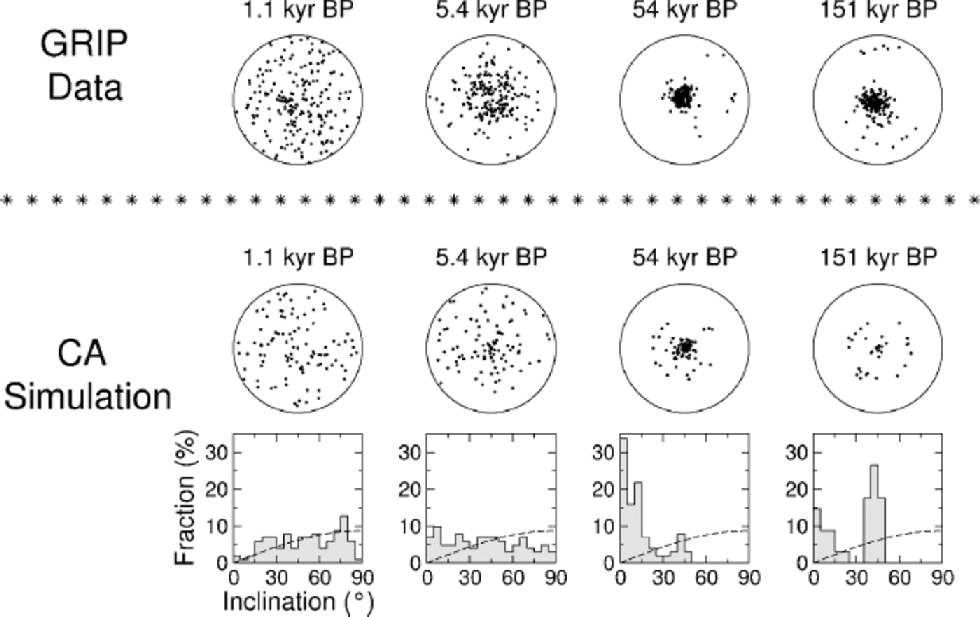
observed that the fine-grained ice from that particular age presents a high impurity content (especially calcium), which seems to inhibit the degradation of the single maximum by dynamic recrystallization (Reference ThorsteinssonThorsteinsson, 1996). Second, it is expected that shear stresses become significant at that depth even for the GRIP site (Reference HvidbergHvidberg and others,1997), reinforcing the maintenance of the single maximum.
Careful analysis of the last two fabrics also reveals some slight features of the simulation that deserve comment. the histogram of the third simulated fabric (54 kyr BP) indicates the formation of a weak circle girdle around the strong single maximum, which obviously cannot be accredited to dynamic recrystallization, since this is not activated by the program at that age. Such a structure seems to be formed by polygonization, and similar formations have often been observed in different simulations. Unlike girdles formed by dynamic recrystallization, such patterns tend to be feeble and sometimes transient, due to the action of kinematic rotation. on the other hand, it should be observed that, in the simulation, central peaks are hardly extinguished even under strong dynamic recrystallization, as evidenced in the last simulated fabric (151kyr BP). This deficiency in the modelling is due to the assumption that the stress in each grain is equal to the applied bulk compression. Indeed, Equations (2) and (6) show that the dislocation density of crystals with vertical c axis cannot increase in this case. This impedes the polygonization and/or dynamic recrystallization of these grains, which can be consumed only through grain growth. By allowing the occurrence of intra- and intercrystalline stresses, generated by the necessity of coherence within the aggregate, the dislocation density of vertically oriented grains would undergo a rapid increase, enabling them to polygonize and/or recrystallize much more easily. In this case, the typical structure to be found in unconfined compression would be a small circle girdle, generated by polygonization and dynamic recrystallization processes, in agreement with laboratory and field observations (Reference BuddBudd, 1972; Reference Budd and Jacka.Budd and Jacka, 1989; Reference Jacka, Jun and HondohJacka and Li, 2000).
Finally, comparisons of the GRIP data with the simulated results for the evolution of the strength of fabric R(t) and the mean grain-size D(t) are given in Figures 4 and 5. the first quantity is defined by the formula (see, e.g., Reference CastelnauCastelnau and others, 1996; Reference ThorsteinssonThorsteinsson, 1996)
Evolution of the strength of orientation R. Data from GRIP (circles) and CA simulation (solid line) are shown. Just for reference, R =40% corresponds to all c axes inclined at an angle of about π/4 from the vertical.

Evolution of the mean grain-size D. Data from GRIP (circles) and CA simulation (solid line) are shown.
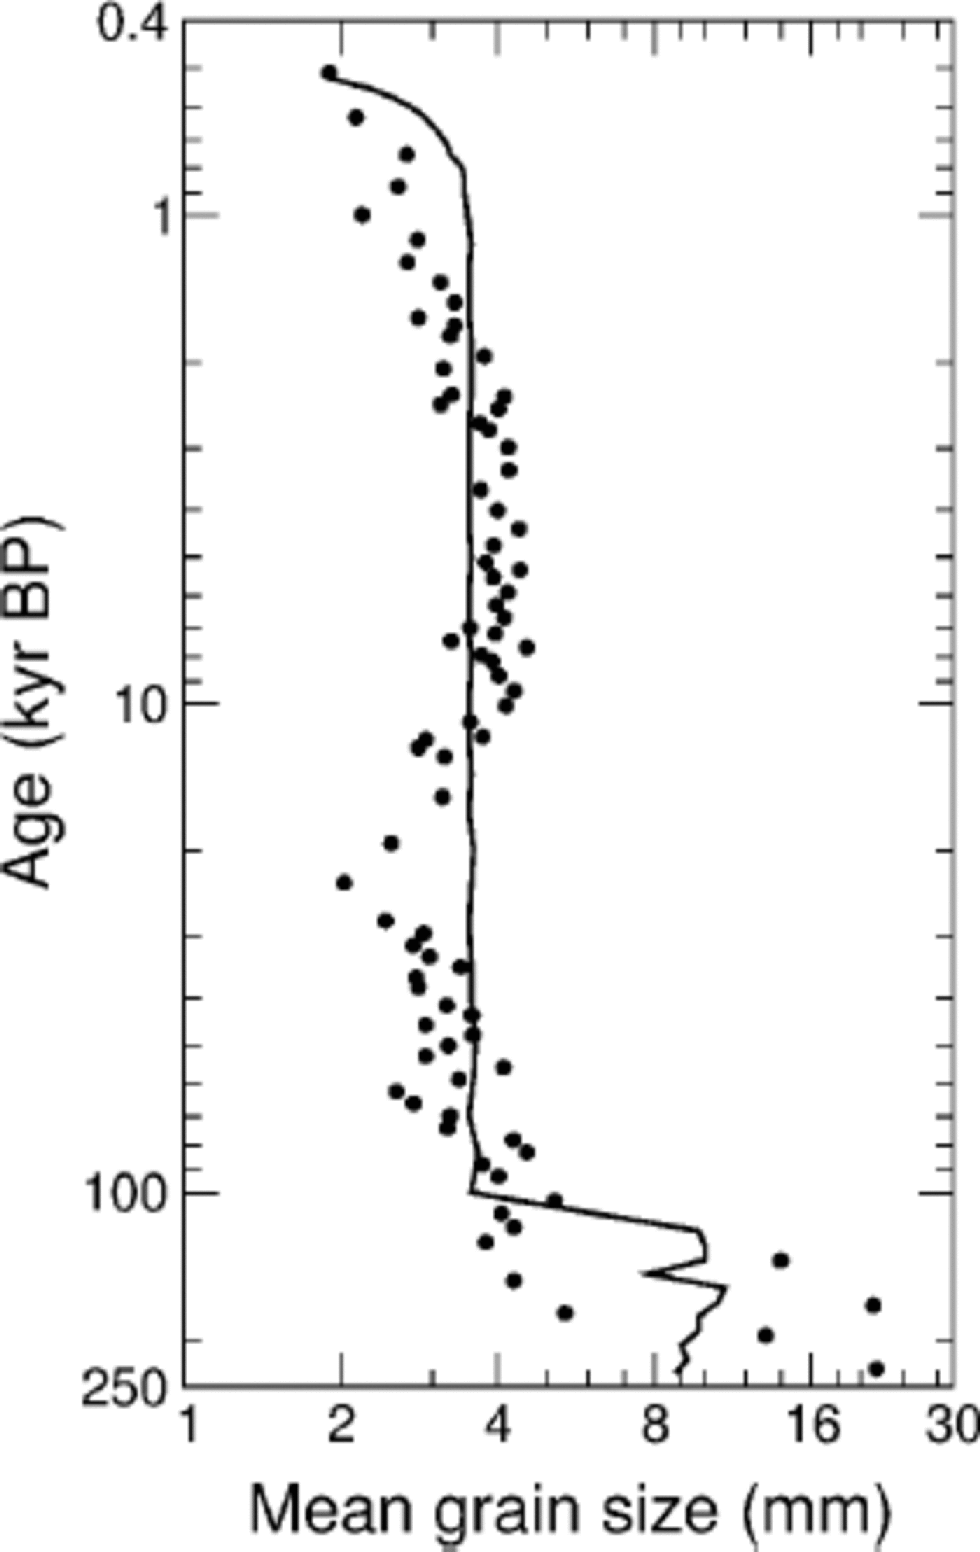

with  the two extrema corresponding to an isotropic distribution and a perfect alignment of c axes, respectively. It can be seen from Figure 4 that simulation and field data agree very well over the whole time interval, except for some casual numerical perturbations without physical significance (e.g. about 4 kyr BP). on the other hand, the correlation between observed and simulated mean grain-sizes in Figure 5 is qualitatively rough. the main reason for this is the fact that, in the model, the normal grain-growth rate K in Equation (4) is assumed to be a material constant, while in practice it should be a function, at least, of temperature and impurity content (Reference Jacka and JunJacka and Li, 1994; Reference Alley and WoodsAlley and Woods, 1996; Reference Thorsteinsson, Kipfstuhl and MillerThorsteinsson and others, 1997; De La Reference Chapelle, Castelnau, Lipenkov and DuvalChapelle and others, 1998). In fact, the hypothesis of a diagenetic-temperature memory influence on K cannot yet be ruled out (Reference Petit, Duval and LoriuPetit and others, 1987). Moreover, detailed analyses of grain-boundary mobility in diverse materials have shown that the crystallographic misorientation across the boundary can have a strong influence on the grain-growth kinetics (Reference Heckelmann, Abbruzzese, Lücke and AbbruzzeseHeckelmann and others, 1992; Reference Humphreys and HatherlyHumphreys and Hatherly, 1996; Reference DohertyDoherty and others, 1997). Finally, it must be remembered that Expression (5) for the misorientation subgrain angle is a gross approximation.
All these comments suggest that expressions much more complex than Equation (4) with K = const. and Expression (5) are needed, in order to reproduce realistically the evolution of grain-size in polar ice cores. Such improved expressions should slow down grain-boundary migration and retard the onset of polygonization, tending to promote a time-dependent grain-growth rate as well as the marked reduction in mean grain-size observed in GRIP and GISP2 ice cores during the Last Glacial Maximum, about 21 kyr BP (Reference PatersonPaterson,1991; Reference GowGow and others 1997; Reference ThorsteinssonThorsteinsson, 1996).
Conclusion
We have proposed a model for simulations of texture and fabric development in polycrystalline ice based on a CA algorithm, developed by D. Ktitarev in collaboration with G. Gödert and K. Hutter. which allows us to consider simultaneously several microstructural mechanisms, from kinematic rotation to recrystallization processes. Due to the flexibility of the model in combining and updating rules for the evolving grain-size and crystallographic orientation distributions, a wide variety of physical hypotheses for ice-microstructure evolution are easily testable.
Although this preliminary attempt is presently constrained to a one-dimensional description of a hypothetical ice core, comparison of the simulation predictions with data from GRIP and GISP2 ice cores was satisfactory and provided valuable guidelines for the further development of more realistic models. Among the most significant improvements seen to be required are: the need for a two-dimensional generalization of the modelling, able to incorporate horizontal shear stresses and rotationally asymmetric fabrics; the allowance of stress fluctuations (i.e. intra- and intercrystalline stresses) within the aggregate, instead of the assumption of uniform stress; and the replacement of the simple rules adopted for grain growth and polygonization with more elaborate mechanisms depending, at least, on temperature and impurity content. These improvements have now been implemented, and their consequences will be presented elsewhere.
Acknowledgements
This work was supported by the Deutsche Forschungsgemeinschaft, project Hu 412/15-1.2 (DK, KH), and by the Coordenação de Aperfeiçoamento de Pessoal de Nível Superior/ CAPES of Brazil (SHF). We are deeply grateful to G. Gödert, R. Greve, H. Ehrentraut, B. Svendsen, Th. Thorsteinsson, O. Castelnau and P. Duva. for useful discussions and comments, as well as toW. F. Budd for constructive criticism.



