Introduction
Biogeographic studies on the occurrence and distribution of species are vital for the understanding and maintenance of biodiversity (Cowman et al., Reference Cowman, Parravicini, Kulbicki and Floeter2017). Understanding geographic variations in the occurrence and distribution of species also helps monitor changes in global biodiversity and identifies areas for conservation prioritization (Blowes et al., Reference Blowes, Supp, Antão, Bates, Bruelheide, Chase, Moyes, Magurran, McGill, Myers-Smith, Winter, Bjorkman, Bowler, Byrnes, Gonzalez, Hines, Isbell, Jones, Navarro, Thompson, Vellend, Waldock and Dornelas2019). The arrangement or grouping of regions with similar species assemblages is not only critical for setting conservation priorities but also for the management of natural resources and ecosystem goods and services (Kulbicki et al., Reference Kulbicki, Parravicini, Bellwood, Arias-Gonzalez, Chabanet, Floeter, Friedlander, McPherson, Myers, Vigliola and Mouillot2013). However, many existing management units such as fisheries areas and Large Marine Ecosystems are not based on biogeography and are unlikely to accurately represent the distribution of species and wider biodiversity (Costello et al., Reference Costello, Tsai, Wong, Cheung, Basher and Chaudhary2017). Biogeography can also help in the understanding and monitoring of potential effects of impacts such as non-native species introductions, habitat destruction, resource utilization and climate change (Albouy et al., Reference Albouy, Guilhaumon, Leprieur, Lasram, Somot, Aznar, Velez, Le Coc'h and Mouillot2012).
Estuaries are transitional environments where rivers meet the sea; they are highly variable ecosystems where factors such as salinity, temperature, depth, and currents can fluctuate on a daily and seasonal basis. Estuaries also vary in terms of size and morphology and include large inlets and rivers that are permanently connected with the sea to small systems that only have an intermittent connection with the adjacent coastal environment. The fishes that utilize estuaries therefore are restricted to those that can withstand the highly variable conditions that characterize these environments. A variety of fish species, however, utilize estuaries and these include species of marine origin, freshwater species, migratory (diadromous) species, as well as resident species (Elliott et al., Reference Elliott, Whitfield, Potter, Blaber, Cyrus, Nordlie and Harrison2007). A number of studies have examined biogeographic patterns of estuarine fishes at a regional scale including California, USA (Horn & Allen, Reference Horn and Allen1976; Horn et al., Reference Horn, Allen, Lea, Allen, Pondella and Horn2006), Tasmania, Australia (Edgar et al., Reference Edgar, Barrett and Last1999), South Africa (Harrison, Reference Harrison2002), southern Africa (Whitfield, Reference Whitfield2005), eastern North America (Nordlie, Reference Nordlie2003), Europe (Coates et al., Reference Coates, Colclough, Robson and Harrison2004), Queensland, Australia (Sheaves & Johnston, Reference Sheaves and Johnston2009), New Zealand (Francis et al., Reference Francis, Morrison, Leathwick and Walsh2011), Brazil (Vilar et al., Reference Vilar, Joyeux, Giarrizzo, Spach, Vieira and Vaske-Junior2013, Reference Vilar, Joyeux and Spach2017), Ireland (Connor et al., Reference Connor, Ryan, Feeney, Roche, Shepard and Kelly2019) and Japan (Kume et al., Reference Kume, Lavergne, Ahn, Terashima, Kadowaki, Ye, Kameyama, Kai, Henmi, Yamashita and Kasai2021).
Studies that have examined estuarine fish communities at a global scale have included investigations into factors affecting estuarine fish species richness (Vasconcelos et al., Reference Vasconcelos, Henriques, Franca, Pasquaud, Cardoso, Laborde and Cabral2015), global patterns of fish assemblage composition among and within biogeographic regions in relation to dispersal and environmental filtering mechanisms (Henriques et al., Reference Henriques, Cardoso, Cardoso, Laborde, Cabral and Vasconcelos2017a), ecosystem features that act as drivers of patterns of fish functional traits among estuaries worldwide (Henriques et al., Reference Henriques, Guilhaumon, Villéger, Amoroso, França, Pasquaud, Cabral and Vasconcelos2017b), and the sensitivity of fish assemblages in relation to human pressures and level of protection (Vasconcelos et al., Reference Vasconcelos, Batista and Henriques2017). These studies were based on a dataset compiled from the published literature; however, the data requirements for these studies resulted in several regions being poorly represented.
This study examines global zoogeographic patterns of estuary-associated fishes using meta-assemblages compiled at the marine ecoregion scale (Spalding et al., Reference Spalding, Fox, Allen, Davidson, Ferdana, Finlayson, Halpern, Jorge, Lourie, Martin, McManus, Molnar, Recchia and Robertson2007). The use of fish meta-assemblages provides a more comprehensive coverage of the occurrence and distribution of estuary-associated fish species for regions where studies and data on estuaries and their fish communities are scarce. This global study also provides a classification and preliminary delineation of estuarine biogeographic regions based on estuary-associated fish species. Historical and contemporary environmental factors that contribute to the establishment and maintenance of these regions were also examined and discussed.
Materials and methods
A global meta-assemblage of estuary-associated fishes was established using a fish estuary-association score (FEAS) database (DAERA, 2020). The FEAS comprises a dataset of some 6200 fish species, which have been allocated a numerical score that reflects the degree or level of estuarine association for each species (Harrison & Whitfield, Reference Harrison and Whitfield2021). The FEAS ranges between 1.0 and 5.0 where fish species with a score close to 1.0 are regarded as freshwater species with little association or dependence on estuarine environments (freshwater straggler species) while those species with a score close to 5.0 are marine species that are typically not associated or dependent on estuaries (marine straggler species). Fish species with a FEAS close to 3.0 are highly dependent on estuaries for all or part of their life cycle. The global meta-assemblage of estuary-associated fish species was determined by selecting those fish species within the FEAS database that had scores of between 2.4 and 4.6.
Coastal areas of the world were divided into ecoregions identified by Spalding et al. (Reference Spalding, Fox, Allen, Davidson, Ferdana, Finlayson, Halpern, Jorge, Lourie, Martin, McManus, Molnar, Recchia and Robertson2007). The distribution and occurrence of each species within each ecoregion was established through records provided in the Global Biodiversity Information Facility (GBIF, 2021). This resulted in a dataset comprising a meta-assemblage of estuary-associated fish species within each coastal ecoregion. The data set was subject to multivariate analyses using the Plymouth Routines in Multivariate Ecological Research package (PRIMER v6) (Clarke & Gorley, Reference Clarke and Gorley2006). Prior to analysis the dataset was adjusted by removing those ecoregions with no coast, those comprising oceanic islands, as well as high Arctic and Antarctic (>70° latitude N/S) ecoregions. A similarity matrix based on the Bray–Curtis similarity measure was created for the estuary-associated fish species assemblages in the remaining ecoregions. This similarity matrix was subject to cluster analysis based on group average similarities. In addition, a SIMPROF test was applied to the data to identify significantly distinctive groupings. The data were also subject to non-metric multi-dimensional scaling ordination (nMDS). Groupings of ecoregions identified through this analysis were subject to further cluster analysis and nMDS ordination separately.
The total number of species reported in each ecoregion was also calculated; species richness values were divided into 11 classes ranging between <50 species to >500 species with an increment of 50 species. Each ecoregion was then assigned to a species richness class based on the number of species recorded. Mean fish species richness of ecoregion groupings identified through cluster analysis was also calculated.
Results
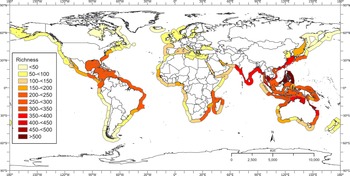
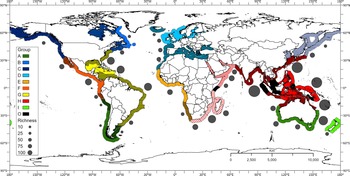
Of the 232 ecoregions identified by Spalding et al. (Reference Spalding, Fox, Allen, Davidson, Ferdana, Finlayson, Halpern, Jorge, Lourie, Martin, McManus, Molnar, Recchia and Robertson2007), 137 were included in this study (Figure S1). A total of 2710 estuary-associated species were identified. Species richness values in each ecoregion ranged from fewer than 10 species reported from the South American Central Chile and Chiloense ecoregions (ecoregions 177 and 188) to over 500 species reported in the Central Indo-Pacific Palawan/North Borneo and Eastern Philippines ecoregions (ecoregions 126 and 127). Ecoregions within the Indo-West Pacific, from India to southern Japan, the East China Sea, the South China Sea, Indonesia, New Guinea, and the northern coast of Australia had the highest species richness values (Figure 1). Relatively high richness values were also recorded from ecoregions on the east and southern coast of Africa as well as the Gulf of Mexico, the Caribbean Sea and the northern and north-east coast of Brazil, and the east Pacific coast between Mexico and Ecuador.
Estuary-associated fish species richness of meta-assemblages recorded in marine ecoregions.

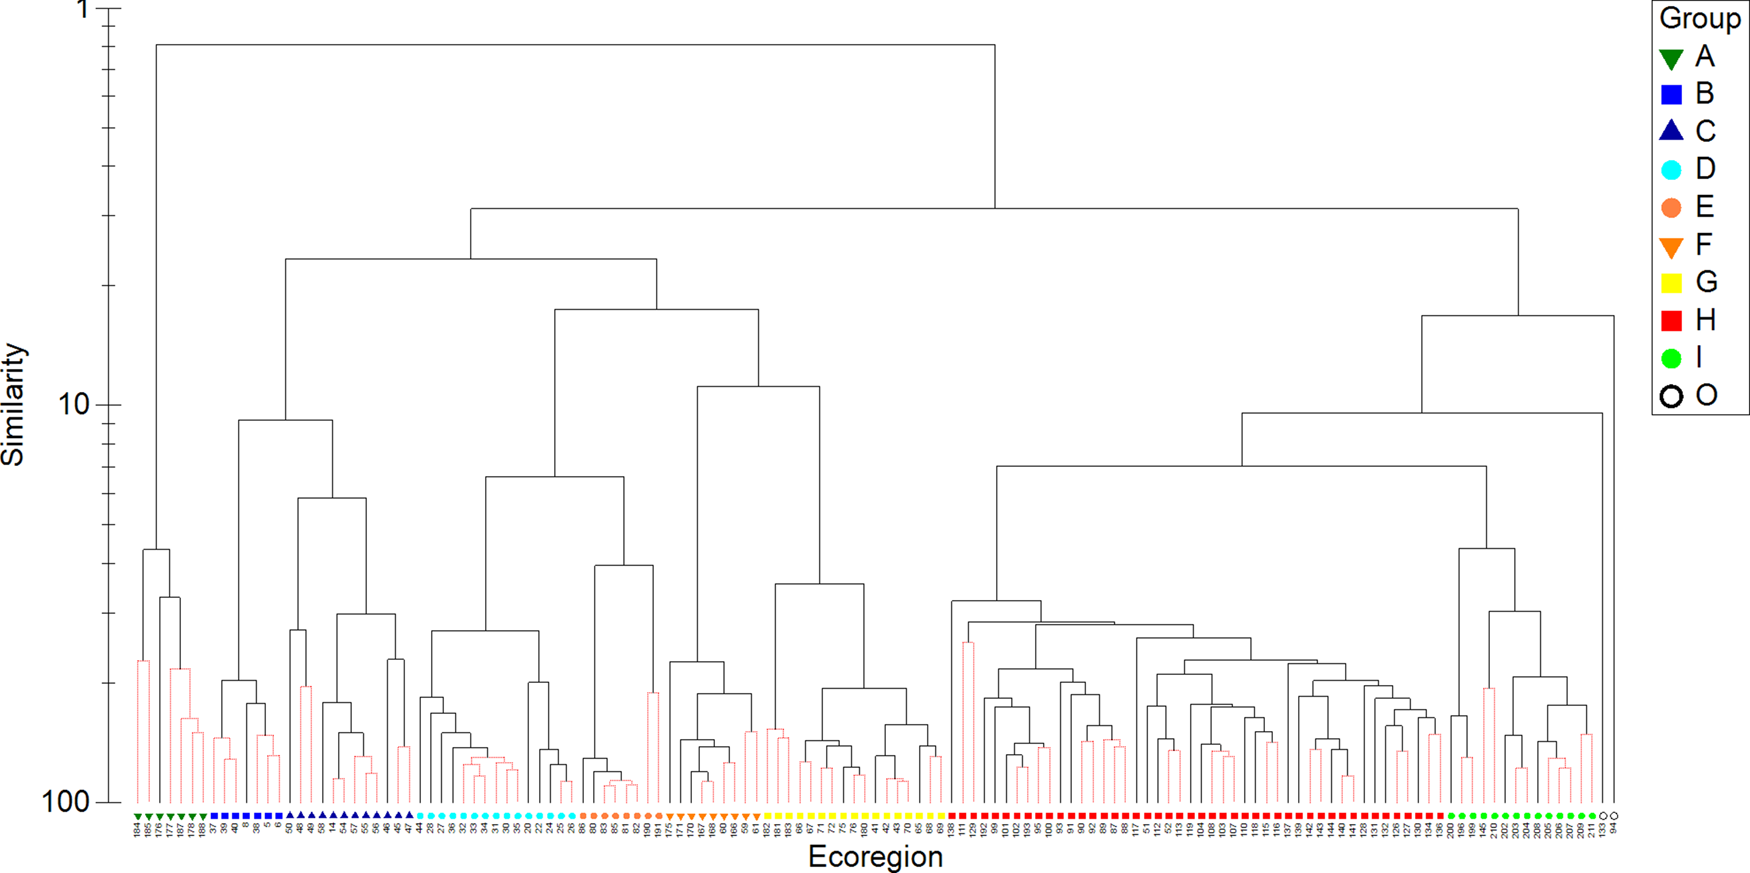
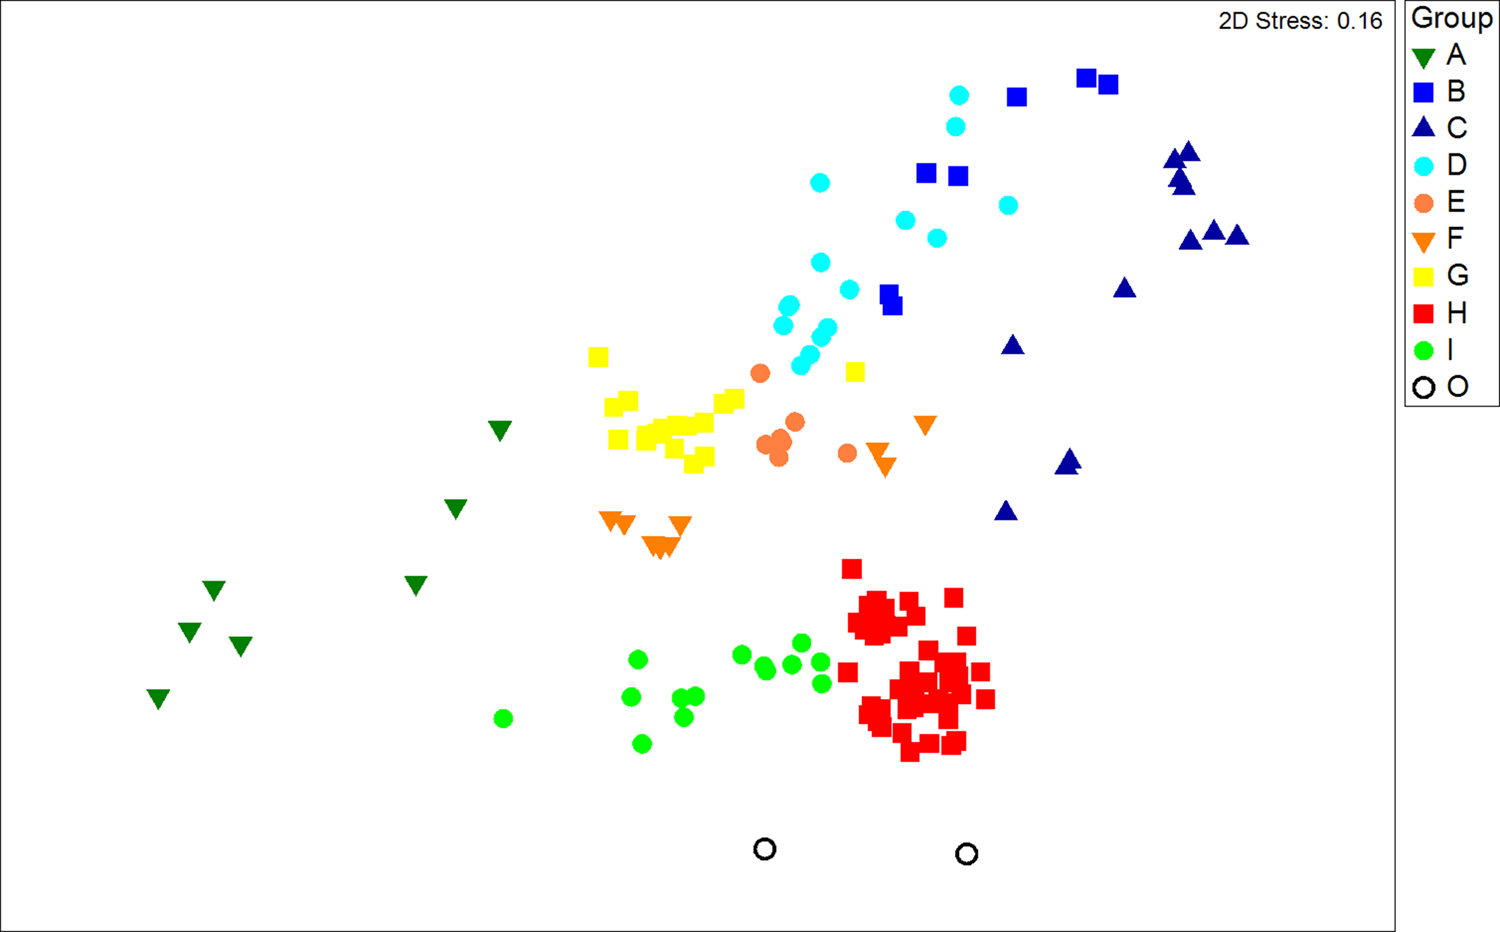
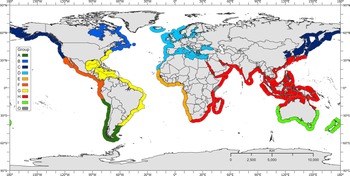
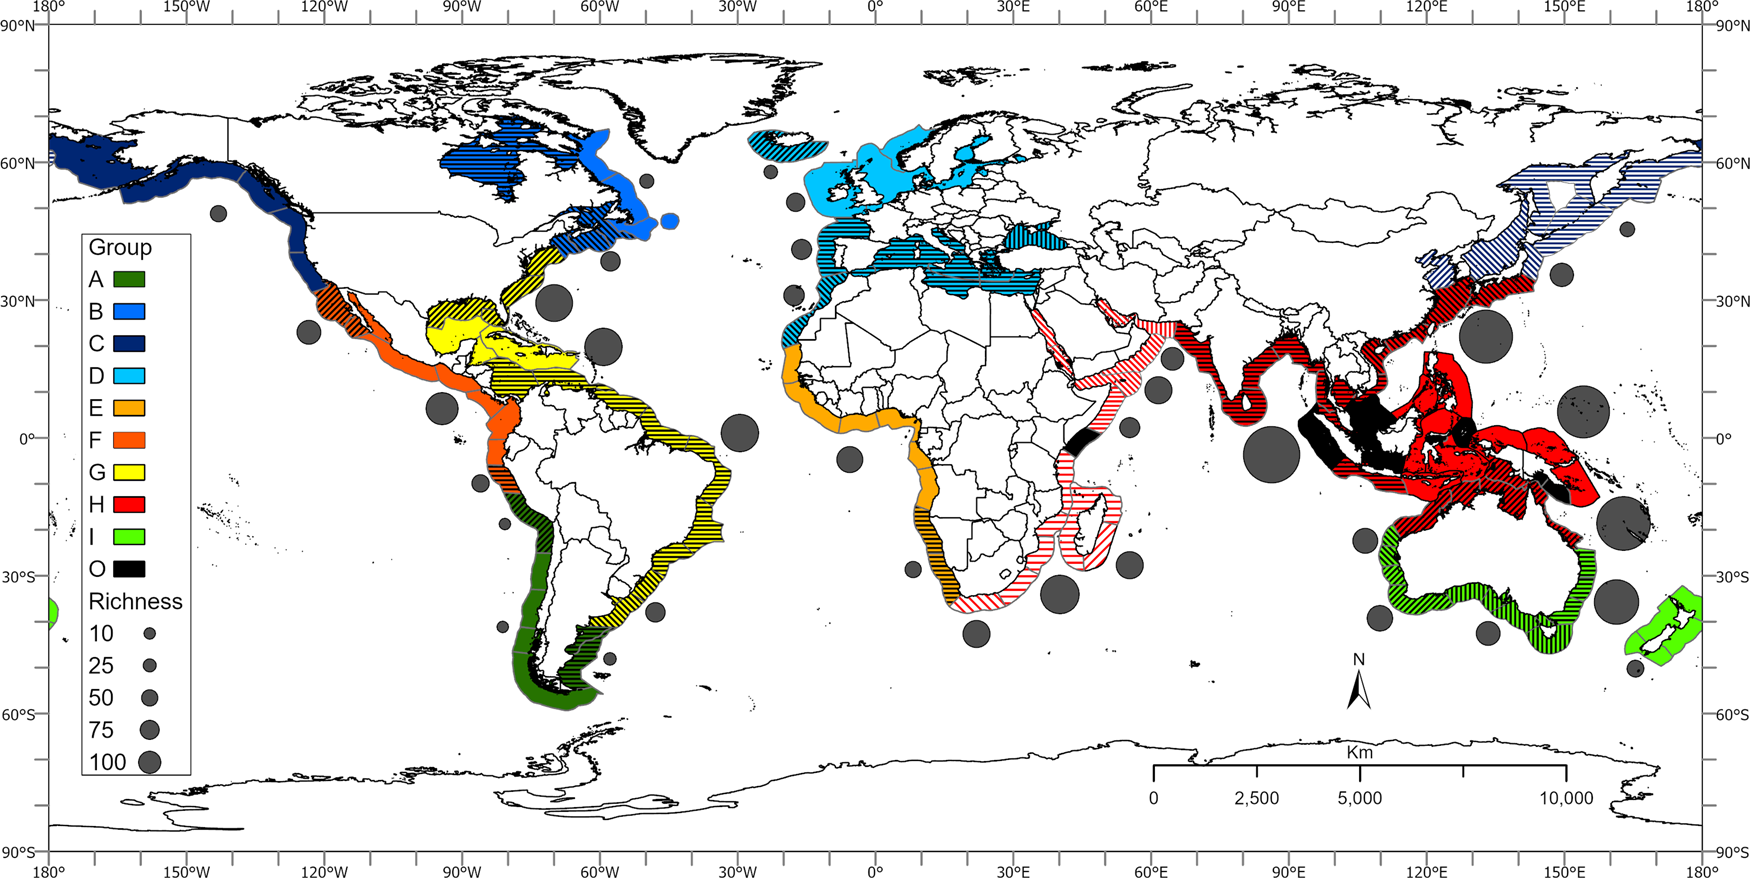
The cluster analysis identified nine broad ecoregion groupings at a similarity level of ~20% (Figure 2). The results of the nMDS also suggested that the groupings identified in the cluster analysis were somewhat distinct (Figure 3). Group A comprised ecoregions in South America including southern Argentina and Chile (Figure 4); Group B ecoregions comprised those within the North-west Atlantic. Ecoregions within Group C were mostly in the northern Pacific region and included the Yellow Sea, Sea of Japan, Sea of Okhotsk, the Bering Sea, and the Gulf of Alaska. Group D comprised ecoregions in the North-east Atlantic and included southern Iceland, the northern European seas, the Black Sea, the Mediterranean Sea, and the Atlantic coast of Morocco. Ecoregions in Group E comprised those in the east Atlantic and included the West African and southern African coasts. Group F were represented by ecoregions in the East Pacific from California (USA) south to central Peru; Group G comprised ecoregions in the western Atlantic and extended from Virginia (USA) to the Gulf of Mexico, the Caribbean Sea and south to Argentina. Group H comprised a large number of ecoregions within the Indo-Pacific. Ecoregions in Group I were primarily from Australasia and included New Zealand, south-east Australia, southern Australia and western Australia (Figure 4). Two outliers (Group O) were identified within the broad cluster of Groups H and I; these were the Northern Monsoon Current Coast ecoregion (Ecoregion 94) situated on the Somali coast in the Western Indian Ocean and the North-east Sulawesi ecoregion (Ecoregion 133) in Indonesia, Central Indo-Pacific.
Results of cluster analysis of Bray–Curtis similarities between estuary-associated fish species meta-assemblages recorded in 137 marine ecoregions worldwide (ecoregion numbers follow Spalding et al., Reference Spalding, Fox, Allen, Davidson, Ferdana, Finlayson, Halpern, Jorge, Lourie, Martin, McManus, Molnar, Recchia and Robertson2007); the results of the SIMPROF test are also indicated where dashed lines indicate no significant difference between ecoregions or groupings.

Non-metric multi-dimensional scaling ordination (nMDS) analysis of estuary-associated fish species meta-assemblage similarities in marine ecoregions.

Geographic distribution of ecoregion groupings obtained through cluster analysis of estuary-associated fish species meta-assemblages.

Cluster analysis of Group A ecoregions identified three sub-groups at a similarity of over 40% (Figure S2a). One sub-group comprised ecoregions in the South-west Atlantic while the remaining sub-groups comprised ecoregions in the South-east Pacific (Figure S2b). The cluster analysis also showed that, of the South-east Pacific ecoregions, the Humboldtian ecoregion (Ecoregion 176) situated in northern Chile/southern Peru was distinct. The remaining ecoregions along the coast of Chile formed a separate cluster. The results of the nMDS of Group A ecoregions also showed that the three sub-groups identified in the cluster analysis were distinct with South-west Atlantic ecoregions situated to the right of the ordination. Ecoregions in the South-east Pacific were situated toward the bottom left of the plot; the Humboldtian ecoregion was located toward the top left of the ordination (Figure S2c). Fish species richness in the Humboldtian ecoregion measured 12 species; mean fish species richness decreased to 10 in ecoregions along the coast of Chile and increased to 20 in South-west Atlantic ecoregions (Figure S2d).
Ecoregions belonging to Group B could be divided into two sub-groups at a similarity of 50% (Figure S3a). One sub-group comprised ecoregions situated in the North-west Atlantic from the Gulf of St Lawrence to the Bay of Fundy/Maine (USA). The remaining ecoregions were situated further north and included Hudson Bay and the Labrador and Newfoundland coast (Figure S3b). At a similarity of over 60%, the Hudson Complex (Ecoregion 8) was separate from the ecoregions on the Labrador/Newfoundland coast. The nMDS ordination also showed that the two broad sub-groupings were somewhat distinctive (Figure S3c). Ecoregions from the Gulf of St Lawrence to the Bay of Fundy/Maine were situated toward the bottom left of the ordination while ecoregions on the Labrador/Newfoundland coast formed a group in the centre right of the plot; the Hudson Complex was situated toward the top of the ordination. Fish species richness in the Hudson Complex ecoregion measured 29; the mean fish species richness of ecoregions on the Labrador/Newfoundland coast was 32 (Figure S3d). This increased to 76 in ecoregions from the Gulf of St Lawrence to the Bay of Fundy/Maine.
Cluster analysis of Group C ecoregions resulted in two broad sub-groups at over 20% similarity (Figure S4a). One sub-group comprised ecoregions in the Sea of Japan, the north-east (Honshu) coast of Japan and the Yellow Sea (Figure S4b). Within this sub-group the Yellow Sea (Ecoregion 50) was distinct. The second broad sub-group comprised ecoregions from northern Japan, the Sea of Okhotsk, the Bering Sea, the Gulf of Alaska and northern California (USA). This second grouping could be further sub-divided (at a similarity of 40%) into ecoregions in the North-west Pacific (including northern Japan, the Sea of Okhotsk, and the Kamchatka coast of the west Bering Sea) and those in the North-east Pacific (the east Bering Sea, the Gulf of Alaska and north-west coast of North America) (Figure S4b). The nMDS ordination showed ecoregions in the North-east Pacific (the east Bering Sea, the Gulf of Alaska and north-west coast of North America) formed a grouping toward the right of the ordination (Figure S4c). Ecoregions in the North-west Pacific (northern Japan, the Sea of Okhotsk and the Kamchatka coast of the west Bering Sea) were situated toward the centre of the ordination. Ecoregions in the Sea of Japan and the north-east (Honshu) coast of Japan were situated toward the bottom left of the plot; the Yellow Sea ecoregion was situated toward the left of the ordination. A mean fish species richness of 52 was recorded from ecoregions in the North-east Pacific; this declined to 37 species in ecoregions in the North-west Pacific (Figure S4d). Ecoregions in the Sea of Japan and the north-east (Honshu) coast of Japan had the highest mean species richness (110 taxa); a total of 77 species were recorded in the Yellow Sea ecoregion.
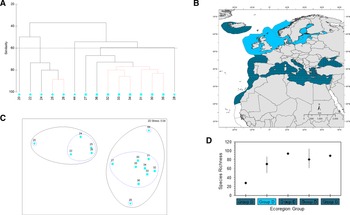
Ecoregions in Group D could be divided into two sub-groups at a similarity of over 40% (Figure 5A). One sub-group comprised ecoregions in the North-east Atlantic while the second broad sub-group included ecoregions to the south, and included the Atlantic coast of France, Spain and Portugal, the Mediterranean Sea, the Black Sea and the Atlantic coast of Morocco (Figure 5B). At a similarity of 60%, southern Iceland (Ecoregion 20) was distinct within the North-east Atlantic grouping and the Black Sea (Ecoregion 44), and the Saharan Upwelling (ecoregion 28) appeared distinct within the southern group of ecoregions. The nMDS ordination also showed this geographic separation, with ecoregions in the North-east Atlantic situated toward the top left of the plot with more southern ecoregions situated toward the right of the ordination (Figure 5C). Distinctive ecoregions within these groups were also apparent. Within the North-east Atlantic grouping, southern Iceland was situated toward the far right of the ordination; within the southern grouping, the Black Sea was located toward the top right of the plot and the Saharan Upwelling ecoregion was situated toward the bottom of this grouping (Figure 5C). Fish species richness recorded in southern Iceland measured 20 taxa, this increased to a mean richness of 71 species in North-east Atlantic ecoregions (Figure S5d). A total of 94 species were recorded in the Black Sea ecoregion. Mean fish species richness in southern ecoregions, including the Mediterranean measured 81 species while 89 species were recorded in the Saharan Upwelling ecoregion (Figure 5D).
Analysis of estuary-associated fish species meta-assemblages recorded in Group D ecoregions: (A) cluster analysis of fish species similarities, the horizontal line represents a similarity level of 60%; the results of the SIMPROF test are also indicated where red lines indicate no significant difference between ecoregions or groupings (ecoregion numbers follow Spalding et al., Reference Spalding, Fox, Allen, Davidson, Ferdana, Finlayson, Halpern, Jorge, Lourie, Martin, McManus, Molnar, Recchia and Robertson2007); (B) geographic distribution of ecoregion sub-groups obtained through cluster analysis; (C) MDS ordination of fish species similarities, groupings identified in the cluster analysis at a similarity of 40% (solid line) and 60% (dashed line) are also indicated; (D) mean fish species richness of each ecoregion grouping (vertical lines represent minimum and maximum values).

Group E ecoregions could be sub-divided into two groups at a similarity of 40% (Figure S6a). One group comprised ecoregions on the western and central African Atlantic coast; the remaining group comprised ecoregions on the southern African Atlantic coast (Figure S6b). The nMDS ordination also showed these groupings with ecoregions along the West African coast situated toward the left of the ordination and those along the southern African coast situated toward the right of the plot (Figure S6c). Mean fish species richness recorded in western and central African Atlantic ecoregions measured 134 species; this declined to 51 species in southern African Atlantic ecoregions (Figure S6d).
The cluster analysis of ecoregions in Group F indicated that the central Peru ecoregion (Ecoregion 175) was distinct within the group (Figure S7a). The remaining ecoregions formed two sub-groups at over 60% similarity. One group comprised ecoregions situated in the eastern Pacific between Mexico and Peru; the remaining ecoregions were located along the Pacific coast of Baja California, Mexico and southern California, USA (Figure S7b). The nMDS ordination showed that ecoregions in the North-east Pacific were situated toward the top of the plot with those in the eastern Pacific placed toward the left centre of the ordination; the central Peru ecoregion was located toward the bottom left of the plot (Figure S7c). A mean fish species richness of 112 taxa was recorded in Group F ecoregions in the North-east Pacific; this increased to a mean richness of 183 species in eastern Pacific ecoregions (Figure S7d). A total of 61 fish species was recorded from the central Peru ecoregion.
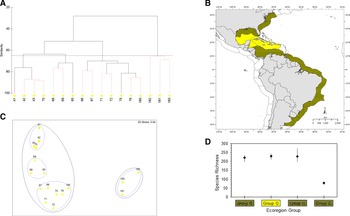
The cluster analysis of ecoregions in Group G showed two broad groupings at a similarity of 40% (Figure 6A). The first group comprised ecoregions situated in the South-western Atlantic region from southern Brazil to northern Argentina. The second group comprised ecoregions on the US Atlantic coast from Carolina to Florida and the Gulf of Mexico, the Caribbean Sea, and the coast of Brazil (Figure 6B). This second grouping could be further sub-divided at a similarity of 65%. One grouping comprised ecoregions along the North-west Atlantic coast and the northern Gulf of Mexico; a second sub-group comprised ecoregions in the southern Gulf of Mexico and the northern Caribbean Sea including the Greater Antilles. The third grouping comprised ecoregions from the Caribbean Sea to southern Brazil (Figure S8b). The results of the nMDS analysis showed ecoregions in the south-western Atlantic situated toward the bottom right of the plot; the remaining ecoregions were situated toward the left of the ordination (Figure 6C). This latter group were further sub-divided (at 65% similarity) into northern ecoregions along the Atlantic coast and northern Gulf of Mexico situated toward the top left of the plot; ecoregions in the southern Gulf of Mexico and the northern Caribbean Sea were situated below this grouping. Ecoregions in the Caribbean Sea and along the Brazil coast positioned toward the bottom of the group (Figure 6C). The mean species richness of ecoregion groupings from Carolina (USA) to the Gulf of Mexico, the Caribbean Sea and Santa Catarina (Brazil) was relatively consistent and ranged between 221 and 229 species; this declined to 80 species in ecoregions further south from Santa Catarina (Brazil) to Uruguay and northern Argentina (Figure 6D).
Analysis of estuary-associated fish species meta-assemblages recorded in Group G ecoregions: (A) cluster analysis of fish species similarities, the horizontal line represents a similarity level of 65%; the results of the SIMPROF test are also indicated where red lines indicate no significant difference between ecoregions or groupings (ecoregion numbers follow Spalding et al., Reference Spalding, Fox, Allen, Davidson, Ferdana, Finlayson, Halpern, Jorge, Lourie, Martin, McManus, Molnar, Recchia and Robertson2007); (B) geographic distribution of ecoregion sub-groups obtained through cluster analysis; (C) MDS ordination of fish species similarities, groupings identified in the cluster analysis at a similarity of 40% (solid line) and 65% (dashed line) are also indicated; (D) mean fish species richness of each ecoregion grouping (vertical lines represent minimum and maximum values).

The results of the cluster analysis of Group H ecoregions indicated several distinct ecoregions at a similarity of 40% (Figure S9a). These included the Gulf of Papua (Ecoregion 138), western Sumatra (Ecoregion 111), Halmahera (Ecoregion 129) and Sunda Shelf/Java Sea (Ecoregion 117). The remaining ecoregions formed two broad groups; the first group comprised ecoregions in the Western Indian Ocean while the remaining group comprised ecoregions in the Indo-West Pacific (Figure S9a). The results of the nMDS also showed Western Indian Ocean ecoregions situated toward the left of the plot and the remaining Indo-West Pacific ecosystems toward the right of the ordination (Figure S9c). Fish species richness recorded in Western Indian Ocean ecoregions averaged 167 species; mean fish species richness of ecoregions in the Indo-West Pacific grouping was 358 taxa (Figure S9d).
Cluster analysis also showed that Group H ecoregions within the Western Indian Ocean grouping could be further sub-divided into two groups at a similarity of ~50% (Figure S10a). One group comprised ecoregions within the southern sector of the Western Indian Ocean extending from Kenya to South Africa, including Madagascar (Figure S10b). At a similarity of 60%, the Agulhas Bank (Ecoregion 192) and south-east Madagascar (Ecoregion 99) were distinct within this sub-group. The remaining Western Indian Ocean ecoregions were located in the northern sector and included the Somali coast, the Gulf of Aden, the Red Sea, the western Arabian Sea, the Gulf of Oman and the Persian Gulf (Figure S10b). The central Somali Coast (Ecoregion 93) and Gulf of Oman (Ecoregion 91) were distinct within this group at a similarity of 60% (Figure S10a). The groupings of Western Indian Ocean ecoregions were also reflected in the nMDS ordination where ecoregions in the northern (Somalia to Pakistan) sector were situated near the top right of the ordination and the ecoregions in the southern sector (Kenya to South Africa) were located toward the bottom left of the plot (Figure S10c). Distinctive ecoregions within each sector were also apparent. A total of 103 fish species were recorded in the Gulf of Oman ecoregion (Figure S10d). The grouping of ecoregions that included the Gulf of Aden, the Red Sea, the western Arabian Sea, and the Persian Gulf had a mean fish species richness of 141 species. A total of 84 fish species were recorded from the Somali Coast ecoregion. In the south-east Madagascar ecoregion, 140 estuary-associated fish species were recorded. Ecoregions from Kenya to the east coast of South Africa had a mean species richness of 234; this declined to 142 species recorded in the Agulhas Bank ecoregion (Figure S10d).
Cluster analysis of Group H ecoregions in the Indo-West Pacific indicated four groupings at a similarity of 50% (Figure S11a). South-east Papua New Guinea (Ecoregion 137) appeared to be distinctive within these ecoregions. Of the four sub-groups identified, one grouping comprised ecoregions in southern Japan and the East China Sea (Figure S11b). A second group comprised ecoregions ranging from the east Arabian Sea (west India coast), the Bay of Bengal, the Andaman Sea, to southern Java; this group also included ecoregions extending west and northward including the Malacca Strait, the Gulf of Thailand and the South China Sea. A third group comprised ecoregions extending from the Philippines south to Indonesia and New Guinea; the fourth grouping comprised ecoregions along the northern Australian coast and southern New Guinea (Figure S11b). The nMDS analysis showed that the groupings identified in the cluster analysis were also apparent (Figure S11c). Ecoregions in southern Japan and the East China Sea were situated toward the upper left of the ordination; ecoregions extending from the east Arabian Sea to southern Java and the South China Sea were grouped toward the bottom left sector of the plot. Ecoregions that extended from the Philippines south to Indonesia and New Guinea were situated toward the centre of the plot while those along the northern Australian coast and southern New Guinea were located below this grouping (Figure S11c). Mean fish species richness of ecoregion groupings within the Indo-West Pacific ranged between 350 and 386 species (Figure S11d) and was the highest of any of the examined ecoregions.
Cluster analysis of Group I ecoregions indicated three sub-groups at a similarity of 40% (Figure S12a). One group comprised ecoregions in New Zealand; a second group comprised ecoregions in north-west Australia, and the third group comprised ecoregions on the south-east, south and south-west Australian coast (Figure S12b). This last grouping could be further sub-divided (at 60% similarity) into ecoregions on the southwest, south and south-east Australian coast. These groupings were also evident in the nMDS ordination where ecoregions in north-west Australia were located toward the top left of the plot; ecoregions on the south-east, south and south-west Australian coast were situated toward the bottom left of the ordination (Figure S12c). Ecoregions in New Zealand formed a grouping toward the bottom right of the plot. Ecoregions that included Southern Queensland, New South Wales and eastern Victoria (Australia) had a mean fish species richness of 286 species (Figure S12d). The mean fish species richness of ecoregion groupings from Western Australia, South Australia and Victoria ranged between 116 and 128 taxa. New Zealand ecoregions had a mean fish species richness of 55 species (Figure S12d).
Discussion
Multivariate analyses of meta-assemblages of estuarine-associated fishes in global ecoregions indicated broad geographic groupings that corresponded with global climatic/geographic zones (Figure 2). These groupings included the temperate regions of the northern Pacific, North-west Atlantic, North-east Atlantic, South America (South-east Pacific and South-west Atlantic) and temperate Australasia. The broad-scale groupings also included the warmer regions of the eastern Pacific, western Atlantic, eastern Atlantic and the Indo-Pacific.
Spalding et al. (Reference Spalding, Fox, Allen, Davidson, Ferdana, Finlayson, Halpern, Jorge, Lourie, Martin, McManus, Molnar, Recchia and Robertson2007) developed a hierarchical biogeographic framework for describing marine ecoregions of the world where coastal regions were divided into realms, provinces and ecoregions. This system was based on a range of biological elements as well as expert input. The broad-scale groupings identified in this study largely corresponded with the realms identified by Spalding et al. (Reference Spalding, Fox, Allen, Davidson, Ferdana, Finlayson, Halpern, Jorge, Lourie, Martin, McManus, Molnar, Recchia and Robertson2007). These included the Arctic, the Southern Ocean, Temperate Northern Pacific, Temperate Northern Atlantic, Temperate South America, Temperate Southern Africa, Temperate Australasia, Tropical Eastern Pacific, Tropical Atlantic, Western Indo-Pacific, Central Indo-Pacific and Eastern Indo-Pacific. These broad groupings could be further sub-divided into regions that generally corresponded with marine zoogeographic regions (Figure 7).
Geographic distribution of estuary-associated fish species based on multivariate analyses of fish meta-assemblages in marine ecoregions (hatched/shaded areas represent ecoregion sub-groupings); mean fish species richness of ecoregion groupings is indicated adjacent to each biogeographic grouping.
Eastern Pacific
Cold-temperate ecoregions in the North-east Pacific identified by Spalding et al. (Reference Spalding, Fox, Allen, Davidson, Ferdana, Finlayson, Halpern, Jorge, Lourie, Martin, McManus, Molnar, Recchia and Robertson2007) extended from the Aleutian Islands to the Gulf of Alaska and southward to approximately Point Conception, California (USA). Although Spalding et al. (Reference Spalding, Fox, Allen, Davidson, Ferdana, Finlayson, Halpern, Jorge, Lourie, Martin, McManus, Molnar, Recchia and Robertson2007) included the Bering Sea as part of the Arctic Province, a review of temperate and cold waters of the northern hemisphere identified the Bering Strait as the Arctic/Boreal boundary (Golikov et al., Reference Golikov, Dolgolenko, Maximovitch and Scarlato1990). Furthermore, in a realignment of biogeographic provinces based on fish distributions, Briggs and Bowen (Reference Briggs and Bowen2012) recognized a cold-temperate region in the eastern North Pacific extending from the Bering Sea to approximately Los Angeles, California. The northern boundary of this cool-temperate region represented the southern limit of winter pack ice (Toonen et al., Reference Toonen, Bowen, Iacchei, Briggs and Kliman2016). These findings correspond with the grouping of ecoregions that included the Bering Sea and the Gulf of Alaska south to approximately Point Conception identified during this study (Figure 4). The grouping of ecoregions during this study also agreed with the major freshwater ecoregions of the world (FEOW) based primarily on fish distributions (Abell et al., Reference Abell, Thieme, Revenga, Bryer, Kottelat, Bogutskaya, Coad, Mandrak, Balderas, Bussing, Stiassny, Skelton, Allen, Unmack, Naseka, Ng, Sindorf, Robertson, Armijo, Higgins, Heibel, Wikramanayake, Olson, Lopez, Reis, Lundberg, Sabaj Perez and Petry2008). Freshwater ecoregions bordering the Bering Sea including the Aleutian Islands were classified as polar fresh waters while ecoregions from the Gulf of Alaska south to Monterey, California were classified as temperate coastal rivers (FEOW, 2021; Figure S13).
Marine ecoregions from Point Conception to the southern tip of the Baja California Peninsula, Mexico were classified as within the warm-temperate North-east Pacific province by Spalding et al. (Reference Spalding, Fox, Allen, Davidson, Ferdana, Finlayson, Halpern, Jorge, Lourie, Martin, McManus, Molnar, Recchia and Robertson2007); this included the west coast of Baja California as well as the Gulf of California. Similarly, Briggs & Bowen (Reference Briggs and Bowen2012) and Toonen et al. (Reference Toonen, Bowen, Iacchei, Briggs and Kliman2016) recognized a warm-temperate region extending from Los Angeles to, and including, the Gulf of California. This study also showed that marine ecoregions from Point Conception to the southern tip of the Baja California Peninsula formed a grouping that corresponded with this warm-temperate North-east Pacific region (Figure 4). Freshwater ecoregions exhibited a change from temperate coastal rivers to the north of Monterey to xeric fresh waters in arid, semi-arid or dry sub-humid environments in the coastal area south of Monterey to the southern tip of the Baja California Peninsula and most of the Gulf of California (FEOW, 2021; Figure S13).
Although Toonen et al. (Reference Toonen, Bowen, Iacchei, Briggs and Kliman2016) identified the Gulf of California as a separate warm-temperate province within the North-east Pacific, based on an analysis of shore fishes (Robertson & Cramer, Reference Robertson and Cramer2009) and reef fishes (Kulbicki et al., Reference Kulbicki, Parravicini, Bellwood, Arias-Gonzalez, Chabanet, Floeter, Friedlander, McPherson, Myers, Vigliola and Mouillot2013), the Gulf of California was included within the Tropical Eastern Pacific (TEP). The results of this study also found that the Gulf of California ecoregion was grouped with ecoregions further south (Figure 7; Figure S7). Spalding et al. (Reference Spalding, Fox, Allen, Davidson, Ferdana, Finlayson, Halpern, Jorge, Lourie, Martin, McManus, Molnar, Recchia and Robertson2007) identified a Tropical Eastern Pacific Province from the mouth of the Gulf of California to northern Peru. Briggs & Bowen (Reference Briggs and Bowen2012) also recognized a tropical Panamanian province extending from the mouth of the Gulf of California south to the Gulf of Guayaquil on the border between Ecuador and Peru. Robertson & Cramer (Reference Robertson and Cramer2009) also identified a Tropical Eastern Pacific region from Magdalena Bay on the western coast of Baja California to the Gulf of Guayaquil. In a systematic review of fish ecology and anthropogenic impacts in South American estuaries, Barletta & Lima (Reference Barletta and Lima2019) placed the southern limit of the TEP in northern Peru. This study also found that ecoregions within the TEP from the Gulf of California south to approximately the Gulf of Guayaquil formed a distinct grouping (Figure 7; Figure S7). This corresponds with the classification of freshwater ecoregions where those from the east coast of the Gulf of California to the Sechura District, northern Peru were classified as tropical and subtropical coastal rivers (FEOW, 2021; Figure S13).
The Central Peru ecoregion (Ecoregion 175) between the Gulf of Guayaquil and Lima, Peru was identified as distinct within the broad grouping of tropical ecoregions in this study (Figure 7; Figure S7). This suggests a transition zone between the northern tropical ecoregions and those ecoregions further south. In addition, the Humboldtian ecoregion (Ecoregion 176) between Lima and ~25°S northern Chile was also identified as distinct within the southern grouping of ecoregions (Figure 7; Figure S2). Based on littoral fishes, Ojeda et al. (Reference Ojeda, Labra and Munoz2000) found that the northern coast of Chile to ~40°S was characterized by a warm-temperate fish fauna of tropical origin. Camus (Reference Camus2001) reviewed 27 biogeographic classifications for the south-eastern Pacific coast and identified a northern warm-temperate (Peruvian Province) area extending from ~18–30°S; the region between 30° and 42°S was identified as an Intermediate Area comprising a mixed biota with a poor biogeographic definition. Spalding et al. (Reference Spalding, Fox, Allen, Davidson, Ferdana, Finlayson, Halpern, Jorge, Lourie, Martin, McManus, Molnar, Recchia and Robertson2007) recognized a warm-temperate south-eastern Pacific province extending from the Gulf of Guayaquil to approximately Chiloé Island, southern Chile. Briggs & Bowen (Reference Briggs and Bowen2012) also defined a warm-temperate Peru–Chilean Province extending from the Gulf of Guayaquil to about the Taito Peninsula, Chile. Barletta & Lima (Reference Barletta and Lima2019) identified a warm-temperate south-eastern Pacific region extending from ~10°S to about 40°S. While the two distinctive ecoregions identified during this study fell within this marine warm-temperate region, they appeared to be more closely aligned with the change in freshwater ecoregions from tropical and subtropical coastal rivers north of the Sechura District, Peru to xeric fresh waters in arid, semi-arid or dry sub-humid environments between the Sechura District and about 25°S, Chile (FEOW, 2021; Figure S13). The Central Peru and Humboldtian ecoregions were situated adjacent to the Sechura and Atacama deserts, respectively.
Ojeda et al. (Reference Ojeda, Labra and Munoz2000) identified the southern region of Chile (40°S southwards) as comprising cold-temperate fishes of subantarctic origin. Camus (Reference Camus2001) also identified a southern (Magellan Province) area from ~42°S to 56°S with an Austral biota. Spalding et al. (Reference Spalding, Fox, Allen, Davidson, Ferdana, Finlayson, Halpern, Jorge, Lourie, Martin, McManus, Molnar, Recchia and Robertson2007) identified a cold-temperate Magellanic South American province extending from Chiloé Island on the Pacific coast to the Gulf of San Matias, Argentina on the Atlantic coast. Briggs & Bowen (Reference Briggs and Bowen2012) identified several cold-temperate provinces within the South American region. A Southern Chile province extended from the Taitao Peninsula south to Punta Arenas near the southern tip of Chile; Tierra del Fuego and the Falkland Islands were recognized as separate cold-temperate provinces. According to Barletta & Lima (Reference Barletta and Lima2019) a temperate eastern Pacific region extended from ~40°S to the southern tip of Chile. This study identified a single grouping of ecoregions between 25°S to Tierra del Fuego, Argentina (Figure S2). This grouping broadly corresponded with the cold-temperate marine provinces identified by other workers, although it also included more northern ecoregions. The grouping of ecoregions identified during this study was also strongly aligned with freshwater ecoregions in the region, which were characterized by temperate coastal rivers (FEOW, 2021; Figure S13).
The Humboldt Current is a major Eastern Boundary Upwelling System that extends along the west coast of South America from northern Peru to the southern tip of Chile (Garcia-Reyes et al., Reference Garcia-Reyes, Sydeman, Schoeman, Rykaczewski, Black, Smit and Bograd2015). The Humboldt Current is one of the major upwelling systems of the world and is characterized by cold, nutrient-rich waters that flow toward the equator (Miloslavich et al., Reference Miloslavich, Klein, Diaz, Hernandez, Bigatti, Campos, Artigas, Castillo, Penchaszadeh, Neill, Carranza, Retana, Diaz de Astarloa, Lewis, Yorio, Piriz, Rodriguez, Yoneshigue-Valentin, Gamboa and Martin2011). This probably serves as a barrier to the southern distribution of warm-water species from the tropics. This probably accounts for the relatively low species richness recorded from ecoregions in this area. In addition, the arid conditions of the Sechura and Atacama deserts probably further serve to restrict suitable habitat for estuarine-associated fish species. The coastal area in these regions is characterized by saline and brackish lagoon systems with only a few perennial rivers (FEOW, 2021).
In contrast, the TEP experiences high rainfall and runoff; the coasts of Panama, Colombia, and northern Ecuador have the largest concentration of estuarine systems with high freshwater outflows within the South American Pacific (Miloslavich et al., Reference Miloslavich, Klein, Diaz, Hernandez, Bigatti, Campos, Artigas, Castillo, Penchaszadeh, Neill, Carranza, Retana, Diaz de Astarloa, Lewis, Yorio, Piriz, Rodriguez, Yoneshigue-Valentin, Gamboa and Martin2011). Ecoregions within the TEP had a high species richness of estuarine-associated fishes during this study. Coastal waters further north are influenced by the California Current Eastern Boundary Upwelling System that spans from Central Baja California to central British Columbia, Canada (Garcia-Reyes et al., Reference Garcia-Reyes, Sydeman, Schoeman, Rykaczewski, Black, Smit and Bograd2015). This possibly also serves as a barrier to the extension of warm-water species northward; this is also reflected in the decline in fish species richness. Ecosystems within the northern warm-temperate region were also situated adjacent to the Sonoran and Baja California deserts; while there are numerous small rivers and coastal basins within the Baja California region, there are almost no permanent watercourses (FEOW, 2021). Allen et al. (Reference Allen, Yoklavich, Cailliet, Horn, Allen, Pondella and Horn2006) also noted that the arid climate of much of the California coast, especially from the central region southward into Baja California resulted in fewer and smaller estuarine habitats. In the bays and estuaries on the Pacific coast of Baja California, where annual rainfall is especially low, evaporation may exceed precipitation, resulting in hypersaline conditions during much of the year.
In northern California, relatively high annual rainfall results in estuaries that are river-dominated (Allen et al., Reference Allen, Yoklavich, Cailliet, Horn, Allen, Pondella and Horn2006). An analysis of fish species in California bays and estuaries also found that systems in southern California were distinct from those in the north (Allen et al., Reference Allen, Yoklavich, Cailliet, Horn, Allen, Pondella and Horn2006). Freshwater ecoregions in the cold-temperate North-east Pacific were found to contain a depauperate fish fauna with some saltwater tolerant and anadromous species (FEOW, 2021). This study also reported a relatively low mean species richness from ecoregions in this area (Figure 7; Figure S4).
Western Atlantic
Three groupings of ecoregions were identified in the North-west Atlantic in this study (Figure 7; Figure S3). These included the Hudson Complex ecoregion (Hudson Bay), ecoregions along the Newfoundland and Labrador coast from the Arctic Circle (66°N) to the Island of Newfoundland, Canada and those ecoregions from the Gulf of St Lawrence south to Cape Cod, MA (USA). Spalding et al. (Reference Spalding, Fox, Allen, Davidson, Ferdana, Finlayson, Halpern, Jorge, Lourie, Martin, McManus, Molnar, Recchia and Robertson2007) classified all those ecoregions north of the Gulf of St. Lawrence as Arctic (Figure S1); this area was also considered cold-Arctic by Briggs & Bowen (Reference Briggs and Bowen2012). Freshwater ecoregions along the western shore of Hudson Bay were classified as polar freshwaters while those on the southern and eastern shore were categorized as temperate coastal rivers (FEOW, 2021; Figure S13). Straneo & Saucier (Reference Straneo and Saucier2008) described the Hudson Bay system as an unusually fresh, large-scale arctic/subarctic estuarine system that receives a substantial freshwater input from much of the north-eastern American continent as well as inflow of waters of Arctic origin. Freshwater ecoregions along the Newfoundland and Labrador coast south to Cape Cod were classified as temperate coastal rivers. Briggs & Bowen (Reference Briggs and Bowen2012) also identified a Western Atlantic Boreal Region from the Labrador Straits, south to Cape Hatteras, NC (USA); these authors highlighted differences in the location of the cold-temperate/warm-temperate boundary between Cape Cod and Cape Hatteras; this is based on the penetration of this area by warm-water species during the summer months. In an analysis of estuarine benthic invertebrates along the western Atlantic coast, Engle & Summers (Reference Engle and Summers2000) found that this boundary occurred further south at Wilmington Beach, NC.
A warm-temperate North-west Atlantic (Carolina Province) region extends south of Cape Hatteras and comprises two areas separated by the Florida Peninsula (Spalding et al., Reference Spalding, Fox, Allen, Davidson, Ferdana, Finlayson, Halpern, Jorge, Lourie, Martin, McManus, Molnar, Recchia and Robertson2007; Briggs & Bowen, Reference Briggs and Bowen2012; Toonen et al., Reference Toonen, Bowen, Iacchei, Briggs and Kliman2016). An Atlantic sector is located between Cape Hatteras and Cape Canaveral, Florida while the second region is situated within the northern Gulf of Mexico. Freshwater ecoregions along the Atlantic coast south of Cape Cod and in the northern Gulf of Mexico were also classified as temperate coastal river habitats; the coast of Florida comprised tropical and subtropical coastal river habitat (FEOW, 2021; Figure S13). Engle & Summers (Reference Engle and Summers2000) found that for estuarine benthic communities, Biscayne Bay, at the southern tip of Florida most probably represents the northern boundary for the tropical fauna further south. An analysis of reef fishes by Floeter et al. (Reference Floeter, Rocha, Robertson, Joyeux, Smith-Vaniz, Wirtz, Edwards, Barreiros, Ferreira, Gasparini, Brito, Falcon, Bowen and Bernardi2008) and Kulbicki et al. (Reference Kulbicki, Parravicini, Bellwood, Arias-Gonzalez, Chabanet, Floeter, Friedlander, McPherson, Myers, Vigliola and Mouillot2013) included the Atlantic ecoregions from Cape Hatteras south within the tropical Caribbean province. In addition, an analysis of benthic communities in estuaries within the northern Gulf of Mexico suggest that this region may represent a separate warm-temperate region (Engle & Summers, Reference Engle and Summers1999). The results of this study indicated that all ecoregions from Cape Cod south to Florida and the Gulf of Mexico formed a single grouping (Figure 6), which broadly agreed with the marine warm-temperate region identified by other workers as well as freshwater ecoregions.
Three tropical western Atlantic provinces were identified by Spalding et al. (Reference Spalding, Fox, Allen, Davidson, Ferdana, Finlayson, Halpern, Jorge, Lourie, Martin, McManus, Molnar, Recchia and Robertson2007); the Tropical North-western Atlantic Province included the southern Gulf of Mexico and the Caribbean Sea; the North Brazil Shelf stretches from the Gulf of Paria to Piaui (Brazil), and the Tropical South-western Atlantic Province extends from Piaui southward to Cabo Frio, Brazil (Spalding et al., Reference Spalding, Fox, Allen, Davidson, Ferdana, Finlayson, Halpern, Jorge, Lourie, Martin, McManus, Molnar, Recchia and Robertson2007; Figure S1). Floeter et al. (Reference Floeter, Rocha, Robertson, Joyeux, Smith-Vaniz, Wirtz, Edwards, Barreiros, Ferreira, Gasparini, Brito, Falcon, Bowen and Bernardi2008), Briggs & Bowen (Reference Briggs and Bowen2012) and Kulbicki et al. (Reference Kulbicki, Parravicini, Bellwood, Arias-Gonzalez, Chabanet, Floeter, Friedlander, McPherson, Myers, Vigliola and Mouillot2013) identified two tropical provinces in the western Atlantic. A Caribbean Province extends from Bermuda and Cape Canaveral, Florida, to the Amazon River (Brazil) near the equator, and a tropical Brazilian Province extends from the mouth of the Amazon River south to southern Santa Catarina, Brazil. Freshwater ecoregions in the southern Gulf of Mexico, the Caribbean Sea and the Brazil coast to Santa Catarina were also primarily classified as tropical and subtropical coastal river habitats (FEOW, 2021; Figure S13). This study also identified two groupings of ecoregions within the tropical western Atlantic. One grouping broadly corresponded with the Caribbean Province although it was restricted to ecoregions in the southern Gulf of Mexico and the northern Caribbean Sea including the Greater Antilles (Figure 7). Floeter et al. (Reference Floeter, Rocha, Robertson, Joyeux, Smith-Vaniz, Wirtz, Edwards, Barreiros, Ferreira, Gasparini, Brito, Falcon, Bowen and Bernardi2008) and Kulbicki et al. (Reference Kulbicki, Parravicini, Bellwood, Arias-Gonzalez, Chabanet, Floeter, Friedlander, McPherson, Myers, Vigliola and Mouillot2013) delineated tropical provinces in the western Atlantic based on reef fishes, however, Toonen et al. (Reference Toonen, Bowen, Iacchei, Briggs and Kliman2016) noted that, between the Brazilian and Caribbean provinces, the north-western coast of South America is influenced by the Orinoco and Amazon rivers and is characterized by turbid waters and a soft substrate; this acts as a barrier to the dispersal of reef biota. In a review of fish ecology and anthropogenic impacts in South American estuaries, Barletta & Lima (Reference Barletta and Lima2019) identified several tropical regions along the northern and east coast of South America. A tropical north-western Atlantic region extended from approximately the Atrato River delta, Columbia to the Gulf of Paria; a tropical North Brazil Shelf region extended from the Gulf of Paria to the Parnaiba River delta, Piaui (Brazil) and included the Orinoco and Amazon rivers. A tropical South-western Atlantic region extended from Parnaiba River delta south to Santos Bay, Sao Paulo (Brazil) (Barletta & Lima, Reference Barletta and Lima2019). This study found that, based on estuary-associated fishes, the ecoregions along the north-western coast and the north-east coast of South America south to Santa Catarina (Brazil) formed a distinctive grouping (Figure 7). Although sub-groups within this cluster broadly corresponded with the tropical/subtropical regions identified by Barletta & Lima (Reference Barletta and Lima2019), the overall similarity within this general group was relatively high (>70%).
Spalding et al. (Reference Spalding, Fox, Allen, Davidson, Ferdana, Finlayson, Halpern, Jorge, Lourie, Martin, McManus, Molnar, Recchia and Robertson2007) identified a warm-temperate south-western Atlantic province from Cabo Frio, Brazil to the Gulf of San Matias, Argentina. Briggs & Bowen (Reference Briggs and Bowen2012) recognized a warm-temperate Argentinian Province extending from Santa Catarina to the Valdez Peninsula, Argentina. Barletta & Lima (Reference Barletta and Lima2019) recognized the region from the Paranagua Estuarine Complex, Paranagua (Brazil) to approximately Rio Grande, Brazil as subtropical and from Rio Grande to approximately Bahia Blanca, Argentina as warm-temperate. Ecoregions between Santa Catarina and the Gulf of San Matias formed a distinct cluster during this study (Figure 7); this corresponded with the warm-temperate region identified by Briggs & Bowen (Reference Briggs and Bowen2012). In addition, all freshwater ecoregions south of Santa Catarina were classified as temperate coastal river habitats (FEOW, 2021; Figure S13).
A cold-temperate Magellanic Province that extended from Gulf of San Matias south along the southern Argentina coast and along the southern (Pacific) coast of Chile to Chiloe Island was identified by Spalding et al. (Reference Spalding, Fox, Allen, Davidson, Ferdana, Finlayson, Halpern, Jorge, Lourie, Martin, McManus, Molnar, Recchia and Robertson2007) (Figure S1). Based on the fauna on the Argentine shelf, Balech & Ehrlich (Reference Balech and Ehrlich2008) identified a cold-temperate Magellanic biogeographic province that extended from the Valdes Peninsula to Tierra del Fuego. In a study of reef fish fauna, Galvan et al. (Reference Galvan, Venerus and Irigoyen2009) noted a change from a warm-temperate to cold-temperate fauna near the Valdes Peninsula. The grouping of ecoregions south of the Gulf of San Matias to Tierra del Fuego during this study corresponded with the cold-temperate Magellanic Province (Figure 7; Figure S2).
Fish species richness of ecoregion groupings within the North-west Atlantic showed relatively low values recorded in northern cold-temperate ecoregions of Hudson Bay and the Newfoundland and Labrador coast; mean richness values increased slightly in the cold-temperate ecoregions from the Gulf of St Lawrence to Cape Cod (Figure 7). High mean species richness values were recorded in the warm-temperate North-west Atlantic and tropical West Atlantic ecoregions. Mean richness then declined toward the warm-temperate and cold-temperate South-west Atlantic ecoregions.
Briggs & Bowen (Reference Briggs and Bowen2012) identified the tropical Caribbean Province as a centre of origin in the Western Atlantic; these centres of origin are locations of high species diversity that actively contribute species to other regions. The distribution of species from tropical regions in the Western Atlantic is facilitated by the Gulf Stream and Brazil Currents. The Gulf Stream is a north flowing current that brings warm water from the Gulf of Mexico into the Atlantic Ocean and up the eastern coast of the USA. This probably accounts for the relatively high species richness recorded in the warm-temperate ecoregions of the USA during this study. Hare et al. (Reference Hare, Churchill, Cowen, Berger, Cornillon, Dragos, Glenn, Govoni and Lee2002) found that the Gulf Stream and associated warm-core rings were mechanisms by which larval fish originating south of Cape Hatteras were transported northward. The Labrador Current is a cold current that flows from the Arctic Ocean south and meets the warm, northward flowing Gulf Stream Current near Nova Scotia, Canada. This serves as a barrier to the northward distribution of warm-water species. Fish species richness in cold-temperate ecoregions under the influence of the Labrador Current were relatively low during this study (Figure 7).
In the southern hemisphere, the Brazil Current is a warm water current that flows south along the continental slope of South America and facilitates the distribution of tropical species southward. The region where the north-flowing Malvinas or Falkland Current, which comprises fresher sub-Antarctic water, meets the Brazil Current probably also forms a barrier to the southward dispersion of warm water fishes. The confluence of these two currents generally occurs between 35 and 45°S (Pierini et al., Reference Pierini, Lovallo, Gomez and Telesca2016) and may vary seasonally; it is usually further north during the winter than during the summer (Matano, Reference Matano1993). The Brazil–Malvinas Confluence Zone occurs within the warm-temperate ecoregions identified during this study and may also account for the relatively low species richness reported for these ecoregions. Species richness further declined in cold-temperate ecoregions under the influence of the cold Malvinas Current (Figure 7).
Eastern Atlantic
Within the North-east Atlantic, Spalding et al. (Reference Spalding, Fox, Allen, Davidson, Ferdana, Finlayson, Halpern, Jorge, Lourie, Martin, McManus, Molnar, Recchia and Robertson2007) identified a temperate Northern European Seas Province that included ecoregions from south and west Iceland to northern Norway, the Baltic Sea, the Celtic Seas and the North Sea (Figure S1). Briggs & Bowen (Reference Briggs and Bowen2012) identified an Eastern Atlantic boreal/cold-temperate region that extended from the Barents Sea to the southern entrance of the English Channel and included Iceland, the Faroe Islands and the Baltic Sea. A similar grouping of ecoregions was recorded during this study and extended from the southern coast of Iceland in the west to the mouth of the White Sea in the east and south to the mouth of the English Channel (Figure 5). This study also found that Iceland was somewhat distinct within this grouping. Briggs & Bowen (Reference Briggs and Bowen2012) noted that the biota of the south and east shores of Iceland has a strong association with the Eastern Atlantic and included it in the Eastern Atlantic Boreal Region. Freshwater ecoregions bordering the Barents Sea, Norwegian Sea and northern Baltic Sea were all classified as polar fresh waters while the remaining ecoregions within this region were classified as temperate coastal rivers (FEOW, 2021; Figure S13).
A cluster analysis of fish assemblages from 17 European estuaries indicated strong latitudinal differences (Elliott & Dewailly, Reference Elliott and Dewailly1995). Fish communities of estuaries in the UK, Belgium, the Netherlands, Germany and Norway were found to be distinct from those in Portugal, Spain and France, and reflected the separation of more boreal fauna in the north from the temperate species to the south (Elliott & Dewailly, Reference Elliott and Dewailly1995). Multivariate analyses of fish species and commercial fishes in over 23 European estuaries also found a latitudinal pattern with estuaries at latitudes above 45°N forming a distinct group from those systems below 45°N (Coates et al., Reference Coates, Colclough, Robson and Harrison2004); estuaries in the Baltic Sea were also found to be distinct. Toonen et al. (Reference Toonen, Bowen, Iacchei, Briggs and Kliman2016) noted that although the Baltic Sea, which was recognized as the world's largest estuarine area, was previously identified as a distinct province, its separation from the Eastern Atlantic boreal/cold-temperate region was not justified based on endemism. This study also did not identify the Baltic Sea ecoregion as distinct from the remaining cold-temperate Eastern Atlantic ecoregions; this is probably due to the analysis being restricted to estuary-associated fishes, which would not differentiate the Baltic Sea from other ecoregions in the area.
Briggs & Bowen (Reference Briggs and Bowen2012) identified a warm-temperate Lusitania Province that extended from the southern entrance of the English Channel to southern Morocco and eastwards through the Mediterranean Sea. Spalding et al. (Reference Spalding, Fox, Allen, Davidson, Ferdana, Finlayson, Halpern, Jorge, Lourie, Martin, McManus, Molnar, Recchia and Robertson2007), however, identified two separate Lusitanian and Mediterranean Sea provinces. The results of this study corresponded with the warm-temperate Lusitania Province identified by Briggs & Bowen (Reference Briggs and Bowen2012), where ecoregions in the Atlantic and Mediterranean Sea were grouped together (Figure 5). The Black Sea ecoregion and the Saharan Upwelling ecoregion, which was situated along the Atlantic coast of Morocco, however, were distinct within this broad group. The Black Sea was also considered a separate biogeographic province by Spalding et al. (Reference Spalding, Fox, Allen, Davidson, Ferdana, Finlayson, Halpern, Jorge, Lourie, Martin, McManus, Molnar, Recchia and Robertson2007) and Briggs & Bowen (Reference Briggs and Bowen2012). In terms of freshwater ecoregions, those bordering the Atlantic Ocean including the north-west African (Morocco) coast as well as the northern and south-western Mediterranean were classified as temperate coastal river systems. Ecoregions in the south-east Mediterranean were categorized as xeric in arid, semi-arid or dry sub-humid environments (FEOW, 2021; Figure S13).
Two Eastern Atlantic tropical provinces were identified by Spalding et al. (Reference Spalding, Fox, Allen, Davidson, Ferdana, Finlayson, Halpern, Jorge, Lourie, Martin, McManus, Molnar, Recchia and Robertson2007). The West African Transition Province included the Cape Verde Islands and the West African coast from Mauritania to Guinea-Bissau; the Gulf of Guinea Province extended from Guinea-Bissau west and southward to and including most of the coast of Angola (Spalding et al., Reference Spalding, Fox, Allen, Davidson, Ferdana, Finlayson, Halpern, Jorge, Lourie, Martin, McManus, Molnar, Recchia and Robertson2007). Briggs & Bowen (Reference Briggs and Bowen2012) identified a single Tropical Eastern Atlantic Province, which extended from Cape Juby, Morocco to Namibe (Angola). In an assessment of fish diversity in sub-Saharan African estuaries, Whitfield (Reference Whitfield2005) identified a western African tropical region between latitudes 15°N to 15°S, and a subtropical region that extended between 15 and 20°S. This study identified a grouping of ecoregions from Mauritania to Angola (Figure 7; Figure S6); this broadly agreed with the combined tropical provinces of Spalding et al. (Reference Spalding, Fox, Allen, Davidson, Ferdana, Finlayson, Halpern, Jorge, Lourie, Martin, McManus, Molnar, Recchia and Robertson2007) and the Tropical Eastern Atlantic Province of Briggs & Bowen (Reference Briggs and Bowen2012). Freshwater ecoregions within this region were also classified as tropical and subtropical coastal river habitats (FEOW, 2021; Figure S13).
Spalding et al. (Reference Spalding, Fox, Allen, Davidson, Ferdana, Finlayson, Halpern, Jorge, Lourie, Martin, McManus, Molnar, Recchia and Robertson2007) identified a Temperate Benguela Province that included ecoregions from southern Angola, Namibia and the west coast of South Africa (Figure S1). Other workers also identified a warm-temperate Benguela Province between Namibe, Angola and the Cape of Good Hope, South Africa (Floeter et al., Reference Floeter, Rocha, Robertson, Joyeux, Smith-Vaniz, Wirtz, Edwards, Barreiros, Ferreira, Gasparini, Brito, Falcon, Bowen and Bernardi2008; Briggs & Bowen, Reference Briggs and Bowen2012; Toonen et al., Reference Toonen, Bowen, Iacchei, Briggs and Kliman2016). In an analysis of fishes from South African estuaries, Harrison (Reference Harrison2002) identified a cool-temperate region that extended from the Orange River at the border between Namibia and South Africa to Cape Agulhas (South Africa). Whitfield (Reference Whitfield2005) identified a warm-temperate estuarine region on the Namibian coast between 20 and 25°S and a cool-temperate region between 25 and 35°S. Although the ecoregions within this southern African (Atlantic) region fell within the broad grouping that included the tropical Eastern Atlantic ecoregions during this study, this area formed a distinct sub-group that corresponded with the marine warm-temperate Benguela Province (Spalding et al., Reference Spalding, Fox, Allen, Davidson, Ferdana, Finlayson, Halpern, Jorge, Lourie, Martin, McManus, Molnar, Recchia and Robertson2007; Floeter et al., Reference Floeter, Rocha, Robertson, Joyeux, Smith-Vaniz, Wirtz, Edwards, Barreiros, Ferreira, Gasparini, Brito, Falcon, Bowen and Bernardi2008; Briggs & Bowen, Reference Briggs and Bowen2012; Toonen et al., Reference Toonen, Bowen, Iacchei, Briggs and Kliman2016). Freshwater ecoregions within this area were also different from those to the north and were characterized by xeric in arid, semi-arid or dry sub-humid environments (FEOW, 2021; Figure S13).
Fish species richness of ecoregion groupings within the east Atlantic showed relatively low values recorded in southern Iceland; mean richness values increased from the cold-temperate eastern Atlantic ecoregions toward the warm-temperate ecoregions of the Black Sea, the Lusitania Province and the Saharan Upwelling ecoregion (Figure 7). Mean species richness values remained relatively consistent throughout these warm-temperate regions before reaching a peak in tropical eastern Atlantic ecoregions; species richness then declined toward the warm/cool-temperate Benguela ecoregions. Whitfield (Reference Whitfield2005) also noted a decrease in both estuary fish species and family diversity in sub-Saharan estuaries between tropical and temperate systems. The tropical eastern Atlantic ecoregions are bordered both to the north and to the south by Eastern Boundary Upwelling Systems. The Benguela Current is a north-flowing boundary upwelling system that extends from the south-east tip of Africa to Angola; upwelling is strongest and most persistent off Namibia in the Lüderitz region (Garcia-Reyes et al., Reference Garcia-Reyes, Sydeman, Schoeman, Rykaczewski, Black, Smit and Bograd2015). To the north of the tropical eastern Atlantic, the Iberian/Canary boundary upwelling system flows southward from the Iberian Peninsula to Senegal; the most intense and persistent upwelling occurs off north-west Africa (Garcia-Reyes et al., Reference Garcia-Reyes, Sydeman, Schoeman, Rykaczewski, Black, Smit and Bograd2015). These cold, upwelling systems probably serve as barriers to the distribution of tropical species to higher latitudes.
In addition, areas adjacent to these upwelling systems are characterized by desert conditions. The Sahara Desert lies to the north of the tropical eastern Atlantic; there are no permanent rivers in this region and drainage courses are almost always dry (FEOW, 2021). To the south, coastal draining rivers of the Namib Desert and Karoo are also ephemeral and typically dry. Whitfield (Reference Whitfield2005) noted that in both the south-western African subtropical and warm-temperate regions that he identified, the arid coast contained very few estuaries. The lack of suitable estuarine habitat probably further acts as a barrier to the extension and distribution of tropical estuary-associated fish species. It is also interesting to note that the fish communities of the warm/cool-temperate Benguela region were more similar to those of the tropical eastern Atlantic ecoregions, which suggests a subtraction of tropical species southward. Fish communities to the north of the tropical eastern Atlantic, however, were more similar to ecoregions within the warm-temperate Lusitania Province, suggesting that the northward dispersal of tropical species was restricted.
Western Indian Ocean
Within the Western Indian Ocean, Spalding et al. (Reference Spalding, Fox, Allen, Davidson, Ferdana, Finlayson, Halpern, Jorge, Lourie, Martin, McManus, Molnar, Recchia and Robertson2007) identified four biogeographic provinces. A Somali/Arabian Province included the Gulf of Oman, the Persian Gulf, the western Arabian Sea, and the north-east Somali coast; a second province included the Red Sea and Gulf of Aden. A Western Indian Ocean Province extended from Kenya to South Africa and included Madagascar, the Seychelles and the Mascarene Islands. The fourth province comprised the temperate Agulhas Province, which included the entire South African east coast (Figure S1). Briggs & Bowen (Reference Briggs and Bowen2012) identified three provinces within the Western Indian Ocean region. The Red Sea Province included the Red Sea and the Gulf of Aden; the Western Indian Ocean Province extended from the Persian Gulf south to about the mouth of the Kei River, South Africa and included the coast of Madagascar and the offshore island groups of the Seychelles and Comoros. The region between the Kei River and Cape Point, South Africa fell within the warm-temperate Agulhas Province (Briggs & Bowen, Reference Briggs and Bowen2012; Toonen et al., Reference Toonen, Bowen, Iacchei, Briggs and Kliman2016).
Based on reef fish checklists, Kulbicki et al. (Reference Kulbicki, Parravicini, Bellwood, Arias-Gonzalez, Chabanet, Floeter, Friedlander, McPherson, Myers, Vigliola and Mouillot2013) divided the Western Indian Ocean into two provinces; a North-Western Indian Province comprised the Red Sea and Arabian Peninsula, and the Western Indian Ocean Province grouped the Seychelles, the Mascarene Plateau, Madagascar, and the east coast of Africa from Somalia to South Africa (Kulbicki et al., Reference Kulbicki, Parravicini, Bellwood, Arias-Gonzalez, Chabanet, Floeter, Friedlander, McPherson, Myers, Vigliola and Mouillot2013). When considered at the marine ecoregion level, however, three groupings were identified. Ecoregions from the Gulf of Oman, the Persian Gulf, the Gulf of Aden, the Red Sea and the Somali coast formed one grouping; ecoregions along the east and southern African coast from Kenya to the Cape of Good Hope, South Africa formed a second group; and ecoregions surrounding Madagascar and including the Mascarene and Maldive islands formed a third grouping (Kulbicki et al., Reference Kulbicki, Parravicini, Bellwood, Arias-Gonzalez, Chabanet, Floeter, Friedlander, McPherson, Myers, Vigliola and Mouillot2013).
This study identified two broad groupings within the Western Indian Ocean (Figure 4; Figure S10). A northern region extended from Pakistan to the north-east Somali coast, and included the Gulf of Oman, the Persian Gulf, the Gulf of Aden and the Red Sea. The second broad grouping included ecoregions from Kenya south to the tip of South Africa and included the coast of Madagascar. These broadly agreed with the provinces identified by Kulbicki et al. (Reference Kulbicki, Parravicini, Bellwood, Arias-Gonzalez, Chabanet, Floeter, Friedlander, McPherson, Myers, Vigliola and Mouillot2013) based on reef species checklist data. The habitat classification of freshwater ecoregions also broadly agreed with the groupings identified during this study (FEOW, 2021). Ecoregions within the northern grouping were classified as xeric in arid, semi-arid or dry sub-humid environments and freshwater ecoregions from Mombasa, Kenya to Port St Johns, South Africa were classified as tropical and subtropical coastal river habitats (Figure S13). The Northern Monsoon Current Coast ecoregion that included the south-east Somali coast and the north coast of Kenya was identified as an outlier during this study; however, given that the freshwater habitat within this area was classified as xeric (FEOW, 2021; Figure S13), it is likely that this ecoregion is more aligned with the northern group of marine ecoregions. Its classification as an outlier may also be due to the paucity of fish species records; only 20 estuary-associated fish species were recorded for this region while the number of taxa for the other ecoregions within this northern region averaged 127 species.
The overall fish species richness of ecoregions within the northern Western Indian Ocean (mean richness = 127) was also lower than that recorded from the remaining ecoregions in the central and southern Western Indian Ocean (mean richness = 207) (Figure 7; Figure S10). This may be a reflection of the arid conditions that characterized the northern Western Indian Ocean region (Figure S1) and the paucity of suitable habitat for estuary-associated fish species. Coastal areas within the northern Western Indian Ocean region have very few permanent rivers (FEOW, 2021); there are, however, numerous riverbeds or wadis that are typically dry but flow briefly after occasional heavy rain.
This study also found that the Gulf of Oman ecoregion and the Central Somali Coast ecoregion were somewhat distinct within the northern Western Indian Ocean grouping (Figure 7; Figure S10); these ecoregions also had a relatively lower species richness than the remaining ecoregions. A major feature of the Gulf of Oman (Sea of Oman) is seasonal upwelling that occurs along the southern coast of Iran in February and March (Piontkovski et al., Reference Piontkovski, Al-Gheilani, Jupp, Al-Azri and Al-Hashmi2012). This probably also restricts the distribution and occurrence of warm water species in the region. The east coast of Somalia is also subject to coastal upwelling as a result of the influence of the Somali Current system (Fieux, Reference Fieux and Steele2001). This probably also acts as a barrier to the distribution of tropical estuarine-associated species from the south. Carbone & Accordi (Reference Carbone and Accordi2000) noted that coral reefs extend along the Somali coast from Kenya to approximately Mogadishu. However, north of Mogadishu coral reefs were either absent or poorly developed and this was attributed to the presence of cold, upwelled water in this region.
Within the central and southern Western Indian Ocean grouping, two ecoregions were also identified as fairly distinct during this study. These included the South-east Madagascar ecoregion and the Agulhas Bank ecoregion, South Africa (Figure 7; Figure S10). Both ecoregions also exhibited a lower species richness relative to that recorded in the remaining ecoregions within the central and southern Western Indian Ocean grouping. The relatively low species richness and distinctive communities recorded in the South-east Madagascar Ecoregion may be a result of a paucity of fish records within this region. However, the southeast coast of Madagascar, which is influenced by the south-flowing East Madagascar Current, is also subject to upwelling events (Lutjeharms & Machu, Reference Lutjeharms and Machu2000) and this may limit the occurrence and distribution of tropical species within this ecoregion.
The Agulhas Bank ecoregion broadly corresponds with the warm-temperate Agulhas Province of Spalding et al. (Reference Spalding, Fox, Allen, Davidson, Ferdana, Finlayson, Halpern, Jorge, Lourie, Martin, McManus, Molnar, Recchia and Robertson2007) and Briggs & Bowen (Reference Briggs and Bowen2012). Furthermore, based on an analysis of South African estuarine fish communities, Harrison (Reference Harrison2002) identified a warm-temperate region extending from approximately Port St Johns to Cape Agulhas. Freshwater habitats also exhibited a change from tropical and subtropical coastal river habitats north of Port St Johns to a mix of temperate habitats to the south (FEOW, 2021; Figure S13). The south-flowing Agulhas Current facilitates the transport of tropical species along the South African coast. However, to the south of Port St Johns, the Agulhas Current moves offshore and this area is subject to upwelling (Lutjeharms et al., Reference Lutjeharms, Cooper and Roberts2000). This serves to restrict the southern distribution of tropical species and probably accounts for the reduced species richness within the Agulhas Bank ecoregion. A similar reduction in species richness was reported by Harrison (Reference Harrison2002) where subtropical estuaries, north of Port St Johns had a higher fish species richness than those to the south.
Western North Pacific, Indo-West Pacific and Australia & New Zealand
Western North Pacific
Within the temperate Northern Pacific, Spalding et al. (Reference Spalding, Fox, Allen, Davidson, Ferdana, Finlayson, Halpern, Jorge, Lourie, Martin, McManus, Molnar, Recchia and Robertson2007) identified a cold temperate North-west Pacific Province that extended from the western Bering Sea and the Sea of Okhotsk south to the Sea of Japan and the Yellow Sea and included the east coast of Japan and the Kuril Islands (Figure S1). Briggs & Bowen (Reference Briggs and Bowen2012) and Toonen et al. (Reference Toonen, Bowen, Iacchei, Briggs and Kliman2016) identified three cold-temperate provinces in the North-west Pacific. An Oriental Province extends northward from approximately Wenzhou, China and includes the Yellow Sea and the Sea of Japan to about Chongjin, North Korea; this province is discontinuous and is broken by the tip of the Korean Peninsula, which falls within the warm-temperate Sino-Japanese Province. On the eastern side of the Sea of Japan, the Oriental Province extends from about Hamada, Japan to the Tsugaru Strait and southward along the east (Pacific) coast of Japan to Cape Inubo. The cold-temperate Kurile Province extends northwards from the Tsugaru Strait along the Kurile chain of Islands and the east coast of the Kamchatka Peninsula in the Bering Sea to about Cape Olyutorsky, Russia. The Okhotsk Province is confined to the Sea of Okhotsk (Briggs & Bowen, Reference Briggs and Bowen2012; Toonen et al., Reference Toonen, Bowen, Iacchei, Briggs and Kliman2016). Together, these three cold-temperate provinces broadly correspond with the cold-temperate North-west Pacific Province of Spalding et al. (Reference Spalding, Fox, Allen, Davidson, Ferdana, Finlayson, Halpern, Jorge, Lourie, Martin, McManus, Molnar, Recchia and Robertson2007).
This study identified three groupings of ecoregions within the Western North Pacific. One group comprised ecoregions from the western Bering Sea southward to the north and east coast of Hokkaido, Japan and included the Sea of Okhotsk (Figure 7; Figure S4). This grouping broadly corresponded with the Kurile and Okhotsk provinces of Briggs & Bowen (Reference Briggs and Bowen2012) and Toonen et al. (Reference Toonen, Bowen, Iacchei, Briggs and Kliman2016). The second grouping of ecoregions during this study generally corresponded with the cold-temperate Oriental Province (Briggs & Bowen, Reference Briggs and Bowen2012; Toonen et al., Reference Toonen, Bowen, Iacchei, Briggs and Kliman2016) and comprised ecoregions in the Sea of Japan and the east coast of Japan (Figure 7; Figure S4). The Yellow Sea ecoregion was somewhat unique during this study. Freshwater habitats within the groupings of ecoregions identified during this study ranged from polar freshwaters in the western Bering Sea to temperate coastal rivers on the Kamchatka Peninsula and draining into the Sea of Okhotsk (FEOW, 2021; Figure S13). Drainages flowing into the Yellow Sea comprised a mix of temperate coastal rivers and temperate floodplain rivers and wetlands; this extended south to approximately Shanghai, China. Freshwater habitats in Japan were classified as temperate coastal rivers (FEOW, 2021; Figure S13).
Spalding et al. (Reference Spalding, Fox, Allen, Davidson, Ferdana, Finlayson, Halpern, Jorge, Lourie, Martin, McManus, Molnar, Recchia and Robertson2007) identified a warm-temperate North-west Pacific province that included the south coast of Japan and the East China Sea. Briggs & Bowen (Reference Briggs and Bowen2012) also identified a warm-temperate Sino-Japanese Province that included the East China Sea from Wenzhou, China southwards to Hong Kong (China). This province also included the waters around Taiwan, the southern coast of Japan between Hamada and Cape Inubo, and the Korean Peninsula. This study also found that ecoregions within this warm-temperate Sino-Japanese Province formed a grouping (Figure 7; Figure S11); this grouping, however, also included ecoregions further south to Vietnam. The grouping of ecoregions identified during this study represented a sub-group of the wider tropical/subtropical Indo-West Pacific ecoregions. This suggests that the estuary-associated fish assemblages within Sino-Japanese region have a greater affinity with the tropical/subtropical Indo-West Pacific region than more temperate northern regions. Following an analysis of reef fishes based on ecoregions, Kulbiki et al. (Reference Kulbicki, Parravicini, Bellwood, Arias-Gonzalez, Chabanet, Floeter, Friedlander, McPherson, Myers, Vigliola and Mouillot2013) identified a province within the Central Indo-Pacific that grouped ecoregions extending from Vietnam to Japan and included Malaysia and the Philippines. Freshwater ecoregions from Shanghai, China south to approximately Ho Chi Minh, Vietnam comprised a mix of tropical and subtropical coastal rivers and tropical and subtropical floodplain rivers and wetland complexes (FEOW, 2021; Figure S13).
Indo-West Pacific
Within the tropical Indo-West Pacific region, Briggs & Bowen (Reference Briggs and Bowen2012) identified a single Indo-Polynesian Province that extended from the Arabian Gulf in the west to the Tuamotu Archipelago, Polynesia in the east, and from the Ryukyu Archipelago, Japan in the north to Australia in the south. Although Spalding et al. (Reference Spalding, Fox, Allen, Davidson, Ferdana, Finlayson, Halpern, Jorge, Lourie, Martin, McManus, Molnar, Recchia and Robertson2007) recognized a single Indo-Polynesian province, they noted that the clinal change in fauna across this region results in distinct communities at the extreme ends of this area and as a result, delineated several provinces within the region. Some 11 provinces were identified within the ecoregions included in this study (Spalding et al., Reference Spalding, Fox, Allen, Davidson, Ferdana, Finlayson, Halpern, Jorge, Lourie, Martin, McManus, Molnar, Recchia and Robertson2007). Based on an analysis of reef fishes, Kulbiki et al. (Reference Kulbicki, Parravicini, Bellwood, Arias-Gonzalez, Chabanet, Floeter, Friedlander, McPherson, Myers, Vigliola and Mouillot2013) identified several biogeographic subsets within the Central Indo-Pacific and Central Pacific regions.
This study also identified several groupings within the Indo-West Pacific; although mean fish species richness within these groupings was relatively uniform, the fish assemblages recorded were sufficiently different to enable groupings of ecoregions to be identified (Figure 7; Figure S11). One group included ecoregions extending from Pakistan to the south coast of East Java, the Straits of Mallacca, the Gulf of Thailand and north to Vietnam. This grouping broadly corresponded with the West and South Indian Shelf, Bay of Bengal, Andaman, Java Transitional and Sunda Shelf provinces of Spalding et al. (Reference Spalding, Fox, Allen, Davidson, Ferdana, Finlayson, Halpern, Jorge, Lourie, Martin, McManus, Molnar, Recchia and Robertson2007). The grouping identified during this study also agreed with the western province identified by Kulbiki et al. (Reference Kulbicki, Parravicini, Bellwood, Arias-Gonzalez, Chabanet, Floeter, Friedlander, McPherson, Myers, Vigliola and Mouillot2013), which extended from the Java Sea to west India. Freshwater habitats within this grouping of ecoregions included tropical and subtropical floodplain rivers and wetland complexes, tropical and subtropical coastal rivers, and large river deltas (FEOW, 2021; Figure S13).
A second grouping identified during this study included ecoregions extending from the Philippines south to the Lesser Sunda Islands and along the northern coast of New Guinea (Figure 7; Figure S11). This corresponded with the Western Coral Triangle and Eastern Coral Triangle provinces delineated by Spalding et al. (Reference Spalding, Fox, Allen, Davidson, Ferdana, Finlayson, Halpern, Jorge, Lourie, Martin, McManus, Molnar, Recchia and Robertson2007) (Figure S1). Kulbriki et al. (Reference Kulbicki, Parravicini, Bellwood, Arias-Gonzalez, Chabanet, Floeter, Friedlander, McPherson, Myers, Vigliola and Mouillot2013) also identified an Indo-Australian Archipelago (IAA) or Coral Triangle Province that included the east coast of Kalimantan (Borneo), Sulawesi, New Guinea and the Lesser Sunda Islands. Apart from the northern coast of New Guinea, which was characterized as comprising montane freshwaters, the remaining freshwater habitats within this grouping of ecoregions comprised tropical and subtropical coastal rivers (FEOW, 2021; Figure S13).
A third grouping of ecoregions identified during this study included the north coast of Australia and the south coast of New Guinea bordering the Arafura Sea (Figure 7; Figure S11). This grouping broadly corresponded with the Sahul Shelf, North-east Australian Shelf and Northwest Australian Shelf provinces of Spalding et al. (Reference Spalding, Fox, Allen, Davidson, Ferdana, Finlayson, Halpern, Jorge, Lourie, Martin, McManus, Molnar, Recchia and Robertson2007) (Figure S1). An integrated marine and coastal regionalization of Australia (IMCRA) identified several provincial bioregions based on continental shelf demersal fishes (Commonwealth of Australia, 2006). Tropical bioregions were also identified along the north coast of Australia from Western Australia, Northern Territory to northern Queensland. Based on analysis at the ecoregion level, Kulbriki et al. (Reference Kulbicki, Parravicini, Bellwood, Arias-Gonzalez, Chabanet, Floeter, Friedlander, McPherson, Myers, Vigliola and Mouillot2013) also identified an Australian region extending from western Australia to the Kermadec Islands, New Zealand. Freshwater habitats in this grouping of ecoregions included tropical and subtropical coastal rivers along the southern coast of New Guinea, the Northern Territory (Australia) and the Queensland coast (Australia); Western Australia was characterized by xeric and endorheic (closed) basins (FEOW, 2021; Figure S13).
Several ecoregions were also identified as outliers during this study (Figure 7; Figure S11); this may be due to a paucity of fish records for these ecoregions. Mean species richness values for the ecoregion groupings measured between 349 and 386 taxa while species richness values for the outlier ecoregions ranged between 28 and 293 species. The locality of the West Sumatra ecoregion suggests that this area is probably associated with the western grouping. Similarly, the Halmahera (North Maluku) and North-east Sulawesi (Gulf of Tomini) ecoregions are situated within the central Coral Triangle grouping. Kulbriki et al. (Reference Kulbicki, Parravicini, Bellwood, Arias-Gonzalez, Chabanet, Floeter, Friedlander, McPherson, Myers, Vigliola and Mouillot2013) included the South-east Papua New Guinea and Gulf of Papua ecoregions within the IAA (Coral Triangle) Province; it is likely that the estuary-associated fish communities also lie within this grouping. Kulbriki et al. (Reference Kulbicki, Parravicini, Bellwood, Arias-Gonzalez, Chabanet, Floeter, Friedlander, McPherson, Myers, Vigliola and Mouillot2013) indicated that the Sunda Shelf/Java Sea ecoregion, situated in the South China Sea was grouped within the Western Province ecoregions. Spalding et al. (Reference Spalding, Fox, Allen, Davidson, Ferdana, Finlayson, Halpern, Jorge, Lourie, Martin, McManus, Molnar, Recchia and Robertson2007) also included this ecoregion within the Sunda Shelf Province, which was one of the provinces that corresponded with the western grouping of ecoregions during this study.
Australia and New Zealand
Spalding et al. (Reference Spalding, Fox, Allen, Davidson, Ferdana, Finlayson, Halpern, Jorge, Lourie, Martin, McManus, Molnar, Recchia and Robertson2007) identified six temperate Australasian provinces; these included the West Central Australian Shelf along the west coast of Australia, the East Central Australian Shelf along the east Australian coast of Queensland and New South Wales, the South-east Australian Shelf from New South Wales to South Australia, the South-west Australian Shelf from South Australia to Perth (WA), North Island (New Zealand) and South Island, New Zealand (Figure S1). The marine and coastal regionalization of Australia identified a mix of warm-temperate and transition zone bioregions along the east Australian coast from southern Queensland, New South Wales and southern Victoria (Commonwealth of Australia, 2006). Subtropical, warm-temperate, and transition zone bioregions extended along the west and south coast including Western Australia, South Australia and western Victoria; the island of Tasmania and the coast central Victoria comprised cold-temperate bioregions (Commonwealth of Australia, 2006). Briggs & Bowen (Reference Briggs and Bowen2012) identified a warm-temperate South-eastern Australian (Peronian) Province that extended along the eastern coast of Australia from Sandy Cape, north of Brisbane to approximately Green Cape, roughly halfway between Sydney and Melbourne. A warm-temperate South-western Australian (Flindersian) Province extended from Shark Bay, Western Australia to Cape Jaffa, South Australia roughly halfway between Adelaide and Melbourne. Briggs & Bowen (Reference Briggs and Bowen2012) also identified a warm-temperate Auckland Province circling the northern tip of North Island (New Zealand) between Auckland and East Cape. A cold-temperate Tasmania (Maugean) Province included the island of Tasmania and the Victoria coast of Australia between Cape Jaffa and Green Cape (Briggs & Bowen, Reference Briggs and Bowen2012). The coast of New Zealand, excluding the northern warm-temperate Auckland Province was also identified as a cold-temperate region (Briggs & Bowen, Reference Briggs and Bowen2012).
Freshwater ecoregions along the Australian coast from north-east Queensland to eastern South Australia and including Tasmania were classified as temperate coastal rivers and temperate floodplain rivers and wetlands (FEOW, 2021; Figure S13). The south coast from South Australia to and including the Great Australian Bight, Western Australia was classified as xeric freshwaters and endorheic (closed) basins; all drainages in this region are landlocked and do not reach the ocean. From the Great Australian Bight to the south-west coast of Western Australia were classified as temperate coastal rivers. Freshwater ecoregions along the west and northern west coast of Western Australia were classified as xeric and endorheic (closed) basins. All freshwater ecoregions in New Zealand were classified as temperate coastal rivers (FEOW, 2021; Figure S13).
This study identified three broad groupings of ecoregions within the Australia–New Zealand region (Figure 7; Figure S12). One grouping extended along the north-west coast of Western Australia; a second grouping comprised ecoregions that extended along the west coast of Western Australia, along the south coast, including Tasmania and up the east coast to south-east Queensland. The third grouping comprised ecoregions covering the entire New Zealand coast. Ecoregions on the north-west coast of Western Australia corresponded with the IMCRA Central Western subtropical and transitional bioregions (Commonwealth of Australia, 2006). Ecoregions along the west, south and east coast could be further sub-divided into an east coast group from south-east Queensland to eastern Victoria (Figure 7; Figure S12). This broadly corresponded with the warm-temperate South-eastern Australian Province identified by Briggs & Bowen (Reference Briggs and Bowen2012) as well as the IMCRA Central Eastern and South-east warm-temperate and transitional bioregions (Commonwealth of Australia, 2006). A second sub-group extended along the south coast from Victoria to the west of the Great Australian Bight, Western Australia and included Tasmania (Figure 7; Figure S12). Although Tasmania and the Bass Strait coast of Victoria was identified as a separate cold-temperate province (Commonwealth of Australia, 2006; Briggs & Bowen, Reference Briggs and Bowen2012; Toonen et al., Reference Toonen, Bowen, Iacchei, Briggs and Kliman2016), this study suggests that, based on estuary-associated fishes, ecoregions that included Tasmania were not distinct from the remaining ecoregions within this sub-group. In a study of fishes and invertebrates of Tasmanian estuaries Edgar et al. (Reference Edgar, Barrett and Last1999) found that nearly all species were widely distributed and were also recorded in south-eastern Australia; many species that were collected in Tasmanian estuaries were also dominant in Victorian and New South Wales estuaries. Overall, the sub-group of ecoregions identified during this study did not clearly correspond with any marine or freshwater biogeographic regions but included part of the marine warm-temperate South-western Australian Province as well as the cold-temperate Tasmania Province (Briggs & Bowen, Reference Briggs and Bowen2012; Toonen et al., Reference Toonen, Bowen, Iacchei, Briggs and Kliman2016). The third sub-group of ecoregions extended from the Great Australian Bight and along the west coast of Western Australia (Figure 7; Figure S12). This represented the western section of the warm-temperate Southwestern Australian Province (Briggs & Bowen, Reference Briggs and Bowen2012; Toonen et al., Reference Toonen, Bowen, Iacchei, Briggs and Kliman2016). This grouping also corresponded with the IMCRA South-west warm-temperate and transitional bioregions (Commonwealth of Australia, 2006).
The group of ecoregions that included the New Zealand coast during this study broadly corresponded with the cold-temperate New Zealand region identified by Briggs & Bowen (Reference Briggs and Bowen2012). Although Briggs & Bowen (Reference Briggs and Bowen2012) recognized a warm-temperate Auckland Province in New Zealand, this study did not separate the northern New Zealand ecoregions from the remainder.
Mean fish species richness of ecoregion groups within the western North Pacific, Indo-West Pacific, Australia, and New Zealand exhibited an increase from the cold-temperate Kurile/Okhotsk and Oriental ecoregions to warm-temperate Sino-Japanese ecoregions and tropical western Indo-Pacific, tropical Coral Triangle and tropical northern Australian ecoregions. Mean fish species richness then declined toward the warm-temperate south-eastern and south-western Australian ecoregions and the cold-temperate New Zealand ecoregions (Figure 7). The Coral Triangle has a high diversity of marine fishes and is considered a centre of origin in the Indo-Pacific (Briggs, Reference Briggs2003; Bowen et al., Reference Bowen, Rocha, Toonen, Karl and Laboratory2013). Centres of origin are locations of high species diversity that actively contribute species to other regions. The dispersal of fishes from the Coral Triangle is facilitated by ocean currents (Fukuta et al., Reference Fukuta, Kamimura, Hori, Nakaoka, Noda, Yamashita, Otake and Shoji2017; Morioka et al., Reference Morioka, Varlamov and Miyazawa2019).
The Kuroshio Current is a western boundary current in the North Pacific that originates east of the Philippines and flows in a north-eastward direction past Taiwan and the Pacific coast of Japan (Gallagher et al., Reference Gallagher, Kitamura, Iryu, Itaki, Koizumi and Hoiles2015). The Kuroshio Current brings warm, tropical waters northward and is probably responsible for the relatively high fish species richness recorded in the warm-temperate Sino-Japan ecoregions during this study. The Kuroshio Current leaves the Japanese coast at approximately the Bōsō Peninsula (~35°N) and flows eastward into the North Pacific Ocean (Gallagher et al., Reference Gallagher, Kitamura, Iryu, Itaki, Koizumi and Hoiles2015); this region is a transition zone where the Kuroshio Current meets the south flowing Oyashio Current which is fed by cold subarctic waters (Sakurai, Reference Sakurai2007). This zone serves as a barrier to the northward distribution of tropical species. In a study of fish communities of sub-tidal seagrass beds along the Japanese coast, Fukuta et al. (Reference Fukuta, Kamimura, Hori, Nakaoka, Noda, Yamashita, Otake and Shoji2017) found that sites were grouped into two clusters and that the border between these clusters corresponded with the area of mixing of the Oyashio and Kuroshio currents; this represented a border between the warm-temperate and cool-temperate zone off the Pacific coast of Japan. Kume et al. (Reference Kume, Lavergne, Ahn, Terashima, Kadowaki, Ye, Kameyama, Kai, Henmi, Yamashita and Kasai2021) used environmental DNA metabarcoding to examine Japanese estuarine and coastal fish communities and also found that geographic location or latitude was the main factor responsible for structuring estuarine and coastal fish communities; northern Japanese regions were characterized by cold-water fishes while warm-water fishes were characteristic of southern regions (Kume et al., Reference Kume, Lavergne, Ahn, Terashima, Kadowaki, Ye, Kameyama, Kai, Henmi, Yamashita and Kasai2021). The results of this study also showed a reduction in species richness recorded in ecoregions in the cold-temperate Kurile/Okhotsk and Oriental provinces (Figure 7).
The southward dispersal of tropical species from the Coral Triangle is facilitated by the East Australian Current and the Leeuwin Current. The East Australian Current is a western boundary current that brings warm tropical water from the equator southward along the east coast of Australia (Ypma et al., Reference Ypma, van Sebille, Kiss and Spence2016). The East Australian Current is also responsible for transporting tropical fishes southward into more temperate waters. Booth et al. (Reference Booth, Figueira, Gregson, Brown and Beretta2007), for example, reported tropical fish species at locations spanning most of the length of the New South Wales coast. The East Australian Current is also probably responsible for the relatively high species richness reported in the warm-temperate south-east Australian ecoregions during this study (Figure 7; Figure S12). The Leeuwin Current brings tropical waters down the west coast of Australia and then flows eastward along the south coast (Waite et al., Reference Waite, Thompson, Pesant, Feng, Beckley, Domingues, Gaughan, Hanson, Holl, Koslow, Meuleners, Montoya, Moore, Muhling, Paterson, Rennie, Strzelecki and Twomey2007; Pearce et al., Reference Pearce, Slawinski, Feng, Hutchins and Fearns2011). This current also transports tropical fishes southward down the coast of Western Australia; Pearce & Hutchins (Reference Pearce and Hutchins2009) found that the Leeuwin Current was responsible for the occurrence of tropical fishes as far south as Rottnest Island (Perth), Western Australia.
Fish species richness of ecoregions along the warm-temperate west and southern coasts of Australia during this study, however, were relatively low compared with the fish species richness of south-east Australian ecoregions (Figure 7; Figure S12). Large parts of the western and southern Australian coast are arid and as such contain very few estuaries (Harris et al., Reference Harris, Heap, Bryce, Porter-Smith, Ryan and Heggie2002). Suitable habitat for estuary-associated fish species is therefore limited and this probably contributes to the reduced species richness within these areas. In addition, the west and south coasts are subject to upwelling (Middleton & Bye, Reference Middleton and Bye2007; Waite et al., Reference Waite, Thompson, Pesant, Feng, Beckley, Domingues, Gaughan, Hanson, Holl, Koslow, Meuleners, Montoya, Moore, Muhling, Paterson, Rennie, Strzelecki and Twomey2007) which probably further restricts the distribution of tropical species. Fish species richness further declined within the cold-temperate New Zealand ecoregions (Figure 7; Figure S12).
Synthesis
The grouping of marine ecoregions based on meta-assemblages of estuary-associated fishes during this study broadly agreed with biogeographic regions identified for marine nearshore fishes (e.g. Briggs & Bowen, Reference Briggs and Bowen2012; Kulbicki et al., Reference Kulbicki, Parravicini, Bellwood, Arias-Gonzalez, Chabanet, Floeter, Friedlander, McPherson, Myers, Vigliola and Mouillot2013; Toonen et al., Reference Toonen, Bowen, Iacchei, Briggs and Kliman2016). This is a result of the fact that the vast majority of estuary-associated fishes are of marine origin (Elliott et al., Reference Elliott, Whitfield, Potter, Blaber, Cyrus, Nordlie and Harrison2007) and relatively few freshwater fish species are capable of surviving the salinity fluctuations that are characteristic of most estuaries (Whitfield, Reference Whitfield2015). Therefore, estuaries that are located in regions with rich marine ichthyofaunas invariably have species lists that are more extensive than those estuaries that are situated adjacent to seas with more species depauperate fish assemblages. Also, as has been shown in this study, estuarine fishes in tropical estuaries are, without exception, more diverse and richer in species than temperate fish assemblages associated with estuaries on the same continent.
The broad biogeographic groupings of ecoregions identified during this study can also be explained in terms of global palaeobiogeography. The Tethys Sea, which linked the Atlantic and the Indo-Pacific, represented a centre of origin of tropical species and facilitated the dispersal of taxa into these regions (Briggs, Reference Briggs1999, Reference Briggs2003; Cowman & Bellwood, Reference Cowman and Bellwood2013a). The Red Sea land bridge, which emerged ~12–18 Ma, closed the Tethys seaway and separated the tropical faunas of the Atlantic and Indo-Pacific regions (Barber & Bellwood, Reference Barber and Bellwood2005; Floeter et al., Reference Floeter, Rocha, Robertson, Joyeux, Smith-Vaniz, Wirtz, Edwards, Barreiros, Ferreira, Gasparini, Brito, Falcon, Bowen and Bernardi2008; Liu et al., Reference Liu, Li, Ugolini, Momtazi and Hou2018). However, the tropical fishes that had transitioned around the northern African coast during the Mesozoic and early Cenozoic, continued to evolve and give rise to different species within these families on either side of the continent (Whitfield, Reference Whitfield2005). Mixing of these new ‘geminate’ tropical species on the east and west coasts of Africa was prevented by land closure of the Mediterranean in the north and the development of a Benguela cold water upwelling system in the southern coastal region (Shannon, Reference Shannon and Barnes1985). For example, despite the high representation of Mugilidae on both the east and west coasts of Africa, the species of this family are now different across the tropical region of this continent (Whitfield, Reference Whitfield2005).
The extensive shallow waters and geological complexity of the Indo-Pacific promoted species survival, diversification and range extension from the east coast of Africa to islands in the central Pacific (Bender et al., Reference Bender, Pie, Rezende, Mouillot and Floeter2013; Cowman & Bellwood, Reference Cowman and Bellwood2013b). Simultaneously, there would have been colonization of the western Indian Ocean coastline by estuary-associated fish species from the Indo-Pacific region (Blaber, Reference Blaber1981). Indeed, the Indo-Australian Archipelago (IAA) represents a significant source of fish diversity globally (Briggs, Reference Briggs2003; Barber & Bellwood, Reference Barber and Bellwood2005; Cowman & Bellwood, Reference Cowman and Bellwood2013b). This is also represented in the results of this study where Indo-Pacific ecoregions formed a distinct broad grouping (Group H) and these ecoregions exhibited a high fish species richness.
It has been estimated that on a global scale, there are ~284 circumtropical marine fish species but, of these, only 50 (18%) are shallow-water taxa with a depth range of 200 m or less (Gaither et al., Reference Gaither, Bowen, Rocha and Briggs2016). The dispersal of neritic Indo-Pacific fauna eastwards is restricted by the vastness of the open Pacific Ocean (Cowman & Bellwood, Reference Cowman and Bellwood2013b), with the polar regions to the north and south being a barrier to tropical species potentially moving in this direction. Thus, the East Pacific Barrier (EPB) is a broad and deep stretch of open ocean lacking stepping-stone islands or atolls facilitating the dispersal of warm water biotas across biogeographic boundaries (Forderer et al., Reference Forderer, Rodder and Langer2018). Similarly, the Pacific Ocean would be a barrier to potential tropical estuary-associated species moving from the eastern to the western Pacific ecoregions.
In the eastern Pacific and western Atlantic regions, the closure of the Isthmus of Panama (IOP) ~2.8 Ma, separated the Atlantic/Caribbean region from the Tropical East Pacific (Lessios, Reference Lessios2008). The restriction of available shallow-water habitats together with the effect of the cold-water Peru and California currents has resulted in a relatively depauperate fauna within the Tropical East Pacific (Santini & Winterbottom, Reference Santini and Winterbottom2002; Lessios, Reference Lessios2008; Forderer et al., Reference Forderer, Rodder and Langer2018). Apart from the impact of IOP closure on the species richness of estuary-associated taxa in the Tropical East Pacific, the lack of potential recruits from the Tropical West Pacific would also have negatively influenced species richness in eastern Pacific estuaries. This study also reported a distinct grouping of ecoregions within the Tropical East Pacific (Group F) and these ecoregions were characterized by a relatively low species richness.
In the western Atlantic, the shallow-water habitat in the Caribbean made this region a centre of fish biodiversity (Briggs, Reference Briggs2003; Floeter et al., Reference Floeter, Rocha, Robertson, Joyeux, Smith-Vaniz, Wirtz, Edwards, Barreiros, Ferreira, Gasparini, Brito, Falcon, Bowen and Bernardi2008). This study also found that ecoregions in this area formed a broad grouping (Group G) and had a relatively high species richness. Thus, the extensive neritic zones and numerous islands of the tropical western Atlantic have promoted fish speciation in these waters, whereas the more restricted neritic zones of the tropical eastern Pacific and general absence of nearby islands, have limited the richness of this ecoregion.
The dispersal of tropical fauna between the West Atlantic and East Atlantic is impeded by the mid-Atlantic Barrier (MAB), which is a deep ocean barrier produced by the expanse of the Atlantic Ocean (Floeter et al., Reference Floeter, Rocha, Robertson, Joyeux, Smith-Vaniz, Wirtz, Edwards, Barreiros, Ferreira, Gasparini, Brito, Falcon, Bowen and Bernardi2008). As with the Tropical East Pacific, the tropical East Atlantic is constrained between the cold-water Benguela and Canary boundary currents in the south and north, respectively. Furthermore, during its more recent history, a large part of the original Tethyan fauna disappeared and was replaced by a more temperate fauna resulting in a closer affinity between the fauna of West Africa and that of the European Atlantic and Mediterranean (Le Loeuff & von Cosel, Reference Le Loeuff and von Cosel1998). This study supports that hypothesis and recorded a grouping of tropical East Atlantic ecoregions (Group E) that was more similar to temperate North-East Atlantic (European) ecoregions (Group D). Furthermore, the absence of a warm-temperate South-East Atlantic ichthyofauna in the north-east would have been due to a combination of low species richness and lack of warm-temperate estuaries in the south-east, as well as the inability of most southern temperate species to transition the tropical neritic waters of central Africa northwards.
In terms of temperate fauna, cooling during the Eocene/Oligocene, ~35 Ma, resulted in the establishment of cold-temperate conditions in the Arctic Ocean, North Pacific, North Atlantic and the Antarctic. New cold-temperate biotas, derived primarily from warm-temperate species that were able to adapt to the new environment, evolved rapidly (Briggs, Reference Briggs2007). Because temperate fish biotas are species poor when compared with tropical taxa, this results in the final fish assemblages associated with temperate estuaries always being less rich than tropical estuaries on the same continent.
The establishment of extensive ice sheets over northern hemisphere continents during global cooling in the past would have led to restricted estuarine functioning and major declines in river flow into cold temperate estuaries for prolonged periods each year (Morse et al., Reference Morse, Messier, Stander and Quach2002). In addition, even current cool temperate estuaries in North America, Europe and Asia would have been subject to extensive ice cover during the winter months. The consequences of these freezing conditions in many northern hemisphere estuaries would have had a direct influence on the fish species richness and diversity of such systems. Although the number of fish taxa occupying cool and cold temperate estuaries in this region may well increase under global warming scenarios (Nicolas et al., Reference Nicolas, Chaalali, Drouineau, Lobry, Uriarte, Borja and Boët2011), the cyclical freezing and warming over both short- and long-term climatic cycles would have an overall negative impact on species richness within high latitude systems. Similarly, the loss of glacial river flow during major global warming periods could adversely affect temperate anadromous fish species that rely on this freshwater source to provide connectivity between upper catchments and the sea (Nolan et al., Reference Nolan, Churchwell, Adams, McClelland, Tape, Kendall, Powell, Dunton, Payer and Martin2011).
In the North Pacific and North Atlantic, the new cold-temperate biotas evolved separately until the late Miocene, ~3.5 Ma, when marine connections across the Bering land bridge began to develop. The North Pacific has been identified as a major cold-temperate centre of origin (Briggs, Reference Briggs2007) and would therefore give rise to temperate coastal fish species with specific affinities to the northern waters of the Pacific and Atlantic. Support for this hypothesis is provided by this study which found that, based on estuary-associated fishes, ecoregions in the temperate North Pacific (Group C), temperate North-west Atlantic (Group B) and temperate North-east Atlantic (Group D) formed distinct broad groupings. All these groupings have a totally different composition from temperate ecoregions in the southern hemisphere and this reinforces the fact that most temperate coastal fish species appear to be unable to transition tropical waters across the hemispheres.
The biogeography of temperate areas in the southern hemisphere is closely linked to the break-up of the Gondwana supercontinent and the drift of the continental blocks of Antarctica, Australia, India, South America and Africa (Linse et al., Reference Linse, Griffiths, Barnes and Clarke2006). Cold-temperate waters in the southern hemisphere are widely dispersed and are restricted to the tip of South America and the Falkland Islands, Tasmania and Victoria in Australia, southern New Zealand and nearby islands, and the Sub-Antarctic (Briggs, Reference Briggs2007). This study also identified groupings of temperate ecoregions in southern South America (Group A) and southern Australia and New Zealand (Group I). Southern Africa only reaches ~34°S and coastal waters, with the exception of the Benguela upwelling zone, are much warmer than those around southern tips of South America and New Zealand. Furthermore, the vast Southern Ocean expanses between the continents in the southern hemisphere will tend to restrict any ichthyofaunal linkages between the neritic regions of South America, southern Africa and Australia/New Zealand.
Factors affecting global patterns in estuarine fish species richness (Vasconcelos et al., Reference Vasconcelos, Henriques, Franca, Pasquaud, Cardoso, Laborde and Cabral2015) and estuarine fish species composition (Henriques et al., Reference Henriques, Cardoso, Cardoso, Laborde, Cabral and Vasconcelos2017a) were investigated using a worldwide dataset that included over 300 estuaries. These studies found a strong relationship between estuary fish species richness and communities and biogeographic realm. This was related to the establishment of geographic barriers and temperature filters driving the evolutionary history of each region. Henriques et al. (Reference Henriques, Cardoso, Cardoso, Laborde, Cabral and Vasconcelos2017a) identified several estuarine groupings that broadly agreed with the large-scale marine realms identified by Spalding et al. (Reference Spalding, Fox, Allen, Davidson, Ferdana, Finlayson, Halpern, Jorge, Lourie, Martin, McManus, Molnar, Recchia and Robertson2007); however, considerable overlap existed between these estuary groupings and the extensive marine realms. This lack of agreement is probably a result of the data requirements of the studies and the paucity of estuary fish community data from certain realms; over 70% of the estuaries included in this dataset were restricted to Australia, Europe and South Africa, with few systems represented from other realms. Through the use of estuary-associated meta-assemblages, the present study represents an extensive and comprehensive global analysis of the biogeography of estuary-associated fishes.
This study also identified several sub-groupings of ecoregions that corresponded with established marine biogeographic provinces (Briggs & Bowen, Reference Briggs and Bowen2012; Kulbicki et al., Reference Kulbicki, Parravicini, Bellwood, Arias-Gonzalez, Chabanet, Floeter, Friedlander, McPherson, Myers, Vigliola and Mouillot2013; Toonen et al., Reference Toonen, Bowen, Iacchei, Briggs and Kliman2016). In addition, a decline in fish species richness from ecoregions in tropical biogeographic provinces to those in temperate provinces was confirmed. This was linked to a latitudinal decline in sea temperature as well as the occurrence of thermal barriers. A strong link was also observed between sea surface temperature and species richness and estuary fish communities by Vasconcelos et al. (Reference Vasconcelos, Henriques, Franca, Pasquaud, Cardoso, Laborde and Cabral2015) and Henriques et al. (Reference Henriques, Cardoso, Cardoso, Laborde, Cabral and Vasconcelos2017a). Ocean currents aid the dispersal of species from tropical regions to higher latitudes (e.g. Hare et al., Reference Hare, Churchill, Cowen, Berger, Cornillon, Dragos, Glenn, Govoni and Lee2002; Booth et al., Reference Booth, Figueira, Gregson, Brown and Beretta2007; Pearce & Hutchins, Reference Pearce and Hutchins2009); however, the decline in temperature towards higher latitudes limits the occurrence and distribution of tropical species. Furthermore, regions of upwelling and areas where warm poleward flowing currents meet cooler equatorial flowing waters serve as barriers to the occurrence and distribution of tropical species (e.g. Fukuta et al., Reference Fukuta, Kamimura, Hori, Nakaoka, Noda, Yamashita, Otake and Shoji2017). These barriers also typically coincide with the boundaries that delineate biogeographic regions.
Other variables responsible for global patterns in estuarine fish species richness and community composition included the abundance of estuaries (linked to continental rainfall regime) and connectivity with the sea (mouth condition, mouth width, tidal range) (Vasconcelos et al., Reference Vasconcelos, Henriques, Franca, Pasquaud, Cardoso, Laborde and Cabral2015; Henriques et al., Reference Henriques, Cardoso, Cardoso, Laborde, Cabral and Vasconcelos2017a). These factors contribute toward estuary typology, which determines the nature of the estuarine environment and hence the fish communities that utilize these habitats (Harrison & Whitfield, Reference Harrison and Whitfield2006). The nature and typology of estuaries varies regionally in relation to variations in climate (e.g. rainfall), and ocean conditions (e.g. tidal range). In a global study of intermittently closed/open lakes and lagoons, for example, McSweeney et al. (Reference McSweeney, Kennedy, Rutherfurd and Stout2017) found that these types of estuarine systems are concentrated along microtidal to low mesotidal coastlines in the mid-latitudes and predominantly on coasts with temperate climates. The geomorphological variability of estuaries in South Africa was also found to follow a broad pattern that reflected the regional variability in climate, topography and sediment availability (Cooper, Reference Cooper2001). In addition, Harrison (Reference Harrison2004) found that the physico-chemical characteristics of South African estuaries were related to the regional differences in climate, rainfall and ocean conditions. Regional variations in estuary typology in relation to climate and oceanographic regime has also been observed in estuaries in Australia (Kench, Reference Kench1999; Pease, Reference Pease1999) and the USA (Dame et al., Reference Dame, Alber, Allen, Mallin, Montague, Lewitus, Chalmers, Gardner, Gilman, Kjerfve, Pinckney and Smith2000; Emmett et al., Reference Emmett, Llanso, Newton, Thom, Hornberger, Morgan, Levings, Copping and Fishman2000). The biogeographic ecoregions identified during this study were also related to freshwater ecoregions (FEAS, 2021) and climate. Arid areas typically have few permanent rivers and coastal outlets that support estuarine habitats for fishes. These estuary poor areas can also act as barriers to the distribution and occurrence of estuary-associated fishes, particularly when an extensive coastline is devoid of suitable estuaries for occupation by fishes. An example of such a region is the entire Namibian and part of the southern Angolan coast where few estuaries exist due to desert conditions, resulting in a dearth of estuary-associated fish species within this temperate region (Whitfield, Reference Whitfield2005).
It should also be noted that fish speciation in estuaries is very limited (Whitfield, Reference Whitfield1994) and that species richness within estuaries is always going to be less than the ichthyofauna in the adjacent marine environment (Whitfield, Reference Whitfield1999). An examination of global fish species richness in neritic waters (Figure 1) reveals two major centres where diverse ichthyofaunas exist. The first and most important centre is the tropical Indo-Pacific region which extends over the entire region north of Australia, extending into north Asia and India. This high species richness has not been able to fully spread to the western Indian Ocean or the eastern Pacific regions for reasons already outlined in the discussion. Similarly, the second important centre in the tropical western Atlantic region has not been able to spread to the tropical eastern Atlantic region, again for the reasons outlined earlier. The extent to which current temperate estuary-associated ichthyofaunas originated or evolved in tropical waters is unknown – but the lack of species richness in cooler coastal waters around the world suggests that these regions were not centres of radiation for global fish assemblages.
Climate change may have a major influence on the future occurrence and distribution of estuary-associated fishes (Roessig et al., Reference Roessig, Woodley, Cech and Hansen2004; Gillanders et al., Reference Gillanders, Elsdon, Halliday, Jenkins, Robins and Valisini2011; James et al., Reference James, van Niekerk, Whitfield, Potts, Götz and Paterson2013). Increased rates of global warming would be expected to increase the biogeographic distribution of tropical ichthyofaunas (James et al., Reference James, van Niekerk, Whitfield, Potts, Götz and Paterson2013), with a decrease in the ranges of the more temperate fish species, especially where coastlines have an east/west orientation (Whitfield et al., Reference Whitfield, James, Lamberth, Adams, Perissinotto, Rajkaran and Bornman2016). In addition, increased desertification and change in ocean dynamics will have a pronounced effect on the occurrence, distribution and species richness of estuary-associated fishes. The present study represents the first, comprehensive global analysis of the biogeography of estuary-associated fishes based on meta-assemblages and may serve as a baseline against which future climate change impacts can be measured.
Supplementary material
The supplementary material for this article can be found at https://doi.org/10.1017/S0025315422000285
Acknowledgements
The authors would like to thank their respective employers, the Department of Agriculture, Environment and Rural Affairs (DAERA) and the South African Institute for Aquatic Biodiversity (SAIAB), a National Facility of the National Research Foundation (NRF), for their support during the writing of this paper. The authors would also like to thank Neil Armour, Georgia Gurney and Aoibheann Rooney (DAERA) for their GIS assistance.
Author contributions
TH & AW conceived the idea; TH collated and analysed the data; TH & AW wrote the manuscript.
Financial support
This research received no specific grant from any funding agency, commercial or not-for-profit sectors.
Conflict of interest
The authors declare no conflict of interests.
Data availability statement
The data used in this study were obtained from the Global Biodiversity Information Facility (https://www.gbif.org). Occurrence Download https://doi.org/10.15468/dl.72zk7d. Accessed from R via rgbif (https://github.com/ropensci/rgbif) on 25 November 2021.