





%20--%3e%3c!DOCTYPE%20svg%20PUBLIC%20'-//W3C//DTD%20SVG%201.0//EN'%20'http://www.w3.org/TR/2001/REC-SVG-20010904/DTD/svg10.dtd'%3e%3csvg%20version='1.0'%20id='Layer_1'%20xmlns='http://www.w3.org/2000/svg'%20xmlns:xlink='http://www.w3.org/1999/xlink'%20x='0px'%20y='0px'%20width='64px'%20height='64px'%20viewBox='5.5%20-3.5%2064%2064'%20enable-background='new%205.5%20-3.5%2064%2064'%20xml:space='preserve'%3e%3cg%3e%3ccircle%20fill='%23FFFFFF'%20fill-opacity='0'%20cx='37.785'%20cy='28.501'%20r='28.836'/%3e%3cpath%20fill='%23595959'%20d='M37.441-3.5c8.951,0,16.572,3.125,22.857,9.372c3.008,3.009,5.295,6.448,6.857,10.314%20c1.561,3.867,2.344,7.971,2.344,12.314c0,4.381-0.773,8.486-2.314,12.313c-1.543,3.828-3.82,7.21-6.828,10.143%20c-3.123,3.085-6.666,5.448-10.629,7.086c-3.961,1.638-8.057,2.457-12.285,2.457s-8.276-0.808-12.143-2.429%20c-3.866-1.618-7.333-3.961-10.4-7.027c-3.067-3.066-5.4-6.524-7-10.372S5.5,32.767,5.5,28.5c0-4.229,0.809-8.295,2.428-12.2%20c1.619-3.905,3.972-7.4,7.057-10.486C21.08-0.394,28.565-3.5,37.441-3.5z%20M37.557,2.272c-7.314,0-13.467,2.553-18.458,7.657%20c-2.515,2.553-4.448,5.419-5.8,8.6c-1.354,3.181-2.029,6.505-2.029,9.972c0,3.429,0.675,6.734,2.029,9.913%20c1.353,3.183,3.285,6.021,5.8,8.516c2.514,2.496,5.351,4.399,8.515,5.715c3.161,1.314,6.476,1.971,9.943,1.971%20c3.428,0,6.75-0.665,9.973-1.999c3.219-1.335,6.121-3.257,8.713-5.771c4.99-4.876,7.484-10.99,7.484-18.344%20c0-3.543-0.648-6.895-1.943-10.057c-1.293-3.162-3.18-5.98-5.654-8.458C50.984,4.844,44.795,2.272,37.557,2.272z%20M37.156,23.187%20l-4.287,2.229c-0.458-0.951-1.019-1.619-1.685-2c-0.667-0.38-1.286-0.571-1.858-0.571c-2.856,0-4.286,1.885-4.286,5.657%20c0,1.714,0.362,3.084,1.085,4.113c0.724,1.029,1.791,1.544,3.201,1.544c1.867,0,3.181-0.915,3.944-2.743l3.942,2%20c-0.838,1.563-2,2.791-3.486,3.686c-1.484,0.896-3.123,1.343-4.914,1.343c-2.857,0-5.163-0.875-6.915-2.629%20c-1.752-1.752-2.628-4.19-2.628-7.313c0-3.048,0.886-5.466,2.657-7.257c1.771-1.79,4.009-2.686,6.715-2.686%20C32.604,18.558,35.441,20.101,37.156,23.187z%20M55.613,23.187l-4.229,2.229c-0.457-0.951-1.02-1.619-1.686-2%20c-0.668-0.38-1.307-0.571-1.914-0.571c-2.857,0-4.287,1.885-4.287,5.657c0,1.714,0.363,3.084,1.086,4.113%20c0.723,1.029,1.789,1.544,3.201,1.544c1.865,0,3.18-0.915,3.941-2.743l4,2c-0.875,1.563-2.057,2.791-3.541,3.686%20c-1.486,0.896-3.105,1.343-4.857,1.343c-2.896,0-5.209-0.875-6.941-2.629c-1.736-1.752-2.602-4.19-2.602-7.313%20c0-3.048,0.885-5.466,2.658-7.257c1.77-1.79,4.008-2.686,6.713-2.686C51.117,18.558,53.938,20.101,55.613,23.187z'/%3e%3c/g%3e%3c/svg%3e)
%20--%3e%3c!DOCTYPE%20svg%20PUBLIC%20'-//W3C//DTD%20SVG%201.0//EN'%20'http://www.w3.org/TR/2001/REC-SVG-20010904/DTD/svg10.dtd'%3e%3csvg%20version='1.0'%20id='Layer_1'%20xmlns='http://www.w3.org/2000/svg'%20xmlns:xlink='http://www.w3.org/1999/xlink'%20x='0px'%20y='0px'%20width='64px'%20height='64px'%20viewBox='5.5%20-3.5%2064%2064'%20enable-background='new%205.5%20-3.5%2064%2064'%20xml:space='preserve'%3e%3cg%3e%3ccircle%20fill='%23FFFFFF'%20fill-opacity='0'%20cx='37.637'%20cy='28.806'%20r='28.276'/%3e%3cg%3e%3cpath%20fill='%23595959'%20d='M37.443-3.5c8.988,0,16.57,3.085,22.742,9.257C66.393,11.967,69.5,19.548,69.5,28.5c0,8.991-3.049,16.476-9.145,22.456%20C53.879,57.319,46.242,60.5,37.443,60.5c-8.649,0-16.153-3.144-22.514-9.43C8.644,44.784,5.5,37.262,5.5,28.5%20c0-8.761,3.144-16.342,9.429-22.742C21.101-0.415,28.604-3.5,37.443-3.5z%20M37.557,2.272c-7.276,0-13.428,2.553-18.457,7.657%20c-5.22,5.334-7.829,11.525-7.829,18.572c0,7.086,2.59,13.22,7.77,18.398c5.181,5.182,11.352,7.771,18.514,7.771%20c7.123,0,13.334-2.607,18.629-7.828c5.029-4.838,7.543-10.952,7.543-18.343c0-7.276-2.553-13.465-7.656-18.571%20C50.967,4.824,44.795,2.272,37.557,2.272z%20M46.129,20.557v13.085h-3.656v15.542h-9.944V33.643h-3.656V20.557%20c0-0.572,0.2-1.057,0.599-1.457c0.401-0.399,0.887-0.6,1.457-0.6h13.144c0.533,0,1.01,0.2,1.428,0.6%20C45.918,19.5,46.129,19.986,46.129,20.557z%20M33.042,12.329c0-3.008,1.485-4.514,4.458-4.514s4.457,1.504,4.457,4.514%20c0,2.971-1.486,4.457-4.457,4.457S33.042,15.3,33.042,12.329z'/%3e%3c/g%3e%3c/g%3e%3c/svg%3e)
1. Introduction
An accurate understanding of the dynamics of the shock wave/boundary layer interaction (SWBLI) is needed in many aerospace and aeronautical applications to predict, for example, flows around transonic airfoils, supersonic air intakes or deflected control surfaces of vehicles at transonic or supersonic speed. These interactions can lead to an increase of drag, to separation and to loss of performance. Moreover, shock wave/turbulent boundary layer interaction (SWTBLI) generally produces a low-frequency unsteadiness of the shock system. This unsteadiness can, for example, modify the thermal load or induce fatigue of the structure. It is well known that the flow separation may be at the origin of this unsteadiness in any regime, from the incompressible (Weiss, Mohammed-Taifour & Schwaab Reference Weiss, Mohammed-Taifour and Schwaab2015; Mohammed-Taifour & Weiss Reference Mohammed-Taifour and Weiss2016; Le Floc'h et al. Reference Le Floc'h, Weiss, Mohammed-Taifour and Dufresne2020) to the hypersonic (Gaitonde Reference Gaitonde2015; Priebe & Martín Reference Priebe and Martín2021), taking a particular form for compressible flows when the separation is induced by a shock wave. A considerable amount of work has been carried out to investigate the steady and unsteady aspects (see Gaitonde (Reference Gaitonde2015) for a review). Experimental research of the SWBLI started in the mid-1940s with the work of Ackeret, Feldmann & Rott (Reference Ackeret, Feldmann and Rott1947) and has shown a continuing interest since then. At this time, most of the experiments only measure steady aerodynamic quantities such as pressure distribution, skin friction and heat transfer rates. Detailed investigations of the phenomenon and its dependence on flow and boundary layer parameters have been already published by Adamson & Messiter (Reference Adamson and Messiter1980), Délery & Marvin (Reference Délery and Marvin1986) and Stanewsky (Reference Stanewsky1988).
It was only at the end of the 90s that the study of the dynamics of a SWTBLI was more systematically undertaken (Dolling Reference Dolling2001; Knight et al. Reference Knight, Yan, Panaras and Zheltovodov2003). It has been shown that the dynamics is rich, spanning several frequency decades. Two main length scales are at play: the vorticity thickness of the shear layer coming from the separated region and linked to the disturbances developing along the shear layer and, on a more global scale, the separation length  $L$ that is related to lower frequencies and is associated with the dynamics of the separation bubble (Dupont Reference Dupont2012; Gaitonde Reference Gaitonde2015). Three main frequency ranges can be identified. First, high frequencies, characterised by Strouhal numbers based on
 $L$ typically in the range of
 $St_L \geq 1$, are associated with the transitional or turbulent boundary layer dynamics (Bonne et al. Reference Bonne, Brion, Garnier, Bur, Molton, Sipp and Jacquin2019). Secondly, a vortex shedding resulting from the shear layer dynamics usually takes place at mid-frequency (
 $0.1 \leq St_L \leq 1$). This can be observed either in incompressible recirculation bubble (Weiss et al. Reference Weiss, Mohammed-Taifour and Schwaab2015; Mohammed-Taifour & Weiss Reference Mohammed-Taifour and Weiss2016) or in the SWBLI (Thomas, Putnam & Chu Reference Thomas, Putnam and Chu1994; Agostini et al. Reference Agostini, Larchêveque, Debieve, Dupont and Dussauge2012). Finally, a third dynamics is observed in the low-frequency range (
 $St_{L} < 0.1$) (Clemens & Narayanaswamy Reference Clemens and Narayanaswamy2014). This is the frequency domain we will mainly focus on from now on.
The low-frequency range has been intensely studied since the early 2000s in order to unveil its physical origin (Dussauge, Dupont & Debiève Reference Dussauge, Dupont and Debiève2006). Dupont et al. (Reference Dupont, Haddad, Ardissone and Debiève2005); Dupont, Haddad & Debiève (Reference Dupont, Haddad and Debiève2006) have shown that, for an interaction strong enough, low-frequency unsteadiness is observed around  $St_{L} \simeq 0.03$ and is characterised by oscillations of the separated shock (Dussauge et al. Reference Dussauge, Dupont and Debiève2006; Humble, Sacarano & van Oudheusden Reference Humble, Sacarano and van Oudheusden2009). Scenarios attempting to model this low-frequency dynamics have been devised. The first of them is related to the interaction of large structures upstream of the boundary layer with the shock leading to low-frequency response of the shock (Ganapathisubramani, Clemens & Dolling Reference Ganapathisubramani, Clemens and Dolling2007). However, Dussauge & Piponniau (Reference Dussauge and Piponniau2008) have shown that the influence of downstream conditions, especially in the recirculation zone, is more significant than the upstream conditions with respect to low frequencies when the interaction is strong. Piponniau et al. (Reference Piponniau, Dussauge, Debieve and Dupont2009) proposed a model based on a mass balance of the system ‘shear layer – separated zone’ where coherent structures in the shear layer feed the recirculation zone, which increases up to a critical size beyond which it empties, causing a breathing of the bubble and consequently the movement of separation of the shock (Agostini, Larchevêque & Dupont Reference Agostini, Larchevêque and Dupont2015). Touber & Sandham (Reference Touber and Sandham2011) furthermore characterised the system using a combination of theoretical and numerical model. They showed that the separated shock foot acts as a low-pass filter with respect to white noise. This result is in agreement with the linear interaction analysis (Ribner Reference Ribner1953; Robinet & Casalis Reference Robinet and Casalis2001) of the shock response to a harmonic infinitesimal perturbation.
The three-dimensional (3-D) dynamics resulting from the development of 3-D disturbances, independently of aspects strictly related to the effects of turbulence, has been studied more recently. Mainly three types of phenomena have been identified. When the upstream boundary layer is turbulent and the SWBLI weak (incipient separated zone), streaks from the upstream boundary layer and associated with longitudinal vortices can interact with the shock system (Ganapathisubramani et al. Reference Ganapathisubramani, Clemens and Dolling2007; Ganapathisubramani, Clemens & Dolling Reference Ganapathisubramani, Clemens and Dolling2009; Di Renzo et al. Reference Di Renzo, Oberoi, Larsson and Pirozzoli2022). However, when the SWBLI is strong enough to generate a significant separated zone, the latter can induce a streamline curvature of the boundary layer and initiate a centrifugal Görtler-like instability (Pasquariello, Hickel & Adams Reference Pasquariello, Hickel and Adams2017; Zhuang et al. Reference Zhuang, Tan, Li, Sheng and Zhang2018). When the SWBLI is sufficiently strong, the separated zone becomes three-dimensional and the emergence of a global non-oscillating instability can be observed. This characteristic is very general and can be observed from subsonic (Theofilis, Hein & Dallmann Reference Theofilis, Hein and Dallmann2000; Rodriguez & Theofilis Reference Rodriguez and Theofilis2010; Rodríguez, Gennaro & Souza Reference Rodríguez, Gennaro and Souza2021) to supersonic regime (Robinet Reference Robinet2007; Hildebrand et al. Reference Hildebrand, Dwivedi, Nichols, Jovanović and Candler2018). The role that these 3-D effects may play in the low-frequency unsteadiness remains, however, unclear.
From a numerical point of view, a substantial body of work has been done over the years, including direct numerical simulations and large eddy simulations. The works of Touber & Sandham (Reference Touber and Sandham2009a,Reference Touber and Sandhamb) and Pirozzoli & Bernardini (Reference Pirozzoli and Bernardini2011) made it possible for the first time to characterise the dynamics with reasonable statistical convergence, showing a very good agreement with Institut Universitaire des Systèmes Thermiques Industriels experiments (Dupont et al. Reference Dupont, Haddad and Debiève2006, Reference Dupont, Piponniau, Sidorenko and Debieve2008). In particular, these numerical studies also showed the broadband nature of the low-frequency dynamics. Priebe, Wu & Martin (Reference Priebe, Wu and Martin2009), for a reflected shock, and Wu & Martin (Reference Wu and Martin2008), for a compression ramp, detailed the low-frequency dynamics and recovered the scaling proposed in the literature. They also observed a large amplification of the turbulence through the SWTBLI. Priebe & Martin (Reference Priebe and Martin2012) for the compression ramp have studied the physical mechanism that drives the shock motion. In their simulations, the flow undergoes low-frequency changes of topology in the interaction region, including the breaking up of the recirculation bubble and the shedding of vortical structures. In addition, the growth of energetic turbulent structures in the shear layer was found to be modulated at low frequency. This could imply a modulation of the shear layer entrainment rate which is consistent with the scenario of Piponniau et al. (Reference Piponniau, Dussauge, Debieve and Dupont2009). These authors thus suggest that the low-frequency dynamics is related to the dynamics of the separated zone. Aubard, Gloerfelt & Robinet (Reference Aubard, Gloerfelt and Robinet2013) and Priebe & Martin (Reference Priebe and Martin2012) then showed that the dynamics of the separated zone occurs at medium frequency and is linked to Kelvin–Helmholtz instabilities in the shear layer and that the low-frequency dynamics is only a modulation of the latter and corresponds to the breathing of the separated zone.
Resolvent analysis, or resolvent-based modelling, has been intensively used in the fluid dynamics community in recent years. This approach is based on the singular value decomposition (SVD) of the resolvent operator that provides an optimal orthonormal basis for an external forcing (input) of the system and its associated linear response (output). The optimality is here defined as the way for a given energy input, at a given frequency, to force the system in order to trigger the largest possible energy growth. This is therefore particularly suited to the study of convective instabilities in noise amplifier flows. In such flows, ranges of frequency of external perturbations are amplified in space and time through linear mechanisms, while others are damped (Huerre & Monkewitz Reference Huerre and Monkewitz1990). Resolvent analysis was successfully applied, for example, to boundary layer (Åkervik et al. Reference Åkervik, Ehrenstein, Gallaire and Henningson2008; Sipp & Marquet Reference Sipp and Marquet2013) and jet (Nichols & Lele Reference Nichols and Lele2011; Garnaud et al. Reference Garnaud, Lesshafft, Schmid and Huerre2013) flows. Because non-modal effects are taken into account (Schmid Reference Schmid2007), algebraic instabilities like streaks or non-modal mechanisms such as the Orr mechanism can furthermore be modelled via this approach (Monokrousos et al. Reference Monokrousos, Åkervik, Brandt and Henningson2010). Resolvent analysis has also been intensively used in the modelling of turbulent flow since McKeon & Sharma (Reference McKeon and Sharma2010) noticed it could be used to identify coherent, large scale structures. While turbulence is a highly nonlinear phenomenon, the (linear) resolvent analysis yet captures the growth of these structures. The interpretation, and consequently the relevance of the resolvent analysis, is that nonlinear forcing terms, whose knowledge is not ultimately required here, provide background perturbations that grow into energetic coherent structures through linear mechanisms. Several authors later discussed the potential of the resolvent approach in reduced-order modelling of turbulent flows (Semeraro et al. Reference Semeraro, Jaunet, Jordan, Cavalieri and Lesshafft2016), noticing, in particular, the link between resolvent and spectral-proper orthogonal decomposition modes (Towne, Schmidt & Colonius Reference Towne, Schmidt and Colonius2018).
Resolvent analysis has been recently used to study the dynamics of the SWBLI. Sartor et al. (Reference Sartor, Mettot, Bur and Sipp2015) used a turbulent mean flow of a transonic SWBLI over a bump and compared it with their experimental results. They obtained similar features at low and medium frequencies, supporting the idea of a forced dynamics as their mean flow was found to be globally stable. Bonne et al. (Reference Bonne, Brion, Garnier, Bur, Molton, Sipp and Jacquin2019) studied a transitional case, in which they identified three ranges of frequencies and proposed a scenario for the low-frequency dynamics. In our paper, we focus exclusively on the low-frequency dynamics of the SWBLI, that we analyse by means of the resolvent analysis. Unlike the two papers cited above, a laminar base flow will be considered, for which similar features of the low-frequency dynamics can be observed (Yao & Sandham Reference Yao and Sandham2002; Boin et al. Reference Boin, Robinet, Corre and Deniau2006; Sandham et al. Reference Sandham, Schülein, Wagner, Willems and Steelant2014; Sansica, Sandham & Hu Reference Sansica, Sandham and Hu2014, Reference Sansica, Sandham and Hu2016). Our objective is first to understand to what extent a resolvent-based approach can model the behaviour of the SWBLI for this range of frequency, where the dynamics does not result from convective or global instabilities. This will also provide insights into the physics of the system that will be discussed. In particular, by conducting our analysis for different Mach and Reynolds numbers, we aim at characterising the scales involved in this dynamics. Besides, despite considering a laminar flow, this analysis could, to some extent, support the idea that the turbulent SWBLI has a forced dynamics at low frequency. Indeed, if the intrinsic forcing emanating from nonlinear interactions in the turbulent case reasonably projects onto the optimal forcing found in resolvent analysis, it is then possible to assume that a similar response will be found. All of the above will be carried out considering 2-D perturbations only, similarly to the two previously cited papers. The second objective is to explore the resolvent analysis of the SWBLI for 3-D perturbations for which, to our best knowledge, no work has been published. By 3-D perturbations, we mean that Fourier modes will be considered in the homogeneous spanwise direction, characterised by their wavenumber  $\beta$. The aim is to investigate the role that streaks or any 3-D effects may play in the low-frequency dynamics of the system.
The paper is structured as follows. The governing equations and the theoretical and numerical approaches are described in § 2. The methodology to generate the set of base flows under study is then detailed in § 3. In § 4, the resolvent analysis is carried out for 2-D perturbations on different base flows. A link with global stability analysis will be proposed, leading to a model of the optimal and sub-optimal gain obtained from the SVD of the resolvent operator. The scaling of key quantities will be shown, before discussing these results with respect to the literature. In § 5, 3-D perturbations will be considered in the resolvent analysis. Only one base flow will be studied, for which the newly obtained features of the dynamics will be classified into two regimes depending on their wavenumbers. This section ends with a discussion on the 3-D effects. A general conclusion can be found in § 6.
2. Theoretical and numerical approach
2.1. Governing equations
The compressible nonlinear Navier–Stokes equations are considered for the conservative variables  ${\boldsymbol {q}}=( \rho, \rho {\boldsymbol {u}},\rho E )^{T}$, where
 $\rho$,
 ${\boldsymbol {u}}$ and
 $E$ are the density, the velocity vector and the specific total energy, respectively. The components of the velocity vector are noted
 $u$,
 $v$ and
 $w$ in the streamwise direction
 $x$, the wall-normal direction
 $y$ and the spanwise direction
 $z$, respectively. The variables
 $T$,
 $p$,
 $\mu$,
 $\kappa$ and
 $\gamma$, standing for temperature, pressure, dynamic and kinematic viscosity, thermal conductivity and heat capacity ratio, are also introduced.
 $\boldsymbol{\mathsf{I}}$ is the identity tensor. All variables are non-dimensional using their value at infinity, except the pressure that is normalised by
 $\rho _\infty u_\infty ^2$. The reference length scale and time scale are
 $\delta _0^*$ and
 $\delta _0^*/u_\infty$, where
 $\delta _0^*$ is the compressible displacement thickness at a chosen streamwise location
 $x$, defined as
 $\delta _0^* = \int _0^\infty \{ 1 - \rho u/ (\rho _\infty u_\infty ) \} \,\mathrm {d} y$. More details on the choice of
 $\delta _0^*$ for our problem will be given in § 3.2. The governing equations read
 \begin{gather} \frac{\partial \rho}{\partial t}+\boldsymbol{\nabla}\boldsymbol{\cdot}\left(\rho {\boldsymbol{u}}\right)=0, \end{gather}
 \begin{gather} \frac{\partial }{\partial t}\left(\rho {\boldsymbol{u}}\right) + \boldsymbol{\nabla}\boldsymbol{\cdot}\left[\rho {\boldsymbol{u}}\otimes{\boldsymbol{u}} + p{\boldsymbol{\mathsf{I}}} -\frac{1}{Re}\boldsymbol{\tau}\right]=0, \end{gather}
 \begin{gather} \frac{\partial }{\partial t}\left(\rho E\right)+ \boldsymbol{\nabla}\boldsymbol{\cdot}\left[\left(\rho E+p\right){\boldsymbol{u}} - \frac{1}{Re}\boldsymbol{\tau}\odot{\boldsymbol{u}} -\frac{\kappa}{Pr Re (\gamma-1) M^2}\boldsymbol{\nabla} T\right]=0. \end{gather}
The fluid is assumed to be a perfect gas whose equation of states and total energy read
 \begin{equation} p = \frac{1}{\gamma M_\infty^2} \rho T ,\quad E = \frac{p}{\rho (\gamma-1)} + \frac{1}{2}{\boldsymbol{u}}\boldsymbol{\cdot}{\boldsymbol{u}}. \end{equation}
Furthermore assuming the fluid to be Newtonian, the viscous stress tensor verifies
 \begin{equation} \boldsymbol{\tau} = 2\mu\left[\boldsymbol{S}-\frac{1}{3}\mbox{Tr}\left(\boldsymbol{S}\right){\boldsymbol{I}}\right],\quad \mbox{with}\ \boldsymbol{S} = \frac{1}{2}\left[\boldsymbol{\nabla}\otimes{\boldsymbol{u}}+\left(\boldsymbol{\nabla}\otimes{\boldsymbol{u}}\right)^{T}\right] \end{equation}
Sutherland's law is used for the dynamic viscosity
 \begin{equation} \mu(T) = T^{3/2}\frac{1+T_s/T_\infty}{T+T_s/T_\infty}, \end{equation}
where  $T_s=110.4\,\mbox {K}$ and
 $T_\infty =288\,{\rm K}$. The thermal conductivity
 $\kappa$ is also assumed to follow Sutherland's law (Toro Reference Toro2013).
Three non-dimensional numbers have been introduced that control the flow:  $Re$,
 $M$ and
 $Pr$, the Reynolds, Mach and Prandtl numbers, respectively, defined as
 \begin{equation} Re = \frac{\rho_\infty u_\infty \delta_0^*}{\mu_\infty} ,\quad M= \frac{u_\infty}{c_\infty} ,\quad Pr = \frac{\mu_\infty c_p}{\kappa_\infty}, \end{equation}
where  $c_\infty$ is the speed of sound at infinity and
 $c_p$ the heat capacity. While
 $Pr$ is set to
 $Pr=0.72$ in order to model the fluid as air, the influence of
 $Re$ and
 $M$ will be studied. Note that a geometrical parameter
 $\phi$ will also be introduced. It is defined as the angle between the streamwise direction and the shock wave impinging the boundary layer.
Finally, (2.1) will be recast in the dynamical system form as
 \begin{equation} \displaystyle\frac{\partial {\boldsymbol{q}}}{\partial t} = {\mathcal{N}}({\boldsymbol{q}}), \end{equation}
where  ${\mathcal {N}}$ is the nonlinear differential operator of the Navier–Stokes equations.
2.2. Global stability
In this paper, the SWBLI is studied via two types of linear analysis. The linearised Navier–Stokes equations, considered in their semi-discrete form, are written as
 \begin{equation} \frac{\partial {\boldsymbol{q'}}}{\partial t} = \boldsymbol{\mathsf{J}} {\boldsymbol{q'}}, \end{equation}
where  $\boldsymbol{\mathsf{J}}$ and
 ${\boldsymbol {q'}}$ are the Jacobian matrix and the state-vector perturbations around the base flow
 ${\boldsymbol {\bar {q}}}$, respectively. The base flow
 ${\boldsymbol {\bar {q}}}(x,y)$ corresponds to a steady 2-D laminar solution of the nonlinear equations (2.1). A Fourier transform in both time and space (in the spanwise direction
 $z$) can then be performed, allowing the perturbations to be studied as the following global modes
 \begin{equation} {\boldsymbol{q'}}(x,y,z,t) = {\boldsymbol{\hat{q}}}(x,y) \exp({{\rm i} (\beta z-\omega t)}) + {\rm c.c.}, \end{equation}
with  $\omega$ the angular frequency and
 $\beta$ and the spanwise wavenumber. Considering
 $\omega \in \mathbb {C}$ and
 $\beta \in \mathbb {R}$, the global stability (Theofilis Reference Theofilis2011) of the system can be studied by solving the eigenvalue problem
 \begin{equation} -{\rm i} \omega {\boldsymbol{\hat{q}}} = \boldsymbol{\mathsf{J}} {\boldsymbol{\hat{q}}}. \end{equation}
If an eigenvalue is found such that the imaginary part of  $\omega$ is positive, then the flow is globally unstable. In this paper, only globally stable flows will be considered: if not externally sustained, any linear perturbations will eventually decay.
2.3. Resolvent analysis
Even though globally stable, flows such as boundary layer or mixing layer flow can exhibit convective instabilities (Huerre & Monkewitz Reference Huerre and Monkewitz1990). In such flows, termed noise amplifier flows, studying the linear forced dynamics is relevant to understand and model their behaviour. This can be achieved using resolvent analysis (Sipp et al. Reference Sipp, Marquet, Meliga and Barbagallo2010), which has been shown to provide a good model for convective instabilities over ranges of frequency where large energy growths take place (Sipp & Marquet Reference Sipp and Marquet2013). Besides, this approach gives the location and structure of the optimal harmonic forcing of the flow, i.e. the forcing field that triggers the largest energy growth. More generally, resolvent analysis provides a transfer function of the system, characterising the response to a forcing for each frequency (Schmid Reference Schmid2007).
The linear forced dynamics can be studied by introducing a harmonic forcing term  ${\boldsymbol {\hat {f}}}$ in (2.9) as
 \begin{equation} -{\rm i} \omega {\boldsymbol{\hat{q}}} = \boldsymbol{\mathsf{J}} {\boldsymbol{\hat{q}}} + {\boldsymbol{\hat{f}}}, \end{equation}
with  $\omega \in \mathbb {R}$, which now represents the forcing frequency that one wants to study. Introducing the resolvent matrix
 $\boldsymbol{\mathsf{R}} = ( -\omega \boldsymbol{\mathsf{I}} - \boldsymbol{\mathsf{J}} )^{-1}$, the relationship between any forcing and its linear response is then given by
 \begin{equation} {\boldsymbol{\hat{q}}} = \boldsymbol{\mathsf{R}} {\boldsymbol{\hat{f}}}. \end{equation}
One can now look for the forcing field that triggers the most energetic response by computing the optimal gain  $\sigma$ defined as
 \begin{equation} \sigma^2(\omega, \beta) = \max_{{\boldsymbol{\hat{f}}}} \frac{\| {\boldsymbol{\hat{q}}} \|_E^2}{\| {\boldsymbol{\hat{f}}} \|_F^2}. \end{equation}
Here, two norms must be introduced to measure the energy of the forcing and the response fields. The norm introduced by Chu (Reference Chu1965) is used for the response while the Euclidean norm is used for the forcing. More details can be found in Bugeat et al. (Reference Bugeat, Chassaing, Robinet and Sagaut2019). It can be shown that the optimal gain  $\sigma$ corresponds to the largest singular value of the resolvent matrix modified by the norm matrices (Sipp & Marquet Reference Sipp and Marquet2013). The associated optimal forcing and response are then the first left and right singular vectors, respectively. From (2.12),
 $\sigma$ can be seen as a transfer function as it measures the energy of the response with respect to that of an input forcing. In the following, the largest (or first) singular value will be called the optimal gain and will be referred to as
 $\sigma$ or
 $\sigma _1$ without any differences. The subsequent singular values
 $\sigma _2, \sigma _3,\ldots$ such that
 $\sigma _1 >\sigma _2 > \sigma _3 > \cdots$ are called sub-optimal gains and are associated with the subsequent singular vectors which form an orthonormal basis.
2.4. Numerical methods
2.4.1. Base flow computation
In order to get a 2-D steady base flow, the nonlinear Navier–Stokes equations (2.1) are solved using a finite volume computational fluid dynamics solver. Spatial discretisation of convective fluxes is performed using the advection upstream splitting method scheme (Liou Reference Liou1996) associated with a fifth-order monotone upstream-centered schemes for conservation laws extrapolation (Boin et al. Reference Boin, Robinet, Corre and Deniau2006). Viscous fluxes at cell interfaces are obtained by a second-order centred finite difference scheme. The unsteady equations are marched in time until a steady state is reached. An implicit dual time stepping method with local time step is used (Jameson Reference Jameson1991). More details about this solver and its validation can be found in Boin et al. (Reference Boin, Robinet, Corre and Deniau2006). A rectangular numerical domain is defined as in figure 1. The streamwise length  $L_x$ is set such that the distance between the impinging shock
 $x_{imp}$ and the outlet of the domain
 $x_{out}$ is
 $70 \delta _0^*$. The height
 $L_y$ is set such that the reflecting shock leaves the domain at the outlet boundary. This value depends on the physical case considered. In any case, the base flow eventually used in the stability and resolvent calculations is cropped to
 $L_y=50 \delta _0^*$. A Cartesian mesh is set with a geometrical progression from the wall. The number of points is
 $600 \times 270$ in the
 $x$ and
 $y$ directions, respectively. The independence of the results from the aforementioned numerical parameters is checked in Appendix A. The following boundary conditions are used. At the inlet, oblique shock conditions are imposed: for
 $y< y_{{shock}}$, a parallel flow is set using the Mach number at infinity while the corresponding downstream jump conditions are used for
 $y>y_{{shock}}$. The latter condition is also set at top boundary of the domain. Note that
 $y_{{shock}}$ is calculated after choosing the angle of the shock
 $\phi$ and the location of the impinging shock
 $x_{{imp}}$. At the outlet, variables are extrapolated from the inside of the domain. At the bottom, an adiabatic flat plate is considered with no-slip conditions imposed on the velocity.
Sketch of the numerical domain and typical structure of the oblique shock wave/boundary layer (OSWBLI).

2.4.2. Linear solvers
The global stability and resolvent analyses are based on the linearised Navier–Stokes equations, which revolve around the computation of the Jacobian matrix  $\boldsymbol{\mathsf{J}}$. In order to compute it, the discretised Navier–Stokes equation are linearised via a finite difference approximation (Mettot, Renac & Sipp Reference Mettot, Renac and Sipp2014). This is achieved by using the discrete residual
 $\mathcal {N}$ (2.6) of the nonlinear Navier–Stokes used in the base flow solver, ensuring numerical consistency between the base flow calculation and the linear solvers. The adaptation of this framework proposed by Bugeat et al. (Reference Bugeat, Chassaing, Robinet and Sagaut2019) for 3-D perturbations in base flows featuring one homogeneous direction is used. Exhaustive details of the resolvent calculation can also be found in Bugeat et al. (Reference Bugeat, Chassaing, Robinet and Sagaut2019) where, in particular, the boundary conditions, Chu's norm matrix for conservative variables and the Krylov subspace algorithm used to compute the singular values are fully described. A sponge zone of length
 $10 \delta _0^*$ is also implemented at the top and downstream boundaries of the domain using the approach described by Agarwal, Morris & Mani (Reference Agarwal, Morris and Mani2004). Finally, the PETSc (Balay et al. Reference Balay2021), SLEPc (Hernandez, Roman & Vidal Reference Hernandez, Roman and Vidal2005) and MUMPS (Amestoy et al. Reference Amestoy, Duff, L'Excellent and Koster2001) open libraries are called to compute the large scale linear systems and eigenvalues problems featuring sparse matrices.
3. Base flow
3.1. Validation
In order to validate the base flow calculation, the flow conditions are matched to those of the experimental investigation of Degrez, Boccadoro & Wendt (Reference Degrez, Boccadoro and Wendt1987). The free-stream Mach number is  $M = 2.15$ and the angle of the incident shock measured from the horizontal axis is
 $\phi = 30.8^\circ$ (corresponding to a flow deflection angle of
 $3.81^\circ$). The Reynolds number, based on the streamwise length from the leading edge at which the shock impinges the flat plate, is
 $Re_x = 0.96 \times 10^5$. Comparisons with the experimental results reported by Degrez et al. (Reference Degrez, Boccadoro and Wendt1987) are displayed in figure 2. This shows that our simulation is in good agreement with experimental data, both in terms of wall pressure measurements and location of the separation bubble.
Validation against the experimental data from Degrez et al. (Reference Degrez, Boccadoro and Wendt1987). (a) Wall pressure normalised by the minimum pressure  $p_0$ upstream from the shock. (b) Skin friction coefficient
 $c_f$. The blue squares correspond to the experimental separation and reattachment points.

3.2. Set of base flows studied
A set of base flows is computed in order to carry out stability and resolvent analyses for different separation lengths  $L$. Different Mach numbers are considered, ranging from
 $2.00$ (incipient separation) to
 $2.35$ (large separation length compared with the boundary layer length scale). First, the Reynolds number
 $Re$, based on the compressible boundary layer thickness
 $\delta ^*_0$ at which the shock impinges the plate, is kept constant at
 $Re=1100$ using the following protocol. For each Mach number, a boundary layer base flow is first computed without the impinging shock. At each
 $x$-location,
 $\delta ^*$ is then calculated by integrating the quantity
 $1 - (\rho u) / (\rho _\infty u_\infty )$ in the normal direction. This allows us to detect the
 $x$-location where
 $Re=1100$ and to use it as an input in a second base flow computation with a shock impinging at this point. Thus, the reference length scale
 $\delta ^*_0$ corresponds to the boundary layer thickness at the location of the impinging shock but prior to the shock interaction. In other words, it is not the effective thickness resulting from the shock interaction. The velocity field obtained at
 $M=2.20$ and
 $Re=1100$, which will be used as the reference case, is shown in figure 3. By increasing the Mach number, the pressure gradient felt by the boundary layer is increased. The separation length
 $L/\delta _0^*$ is readily computed by detecting the separation and reattachment points along the plate, which are the locations where
 $\partial u/\partial y$ at the wall becomes negative and positive again, respectively. The separation length
 $L/\delta _0^*$ is found very sensitive to
 $M$ as its value increases over more than one order of magnitude for the Mach numbers considered in table 1. In order to assess the role of viscous effects in the low-frequency receptivity of the SWBLI, different Reynolds numbers are also considered, ranging from 600 to 2200. For one given Mach number, this corresponds to different
 $x$-locations at which the shock impinges. Note that because
 $\delta ^* \sim \sqrt {x}$, this location varies over a wide range of values, e.g. by a factor 10 at
 $M=2.20$ for which the maximum value of
 $Re$ considered is 1900. As shown in table 1, increasing
 $Re$ leads to increasing the recirculation bubble as there is less streamwise momentum near the wall to resist the pressure gradient generated by the shock. Finally, note that the angle of the shock is kept constant at
 $\phi = 30.8^{\circ }$ for all the computations presented in this paper.
Local Mach number of the base flow at  $M=2.20$,
 $Re=1100$.

Set of base flows studied with the length of the separation region  $L$ obtained in each case.

4. Linear dynamics of 2-D perturbation at low frequency
4.1. Resolvent analysis: optimal forcing and response
4.1.1. Results
The optimal gain is computed for different frequencies at  $M=2.20$ and
 $Re=1100$ (figure 4). At low frequency (
 $St_{L} < 10^{-1}$), the optimal gain monotonically decreases. The resolvent modes at
 $St_{L} = 10^{-4}$ are shown in figure 5. The optimal forcing is spread over a large portion of the domain, admitting maxima near the separation point and along the right part of the recirculation bubble. The optimal response is concentrated above the bubble, following its shape. Moreover, even though a drop of optimal gain is observed at low frequency, the optimal forcing and response vectors are found independent of the forcing frequency: the same velocity and pressure fields are observed at any low Strouhal numbers. Noticeable differences start to appear for frequencies above
 $St_{L} \simeq 2 \times 10^{-2}$. An interpretation will be proposed in § 4.1.3. At higher frequencies, a maximum of optimal gain is detected at
 $St_{L} \simeq 2$ (figure 4). It is associated with a convective instability that starts developing in the recirculation region and continues to grow further downstream in the boundary layer (figure 6). This is reminiscent of the first mode instability of the supersonic boundary layer, which is the compressible counterpart of the Tollmien–Schlichting instability in incompressible boundary layers (Mack Reference Mack1984). In order to efficiently trigger this instability, the optimal forcing is located upstream. Its tilted structure shows the concurrent action of the non-modal Orr mechanism, as usually observed in boundary layer flows (Ehrenstein & Gallaire Reference Ehrenstein and Gallaire2008; Bugeat et al. Reference Bugeat, Chassaing, Robinet and Sagaut2019).
Optimal gain at  $M=2.20$,
 $Re=1100$.

Resolvent mode 1 at  $St=10^{-4}$, real part of the streamwise velocity. (a) Forcing. (b) Response.

Resolvent mode 1 at  $St=2$, real part of the streamwise velocity. (a) Forcing. (b) Response.

4.1.2. Global stability analysis
A global stability computation is performed for the set of base flows described in § 3.2. The eigenvalue spectrum at  $M=2.20$ and
 $Re=1100$ is presented in figure 7. Each eigenvalue has a negative growth rate
 $\omega _i$, meaning that the system is globally stable. This has also been verified for all the base flows considered in this study. The two least stable modes are found to be steady (S1 and S2,
 $St_{L}=0$) while the third and fourth modes are unsteady (T1 and T2,
 $St_{L} \ne 0$). Subsequent modes at higher frequency feature even larger damping rate. The velocity field of the mode S1 is mostly localised around the recirculation bubble, following its shape (figure 8a). The mode T1 shares common characteristics but features a phase opposition between the upstream and downstream region of the bubble (figure 8b).
Global stability spectrum at  $M=2.20$,
 $Re=1100$. Steady and unsteady modes are referred to with the letters S and T, respectively.

Global modes S1 (a) and T1 (b), real part of the streamwise velocity.

The striking outcome of this global stability analysis is that the least stable global mode S1 is very similar to the optimal response found in the resolvent analysis in the previous section (figure 5b), which was observed for any low frequencies. This means that, at low frequency, the optimal response results from the excitation of the least stable global mode. These results suggest that the receptivity at low frequency is a modal phenomenon, as opposed to the non-modal mechanisms usually observed in convective instabilities (Cossu & Chomaz Reference Cossu and Chomaz1997). Note that, because the system is stable, a continuous forcing is required to excite the flow around its base state.
It may appear somewhat unsettling that the receptivity, which pertains to the unsteady behaviour of the system, seems to be driven by a steady mode. This observation is analysed in the next section.
4.1.3. A low-pass filter model
To clarify how a steady mode could play a role in the low-frequency dynamics of the system, a model based on global stability analysis is proposed to describe the behaviour of the optimal gain. Two sources can cause the singular values of the resolvent operator to increase (Schmid Reference Schmid2007). The first one appears when the forcing frequency is close to the eigenvalues of the Jacobian matrix (as found by a stability analysis). The second source is related to the non-normality of the eigenvectors of the Jacobian matrix (i.e. the global modes). It is now well known that the linear superposition of stable modes can lead to energy growth (Farrell Reference Farrell1988), termed non-modal growth (Schmid & Henningson Reference Schmid and Henningson2001). This idea is translated, in the resolvent framework, into the concept of pseudo-resonance through which increases of optimal gain can occur away from the frequencies of the eigenmodes (see for example Bucci et al. Reference Bucci, Puckert, Andriano, Loiseau, Cherubini, Robinet and Rist2018).
From the insight obtained from the previous stability analysis (§ 4.1.2), we would like to test if the optimal gain proceeds from purely modal effects. Thus, non-modal phenomena are here discarded from the model. Furthermore, if one and only one global mode drives the optimal gain, then the singular value of the resolvent should vary as  $\sigma \sim 1/d$, where
 $d$ is the distance in the complex plane between the forcing frequency
 $St_{L}$ and the eigenvalue
 $\omega / 2{\rm \pi} = ( \omega _r + {\rm i} \omega _i )/ 2{\rm \pi}$ of this global mode. This distance is readily obtained as
 \begin{equation} d = \sqrt{\left( St_{L} - \omega_r/2{\rm \pi} \right)^2 + \left( \omega_i/ 2{\rm \pi} \right)^2}. \end{equation}
Because of the resemblance previously observed between the optimal response and the global mode S1, this mode is a natural candidate to test the purely modal receptivity model. Its eigenvalue is then plugged into (4.1). Since this mode is steady ( $\omega _r=0$), the low-frequency model of the optimal gain can eventually be recast as
 \begin{equation} \sigma (St_{L}) = \frac{\sigma_0}{\sqrt{1+ \left( \dfrac{St_{L}}{\omega_i^{(S1)}/2 {\rm \pi}} \right)^2}}, \end{equation}
where  $\sigma _0 = \lim _{St_{L} \to 0} \sigma (St_{L})$ is the value of the optimal gain when
 $St_{L}$ goes zero. Here,
 $\sigma _0$ is not predicted a priori by the model, but is obtained by one computation of the optimal gain at zero frequency (or any small frequency where the optimal gain experiences a plateau). But since the absolute value of the optimal gain ultimately carries little significance (Sipp & Marquet Reference Sipp and Marquet2013), this value is not essential to this model. The aim of this model is rather to detect the drop of optimal gain in order to analyse low-frequency receptivity of the system. It can be recognised that (4.2) is that of a first-order low-pass filter. The optimal gain being by definition analogous to a transfer function (see (2.12)), describing its behaviour as a filter is consistent.
In (4.2), the cutoff frequency is given by the damping rate  $\omega _i^{(S1)}$ of the global mode S1, which is the least stable global mode. Even though this mode is steady, a harmonic forcing of non-zero frequency is still able to excite it. When the forcing frequency
 $St_{L}$ goes to zero, the gain does not depend on the frequency as the distance in the complex plane
 $d$ tends to the constant value
 $|\omega _i^{(S1)}/2{\rm \pi} |$. However, increasing
 $St_{L}$ until the order of
 $\omega _i^{(S1)}/2{\rm \pi}$ and above affects the value of the optimal gain that then decreases as the forcing frequency is pushed away from the eigenvalue of the global mode it excites. Thus, the time scale appearing in this low-pass filter model is not set by the frequency of the global mode (which would be zero here), but by its damping rate.
4.1.4. Test of the model for different Mach and Reynolds numbers
The optimal gain model proposed in (4.2) is tested for different Mach and Reynolds numbers. Setting  $Re=1100$, three Mach numbers are considered:
 $M=2.10$,
 $M=2.20$ and
 $M=2.30$, with separation lengths ranging from
 $22 \delta _0^*$ to
 $88 \delta _0^*$ (table 1). Figure 9 shows that the low-pass filter model accurately detects the drop of optimal gain that appears between
 $St_{L}=10^{-3}$ and
 $10^{-2}$. In other words, the cutoff frequency is correctly predicted by the damping rate of the global mode S1. This is observed for every Mach numbers. Disagreements appear above
 $St_{L} \simeq 2 \times 10^{-2}$, where the low-pass filter underestimates the actual gain. At these frequencies, the structure of the optimal response starts to change. This means that the global mode S1 does not drive the dynamics of the flow alone any longer, but that other modes are getting involved.
Comparison between the optimal gain (red squares) and the low-pass filter model from (4.2) (blue line) for different Mach numbers ( $Re=1100$).

Other Reynolds numbers, below and above the previous value  $Re=1100$, are considered while keeping
 $M=2.2$. Below
 $Re=1100$, the same agreement as previously described is observed (figure 10). As the Reynolds number increases (
 $Re=1600$), discrepancies start to appear for smaller frequencies than
 $St_{L}=10^{-2}$ but the location of the drop of optimal gain is still correctly captured. At
 $Re=1900$, the model becomes irrelevant. The growing mismatch between the low-pass filter model and the optimal gain as
 $Re$ is increased can be caused by the action of other modes, previously damped by viscous effects. As a result, the model based on the excitation of the global mode S1 alone cannot predict the optimal gain anymore, even though this mode does not directly depend on viscous effect (in the next section, it will be shown that the global mode S1 is independent of the viscous length scale
 $\delta _0^*$).
Comparison between the optimal gain (red squares) and the low-pass filter model from (4.2) (blue line) for different Reynolds numbers ( $M=2.20$).

4.1.5. Scaling
The low-pass filter model in (4.2) contains the damping rate  $\omega _i^{(S1)}$ of the mode S1. This parameter sets the unique time scale of the model. Its scaling relative to a reference length scale is now investigated. The non-dimensional damping rate
 $\omega _i^{(S1)}$ is presented in figure 11 as a function of the non-dimensional length of the recirculation bubble
 $L/\delta _0^*$. Note that each point is associated with a different pair of Reynolds and Mach numbers (see table 1). It is found that
 $\omega _i^{(S1)} \delta _0^* / u_\infty \sim (L/\delta _0^*)^{-1}$, meaning that
 $\omega _i^{(S1)} \sim u_\infty /L$. Because several Reynolds numbers (based on several
 $\delta _0^*$, as explained in § 3.2) have been tested, this result ensures that
 $\omega _i^{(S1)}$ is independent of
 $\delta _0^*$. Instead, the recirculation length
 $L$ is the relevant length scale. The aforementioned scaling furthermore shows that the associated Strouhal number
 $St_{L}$, based on the the separation length, is then constant. Previous works investigating the low-frequency behaviour of the SWBLI have consistently noted a constant Strouhal number from
 $St_{L} \simeq 3 \times 10^{-2}$ to
 $St_{L} \simeq 6 \times 10^{-2}$ (Dussauge et al. Reference Dussauge, Dupont and Debiève2006). To compare our results with this value,
 $\omega _i^{(S1)}$ can be translated into a Strouhal number using
 $St_{L} = {f L}/{u_\infty } = ({ \omega ^{(S1)} \delta _0^*}/{2 {\rm \pi}u_\infty }) ({L}/{\delta _0^*})$, leading to values around
 $St_{L} \simeq 1 \times 10^{-2}$. While of the same order of magnitude as the data of the literature, the cutoff frequency is slightly underestimated. This motivates to push the resolvent analysis a step further by looking at the sub-optimal modes.
Damping rate of the global mode S1 for different Mach and Reynolds numbers (see table 1), as a function of the separation length. Here,  $\delta _0^*$ is the boundary layer thickness at
 $Re=1100$ rather than that at each Reynolds number.

4.2. Resolvent analysis: sub-optimal forcing and response
4.2.1. Results
So far, only the optimal gain  $\sigma _1$ and its associated forcing and response modes have been considered. Subsequent singular values of the resolvent operator
 $\sigma _2$ and
 $\sigma _3$, with
 $\sigma _1 > \sigma _2 > \sigma _3$ (i.e. sub-optimal gains), are now computed. Figure 12 compares these three gains as a function of the forcing frequency. At low frequency, a factor of approximately three is observed between
 $\sigma _1$ and
 $\sigma _2$, and approximately two between
 $\sigma _2$ and
 $\sigma _3$. A drop of sub-optimal gains occurs at higher frequencies that those noted for
 $\sigma _1$. In particular, the decrease of
 $\sigma _2$ is observed at Strouhal numbers between
 $10^{-2}$ and
 $10^{-1}$. These values lie in the range of the experimental data of the low-frequency unsteadiness more closely than those of
 $\sigma _1$. Our attention will then be focused on the behaviour of
 $\sigma _2$ and its associated modes at low frequencies. The forcing mode follows the shape of the recirculation bubble but is mostly concentrated around the separation point as shown in figure 13(a). Unlike the optimal forcing in figure 5(a), the phase varies in the normal direction. This is also the case of the associated response (figure 13b), whose phase varies in the streamwise direction. Finally, as previously observed for
 $\sigma _1$, the sub-optimal modes associated with
 $\sigma _2$ do not depend on
 $St_{L}$ in the low-frequency domain. This could suggest that the sub-optimal gain is also based on a modal excitation. In the next section, this possibility is discussed by reconsidering the first-order low-pass filter model.
Optimal and sub-optimal gains at  $M=2.20$ and
 $Re=1100$.

Resolvent mode 2 at  $St_{L}=10^{-4}$, real part of the streamwise velocity. (a) Forcing. (b) Response.

4.2.2. Sub-optimal gain: another low-pass filter
The response mode associated with  $\sigma _2$ (figure 13b) shares some features with the unsteady global mode T1 (figure 8b) computed in § 4.1.2. Besides, the low-frequency behaviour of
 $\sigma _2$ as a function of
 $St_{L}$ is similar to that of
 $\sigma _1$, the drop of gain being shifted to higher frequencies. It is then tempting to build a model of
 $\sigma _2$ based on the resonance of the global mode T1, derived from the distance in the complex plane between the real forcing frequency and its eigenvalue. However, because this mode is unsteady, a resonance model would lead to a peak of gain at the frequency of the mode T1 and a decrease of the gain as the frequency goes to zero. These two features are not observed in
 $\sigma _2$ (figure 12). Such a resonance model is then doomed to fail.
Instead, (4.2), which is that of a first-order low-pass filter, satisfies the observation of  $\sigma _2$ at low frequency. Therefore, we suggest using this equation to model
 $\sigma _2$ by plugging in the damping rate of the mode T1 instead of the mode S1 given its resemblance with the response mode associated with
 $\sigma _2$. This equation becomes
 \begin{equation} \sigma_2 (St_{L}) = \frac{\sigma_{2,0}}{\sqrt{1+ \left( \dfrac{St_{L}}{\omega_i^{(T1)}/2 {\rm \pi}} \right)^2}}. \end{equation}
As previously mentioned, this approach is different from an approach based on the pure resonance of the global mode T1; instead, we only assume that the damping rate of this mode is the relevant time scale at play. The ‘purely modal dynamics’ interpretation elaborated for  $\sigma _1$ (see § 4.1.3) then no longer holds. Other modes, either by normal or non-normal effect, are understood to also contribute to the low-frequency dynamics. This is furthermore expected as the response mode of
 $\sigma _2$ is actually not strictly identical to the mode T1.
This model is tested for the same set of base flow as previously investigated. At  $Re=1100$, the location of the drop of the sub-optimal gain
 $\sigma _2$, observed shortly after
 $St_{L} = 10^{-2}$, is captured for the three Mach numbers considered as seen in figure 14. This means that the cutoff frequency of the low-pass filter, based on the damping rate of the global mode T1, is indeed relevant. The slope of the drop is also predicted by the first-order filter until
 $St_{L}= 10^{-1}$, except for
 $M=2.10$ for which the behaviour of
 $\sigma _2$ changes at lower frequencies. Now setting
 $M=2.20$, the agreement of the cutoff frequency is also correctly captured for Reynolds numbers lower than or equal to
 $Re=1100$ (figure 15). At higher Reynolds number, the model over-estimates this frequency while still reasonably characterising the behaviour at
 $Re=1600$. For
 $Re=1900$, the model completely fails (figure 15c,d), as already noted for
 $\sigma _1$.
Comparison between the sub-optimal gain  $\sigma _2$ (red squares) and the low-pass filter model in (4.3) (blue line) for different Mach numbers (
 $Re=1100$).

Comparison between the sub-optimal gain  $\sigma _2$ (red squares) and the low-pass filter model in (4.3) (blue line) for different Reynolds numbers (
 $M=2.20$).

4.2.3. Scaling
The damping rate  $\omega _i^{(T1)}$ of the global mode T1 has been shown to capture reasonably well the low-frequency drop of
 $\sigma _2$. Its scaling is considered by plotting its value against the non-dimensional separation length for the set of Reynolds and Mach numbers studied (figure 16). Similarly to § 4.1.5, the damping rate is found to scale with
 $u_\infty /L$ since
 $\omega _i^{(T1)} \delta _0^* / u_\infty \sim (L/\delta _0^*)^{-1}$. This again means that the Strouhal number
 $St_{L}$ associated with the cutoff frequency is constant for any Mach and Reynolds numbers. Its value is found around
 $St_{L} \simeq 4 \times 10^{-2}$, in good agreement with the range of experimental data of the low-frequency unsteadiness. Before discussing the implication of this result, the bubble dynamics is studied in the next subsection.
Damping rate of the global mode T1 for different Mach and Reynolds numbers (see table 1), as a function of the separation length. Here,  $\delta _0^*$ is the boundary layer thickness at
 $Re=1100$ rather than that at each Reynolds number.

4.3. Bubble dynamics
The first and second resolvent modes are now compared from the perspective of the bubble dynamics. In order to observe its motion, one response mode at one chosen frequency is linearly added to the base flow. The frequency considered here is  $St_{L}=10^{-3}$ but its value is actually not important since, as previously mentioned, the resolvent modes do not depend on
 $St_{L}$ at low frequency. Snapshots at six different time steps of a periodic cycle, i.e. six different phases, are shown in figure 17. In each case, the distorted recirculation bubble is shown. It corresponds to the location in space where the total streamwise velocity is zero, calculated as
 $\bar {u} + A \hat {u} = 0$. The scalar
 $A$ is an arbitrary amplitude chosen as
 $A=0.3$ to ease visualisation. The undistorted bubble of the base flow (
 $\bar {u}=0$) is also plotted as a reference. The optimal resolvent mode, associated with
 $\sigma _1$, produces a breathing motion: the bubble periodically contracts and expands relative to the basic state (figure 17a,c,e,g,i,k). This dynamics is similar to the bubble motion found in the model of the low-frequency unsteadiness developed by Piponniau et al. (Reference Piponniau, Dussauge, Debieve and Dupont2009). The dynamics produced by the sub-optimal mode, shown in figure 17(b,d,f,h,j,l), is different. The bubble is now periodically displaced upstream and downstream from the reference state. No displacement is observed in the wall-normal direction.
Bubble dynamics at  $M=2.20$ and
 $Re=1100$ resulting from the addition of the optimal (a,c,e,g,i,k) and sub-optimal (b,d,f,h,j,l) low-frequency resolvent modes to the base flow. The blue dashed line is the distorted recirculation bubble corresponding to the location where
 $\bar {u}+A \hat {u}=0$ (using
 $A=0.3$). Its evolution at 6 different phases of a periodic cycle is shown from top to bottom. The red line is the recirculation bubble of the base flow (
 $\bar {u}=0)$.

4.4. Discussion
In their review paper, Clemens & Narayanaswamy (Reference Clemens and Narayanaswamy2014) ended their discussion on whether the SWBLI behaved as a forced dynamical system at low frequency. Our resolvent analysis supports the idea that, indeed, the low-frequency behaviour results from a forced dynamics, as opposed to an intrinsic dynamics such as that of a vortex street behind cylinder. From the resemblance between their dynamic mode decomposition and stable global stability modes, Nichols et al. (Reference Nichols, Larsson, Bernardini and Pirozzoli2017) suggested that the system could then be seen as a damped oscillator. Our study brings some new lights to this idea by showing that one stable global mode drives the resolvent analysis at low frequency. The fact that the optimal gain follows a first-order low-pass filter equation is furthermore consistent with the work of Touber & Sandham (Reference Touber and Sandham2011) who were the first to model the low-frequency dynamics of the SWBLI as a filter of this kind. From this perspective, the dynamics requires a range of low frequencies that force the system and are filtered by the transfer function which, in the resolvent framework, is related to the singular values of the resolvent operator. Therefore, while carried out in the laminar regime, our analysis provides insights that the SWBLI in the turbulent regime could possess a forced dynamics at low frequency, in which fluctuations over a wide range of scales would force the flow (McKeon & Sharma Reference McKeon and Sharma2010) and sustain its low-frequency behaviour. This would explain why low-frequency unsteadiness is observed in the turbulent regime rather that the laminar regime unless the latter is externally forced as in Sansica et al. (Reference Sansica, Sandham and Hu2014). In the present study, because resolvent analysis assumes by nature the presence of a forcing field, the low-frequency behaviour of the system can be qualitatively recovered even though the flow is laminar.
For both the optimal and sub-optimal gain, the damping rate of one stable global mode provides the time scale of the low-pass filter (the cutoff frequency). These frequencies scale as  $(L_{{sep}} / u_\infty )^{-1}$, which was expected as these modes are related to the bubble dynamic. This results in a constant cutoff Strouhal number
 $St_{L}$ for any Mach and Reynolds numbers. This scaling is indeed observed both experimentally and numerically for different configurations of SWBLI, with frequencies reported from
 $St_{L} \simeq 3 \times 10^{-2}$ to
 $St_{L} \simeq 6 \times 10^{-2}$ (Dussauge et al. Reference Dussauge, Dupont and Debiève2006). With values presently found around
 $St_{L}^{(1)} \simeq 1 \times 10^{-2}$ and
 $St_{L}^{(2)} \simeq 4 \times 10^{-2}$ for the optimal and sub-optimal gains, respectively,
 $St_{L}^{(2)}$ compares more favourably with the literature. However, the dynamics of the bubble of the optimal mode is, on the one hand, related to a breathing motion that strongly resembles that at play in the low-frequency unsteadiness of the SWBLI (Piponniau et al. Reference Piponniau, Dussauge, Debieve and Dupont2009; Clemens & Narayanaswamy Reference Clemens and Narayanaswamy2014). It is also strikingly similar to that observed experimentally in a turbulent incompressible recirculation bubble (Weiss et al. Reference Weiss, Mohammed-Taifour and Schwaab2015), also occurring at Strouhal numbers of the order of
 $10^{-2}$. On the other hand, the sub-optimal mode that produces a very different type of motion, which is expected given the orthogonality of the resolvent modes. The resulting bubble motion is similar to that obtained by Nichols et al. (Reference Nichols, Larsson, Bernardini and Pirozzoli2017) in their global stability analysis; this is indeed the same unsteady stable mode. However, no conclusive element allows us to link it to the low-frequency behaviour reported in the literature. This leads us to hypothesize that the optimal (rather than sub-optimal) gain and modes, associated with the bubble breathing, indeed describe the low-frequency dynamics of the SWBLI. The fact that
 $St_{L}^{(1)}$ is underestimated in the present study may be due to the laminar nature of the SWBLI understudied while results in the literature usually deal with turbulent SWBLI. The shape of the bubbles being different between laminar and turbulent regimes this could account for the quantitative mismatch. Finally, while the range of values of separation length studied in the present work is large enough to characterise the scaling of the low-frequency time scale, the Mach number is restricted to a small range around
 $M = 2.20$. Similar analyses carried out at much different Mach numbers are then still needed to assess the universality of these findings.
The larger the gain separation  $\sigma _1 / \sigma _2$ between the optimal and sub-optimal gain, the more likely the optimal response obtained through resolvent analysis is to model the system. More rigorously, this also depends on the projection of the effective forcing of the system (whether it is from external perturbations or intrinsic, turbulent nonlinear interactions) onto the forcing resolvent modes (Beneddine et al. Reference Beneddine, Sipp, Arnault, Dandois and Lesshafft2016). Here,
 $\sigma _1 / \sigma _2 \simeq 3$ is found at low frequency. This value not being significantly greater than 1, if we assume that the optimal response drives the system (which we do based on the previous discussions on the bubble dynamics), then the actual forcing can be assumed to project reasonably well onto the optimal forcing mode. This gives us some insight into the actual forcing in the flow. The optimal forcing is indeed maximum around the separation point and along the separation line on the downstream part of the bubble (figure 5). Thus, some forcing is required in these regions in order to maintain the low-frequency bubble dynamics. The limit of the resolvent analysis is eventually reached when seeking for the origin of the forcing. Because of its linear nature, this framework does not allow us to discuss how the low-frequency structures can be produced by nonlinear interactions. Thus, both boundary layer structures convected to the interaction region (Ganapathisubramani et al. Reference Ganapathisubramani, Clemens and Dolling2007) exciting the separation point and upstream travelling mechanisms (Sansica et al. Reference Sansica, Sandham and Hu2016; Bonne et al. Reference Bonne, Brion, Garnier, Bur, Molton, Sipp and Jacquin2019) forcing the downstream part of the recirculation bubble could be valid candidates to sustain the low-frequency dynamics of the SWBLI.
5. Linear dynamics of 3-D perturbation at low frequency
5.1. Resolvent analysis
The low-frequency dynamics of 3-D perturbations, characterised by their non-zero spanwise wavenumber  $\beta$, is studied in this section. The analysis is here limited to the base flow calculated at
 $M=2.20$ and
 $Re=1100$. The influence of
 $\beta$ on the optimal gain at
 $St_{L} = 10^{-4}$ is shown in figure 18. A first peak is observed for low wavenumbers around
 $\beta = 0.25$. The corresponding wavelength is
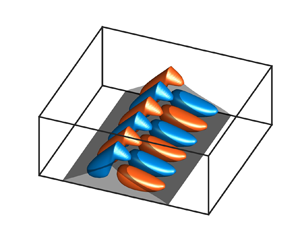
 $\lambda _z = 25 \delta _0^*$, which is of the order of the recirculation length (approximately half of it, see table 1). The associated optimal forcing and response can be visualised by plotting the isosurface of a selected amplitude in the 3-D physical space (figure 19). The optimal response is located in the recirculation region and features a phase shift in the streamwise direction. A strong resemblance can be noted with the 3-D global mode found by Robinet (Reference Robinet2007). The possibility of a modal resonance to model the optimal gain, as developed previously for 2-D perturbation, will be explored in the next section. The optimal forcing field is made of elongated structures that lay upstream from the recirculation bubble until the separation point. The energy density
 $\mathrm {d}E(x)$ of the response can be defined at each streamwise location as
 $\mathrm {d}E(x) = \int 0.5 \rho ( u u^* + v v^* + w w^* ) \,\mathrm {d} y$. An analogous quantity can be defined for the forcing field. The profiles of these energy densities confirm that the response is localised in the separation region as it experiences a rapid decay downstream from it (figure 20). The forcing energy is shown to spread over a larger portion of the domain and reaches a peak in the vicinity of the separation point.
Optimal gain as a function of the spanwise wavenumber at  $St=10^{-4}$ (
 $Re=1100$,
 $M=2.20$).

Optimal resolvent mode at  $\beta =0.25$ and
 $St_{L}=10^{-4}$, real part of
 $w$. Iso-surfaces at
 $40\,\%$ and
 $-40\,\%$ of the maximum absolute value are plotted in red and blue. The dark grey surface is the recirculation bubble of the base flow (homogeneous in
 $z$).

Energy density profiles of the optimal resolvent modes at  $\beta =0.25$ (a) and
 $\beta =2$ (b),
 $St_{L}=10^{-4}$. The profiles are normalised by their maximum value.

In addition of the local maximum at  $\beta =0.25$, the optimal gain features a peak of larger magnitude around
 $\beta =2$. The corresponding wavelength is
 $\lambda _z = 3 \delta _0^*$ and is now of the order of the boundary layer thickness. Elongated streamwise vortices located upstream of the recirculation bubble are found in the optimal forcing field (figure 21). A further inspection of the wall-normal organisation of its components (available in Appendix B, figure 28) shows that they correspond to streamwise vortices. Downstream of the recirculation bubble, streaks of streamwise velocities are observed in the boundary layer, for which profiles reveal that
 $u\gg v$ and
 $u\gg w$ (figure 28). These features indicate the action of the lift-up mechanism that is ubiquitous in shear flows at low frequency and non-zero spanwise wavenumbers (Landahl Reference Landahl1980). Besides, these results are very similar to the 3-D optimal response in a supersonic boundary layer without impinging shock (Bugeat et al. Reference Bugeat, Chassaing, Robinet and Sagaut2019). The energy profiles reveal the convective nature of this instability as perturbations keep growing until the downstream end of the domain (figure 20). Most of the energy is contained downstream from the recirculation area whereas most of the forcing energy is localised upstream from it. These results hence show that the growth of streaks does not interact significantly with the recirculation region.
Optimal resolvent mode at  $\beta =2$ and
 $St_{L}=10^{-4}$, real part of
 $w$ of the forcing (a) and real part of
 $u$ of the response (b). Isosurfaces at
 $20\,\%$ and
 $-20\,\%$ of the maximum absolute value are plotted.

5.2. Link with global stability
Eigenvalue spectra of the global stability problem are given in figure 22 for the wavenumbers  $\beta =0.25$ and
 $\beta =2$ that correspond to maxima of the optimal gain. In both cases, the flow is found to be globally stable. Similarly to the analysis developed for 2-D perturbations in § 4, the relation between the optimal gain behaviour at low frequency and the global stability features is explored for these two spanwise wavenumbers.
Eigenvalue spectrum of the global stability problem at  $M=2.20$ and
 $Re=1100$; (a)
 $\beta =0.25$, (b)
 $\beta =2$.

5.2.1. Low  $\beta$: excitation of a steady global mode

At  $\beta =0.25$, the least stable global mode is steady (mode S1) as shown in figure 22(a). Its structure is shown in figure 23. It strongly resembles that of the optimal response previously observed. For 2-D perturbations, these observations led us to formulate the hypothesis of a purely modal dynamics at low frequency, driven by a single mode. The first-order low-pass filter model (4.2) that results from this assumption and that is based on the damping rate of the 3-D global mode S1 is tested in figure 24. Once again, the model correctly predicts the cutoff frequency of the optimal gain. The slope of the gain drop is also reasonably captured until
 $St_{L} \simeq 10^{-2}$, where additional modes participate in the forced dynamics. The low-frequency dynamics of 3-D perturbations at low wavenumbers thus behaves the same way as that of 2-D perturbations, which was expected as it is the limit when
 $\beta \rightarrow 0$. Finally, another peak of optimal gain can be observed at higher frequency in figure 24. This maximum is associated with the convective instabilities that are known to exhibit larger growth rates for
 $\beta \ne 0$ in supersonic flows (Mack Reference Mack1984), resulting in larger values of the optimal gain (Bugeat et al. Reference Bugeat, Chassaing, Robinet and Sagaut2019).
Global mode S1 at  $\beta =0.25$,
 $M=2.20$ and
 $Re=1100$. Isosurfaces of
 $40\,\%$ and
 $-40\,\%$ of the maximum absolute value of
 $w$ are plotted in red and blue.

Optimal gain at  $\beta =0.25$,
 $M=2.20$,
 $Re=1100$ (red line with squares). The low-pass filter model of (4.2), calculated using the damping rate of the 3-D global S1 at
 $\beta =0.25$, is shown in dashed blue line.

5.2.2. Larger $\beta$: pseudo-resonance

The lift-up mechanism leading to the formation of streaks is a linear algebraic instability, as theorised by Ellingsen & Palm (Reference Ellingsen and Palm1975). As such, linear stability theories based on a modal approach cannot capture it. Conversely, the resolvent analysis is particularly suited for their calculation as non-modal effects are taken into account (Schmid Reference Schmid2007). We now suggest showing the failure of the first-order low-pass filter model (based the excitation of a single mode) as a way to point out the non-modal character, or pseudo-resonance, of the optimal gain at wavenumbers of the order of  $\beta =2$. The least damped mode of the spectrum is the unsteady modes T1, followed by the steady mode S1 (figure 22b). Their structure is shown in figure 25. They share similarities with the optimal response already presented in figure 21(b) as their growth takes place in the downstream region of the domain. Nevertheless, noticeable differences remain, which suggests that the optimal response does not proceed from the excitation of a unique global mode. Two low-pass filters model based on the modes S1 and T1 are tested in figure 26. Both models underestimate the cutoff frequency and underpredict the optimal gain, confirming the non-modal nature of the optimal response at these wavenumbers.
Global modes S1 (a) and T1 (b) at  $\beta =2$ and
 $St_{L}=10^{-4}$, real part of
 $u$. Isosurfaces of
 $20\,\%$ and
 $-20\,\%$ of the maximum absolute value amplitude are plotted in red and blue.

Optimal gain at  $\beta =2$,
 $M=2.20$,
 $Re=1100$. The dashed blue line is the low-pass filter model based on global mode S1 (a) and T1 (b), which both fail due to the non-modal nature of the streaks.

5.3. Discussion
Depending on their spanwise wavenumber, the 3-D optimal response at low frequency can result from two different mechanisms, underpinned by a modal or non-modal nature. At low wavenumbers, whose length scales are of the order of  $L_{{sep}}$, optimal perturbations interact with the recirculation bubble. Their energy is localised in this region similarly to what was observed for 2-D perturbations. Additionally, the low-pass filter model based on the excitation of a unique steady global mode reasonably describes the low-frequency behaviour of the optimal gain
 $\sigma$. Low wavenumbers hence behave in continuity to the 2-D results (
 $\beta =0$) presented in § 4. Noticeably larger values of
 $\sigma$ are, however, reached for 3-D perturbations. This raises the question of whether the dynamics of the system at low frequency and low wavenumber is dominated by 2-D or 3-D perturbations. On the one hand, larger values of the gain indeed indicates that more energetic 3-D perturbations are expected in the flow, assuming the same forcing energy and the same projection of this forcing onto the resolvent modes for each wavenumber. These two assumptions are, at this point, impossible to verify. For example, if the forcing generated by nonlinear interactions in a turbulent flow is preferentially two-dimensional, then one may still expect the 2-D response to be dominant, even though it is associated with a lower gain value. Thus, no definitive conclusion can be drawn. On the other hand, the cutoff frequency based on the 3-D global response is
 $St_{L} = 6 \times 10^{-3}$. This underestimates the usual value of
 $St_{L} = 3 \times 10^{-2}$ even more than the 2-D perturbations, for which a value of
 $St_{L} = 1 \times 10^{-2}$ was found. This is in favour of the prevalence of 2-D perturbations at low frequency, even though a perfect quantitative agreement between our laminar analysis and the experimental data on turbulent flow is not expected. This is also backed up by previous work which restricted their analysis to 2-D perturbations (Touber & Sandham Reference Touber and Sandham2011; Sansica et al. Reference Sansica, Sandham and Hu2014)
The possibility that the low-frequency behaviour of the SWBLI may be a 3-D phenomenon remains a promising lead to explore further given some arguments found in our resolvent analysis. It could be interesting to investigate whether the optimal spanwise wavenumber would then scale with the recirculation bubble. A space-Fourier transform along the spanwise direction of the time-Fourier modes from experimental or numerical data would be required to explore this phenomenon. This, however, may not be manageable experimentally if the spanwise width of the facility is not wide enough compare with recirculation length scale. Recent studies have besides pointed out the influence of the sidewalls in SWBLI experiments (Rabey et al. Reference Rabey, Jammy, Bruce and Sandham2019; Xiang & Babinsky Reference Xiang and Babinsky2019). From a computational point of view, the same challenge of ensuring sufficiently wide domain is expected, additionally coupled with the costly computational time necessary to statistically converge the low-frequency time-Fourier transform. Such a study, if achievable, could help to characterise the 3-D organisation of the forcing field and eventually understand its role in the low-frequency dynamics.
While low wavenumbers exhibit a modal and localised (around the bubble) dynamics, optimal responses at larger wavenumbers have been shown to ignore the recirculation region as they are driven by a convective instability growing downstream in the boundary layer, as a result of non-modal effects. These findings are consistent with those of Dwivedi et al. (Reference Dwivedi, Hildebrand, Nichols, Candler and Jovanović2020), who recently carried out a transient growth analysis in a SWBLI at  $M=5.92$. Such analysis also embeds the non-modal effect and can in fact be seen as the temporal counterpart of the resolvent analysis (Sipp et al. Reference Sipp, Marquet, Meliga and Barbagallo2010). The authors detected streaky structures evolving in time and convected in space, similar to those obtained in the present study. Our resolvent analysis showed that streaks are associated with larger optimal gain values than the low wavenumber perturbations. This is not surprising as it results from a convective instability which efficiently extract energy from the base flow. The role played by the streaks in the low-frequency dynamics (
 $St_{L} \simeq 3 \times 10^{-2}$) is not obvious. Contrary to low wavenumber perturbations, streaks are not directly involved in this dynamics since they do not interact with the recirculation region and are expected to scale with
 $\delta _0^*$ rather than
 $L$. At first, it then seems that they could only be of interest regarding the transition to turbulence of the system. However, the large energy growth they trigger could quickly lead to nonlinear interactions that may play a role in the forcing of the bubble through upstream feedback (Bonne et al. Reference Bonne, Brion, Garnier, Bur, Molton, Sipp and Jacquin2019). Studying the development of streaks in a turbulent SWBLI, seen as coherent structures, would then be of interest. Following the work of Sartor et al. (Reference Sartor, Mettot, Bur and Sipp2015), this could be achieved by performing this 3-D resolvent analysis on a turbulent mean flow.
6. Conclusion
A resolvent analysis was carried out on a laminar SWBLI in order to study the low-frequency behaviour of the system for both 2-D and 3-D perturbations. The optimal gain, that can be seen as a transfer function of the system, was computed over several decades of Strouhal numbers. A model of optimal gain based on the excitation of a single global mode was developed, leading to the equation of a first-order low pass-filter, in agreement with the work of Touber & Sandham (Reference Touber and Sandham2011). Our analysis was shown to be valid for 2-D perturbations over different base flows calculated from different pairs of Reynolds and Mach numbers, but was not relevant at the largest Reynolds numbers tested. The time scale of the model, i.e. the cutoff frequency of the filter, was found to be determined by the damping rate of the least damped global mode. This damping rate scales as  $u_\infty /L$. Thus, the low-frequency dynamics is associated with a constant Strouhal number based on the recirculation length, as observed experimentally and numerically. The value obtained here is
 $St_{L} \simeq 1 \times 10^{-2}$, which slightly underestimates the classical values of the literature. This mismatch could be attributed to the laminar nature of the flow studied in this paper. Ultimately, this work carried out in the laminar regime suggests that the low-frequency dynamics of the SWBLI in the turbulent regime could be a forced dynamics, sustained by the background turbulent fluctuations. The resulting bubble dynamics, which would be sustained by a background forcing produced by nonlinear interactions in a turbulent flow, is then found to exhibit a breathing motion.
Assuming the spanwise direction as homogeneous, a 3-D resolvent analysis showed that two regimes of spanwise wavenumbers  $\beta$ could be identified. At low
 $\beta$, the same modal mechanism as that of 2-D perturbations, leading to a first-order low-pass filter, was observed. Larger values of optimal gain were obtained for wavenumbers of the order of the recirculation length. The possibility of a prevailing 3-D dynamics was then discussed. At larger wavenumbers, streaks generated by the non-modal lift-up effect were detected. Their growth does not interact with the recirculation region, suggesting that streaks are not directly involved in the low-frequency dynamics of the SWBLI. Finally, from the perspective of transition to turbulence, 3-D resolvent analysis remains an efficient tool to characterise the energy growth of streaks and provides their optimal wavenumber and forcing location.
Future work investigating the forcing terms (both two- and three-dimensional) produced by nonlinear interactions in a turbulent SWBLI, either through direct numerical simulation or experimental observations, would be a decisive follow-up to this work. While the low-frequency behaviour of the SWBLI was suggested to be understood as a forced dynamics, the physical origin of the forcing is missing. Ultimately, this could also provide some insights to assess the prevalence of 3-D effects in the dynamics of the system.
Declaration of interests
The authors report no conflict of interest.
Appendix A. Mesh convergence
The influence of the main numerical parameters on the eigenvalues computation of the global stability problem is tested. Eigenvalues associated with the first steady (S1) and unsteady (T1) global modes, that appear in the low-pass filter models in §§ 4.1.3 and 4.2.2, are considered. The reference set of parameters used throughout the paper is given on the first line of table 2. Independency with respect to the number of grid points  $N_x$ and
 $N_y$ is verified in the cases A and B. The influence of the height of the domain
 $L_y/\delta _0^*$ and the length of the domain downstream of the impinging shock
 $L_x^{DS} / \delta _0^*$ are assessed in the cases C and D. Overall, the unsteady mode is the most easily converged mode: relative differences of eigenvalues between the reference case and the other ones are equal to or below than
 $0.1\,\%$ for the range of tested parameters. As for the steady mode, relative difference of eigenvalues lower than
 $1\,\%$ are found, which is deemed acceptable.
Mesh convergence of the most unstable mode at  $M=2.30$,
 $Re=1100$. The reference set of numerical parameters, used in all the calculation of the paper, is the first one of the table.
 $\Delta \omega _{ref}$ corresponds to the difference between the eigenvalue of the reference case and that obtained in each other case.

Appendix B. Profiles of the 3-D resolvent modes
Profiles of the forcing and response of the 3-D low-frequency resolvent modes at  $\beta =0.25$ and
 $\beta =2$ are shown in figures 27 and 28 respectively. The
 $x$-location of each profile corresponds to that of the maximum of energy density as defined in § 5.1. Note that this location is different for the forcing and the response (see figure 20). As a result, the boundary layer thickness is different on each plot.
Profiles of the optimal resolvent mode at  $\beta =0.25$,
 $M=2.20$,
 $Re=1100$,
 $St_{L}=10^{-4}$.

Profiles of the optimal resolvent mode at  $\beta =2$,
 $M=2.20$,
 $Re=1100$,
 $St_{L}=10^{-4}$.


 Open access

