Introduction
The bonanza of extrasolar planets discovered so far (over 1786 planets, Schneider et al. Reference Schneider, Dedieu, Le Sidaner, Savalle and Zolotukhin2011) unveils that most of these new planets are very different from those of our Solar System. New worlds are hot gaseous giants (hot jupiters and hot neptunes), giant planets (jupiters and saturns) and smaller rocky worlds as super earths and earths. Earths and super earths are rocky exoplanets with mass ranging between 1 and 10 M⊕ (Valencia et al. Reference Valencia, Sasselov and O'Connell2007). Although the lower mass limit is obvious for historical reasons, the upper limit is somewhat arbitrary. It is due to the physical argument that above ~10 M⊕, planets can retain hydrogen and helium in their atmospheres (Ida & Lin Reference Ida and Lin2004). The Earths have radius R P ≤ 1.25 R⊕, while super earths have radii ranging between the interval 1.25 and 2.0 R⊕ (Batalha et al. Reference Batalha, Rowe and Bryson2013; Borucki et al. Reference Borucki, Koch, Basri, Batalha, Brown, Bryson, Caldwell, Christensen-Dalsgaard, Cochran and DeVore2011).
Since the discovery of GJ876d in the 2005 (Rivera et al. Reference Rivera2005) the existence of a set of super earths has been confirmed up to now (The Extra Solar Planets EncyclopaediaFootnote 1 , Schneider et al. Reference Schneider, Dedieu, Le Sidaner, Savalle and Zolotukhin2011). On the other hand, there are 2013 KOI (Kepler Objects of Interest) with earth and super earth size in the NASA Exoplanets ArchiveFootnote 2 . The warm super earth orbiting the M star GJ 1214b (Charbonneau et al. Reference Charbonneau, Berta, Irwin, Burke, Nutzman, Buchhave, Lovis, Bonfils, Latham, Udry and Murray-Clay2009) has been the first super earth to be observed spectroscopically (Bean et al. Reference Bean, Miller – Ricci and Homeier2010). For the time being only two techniques can be used in order to probe the atmospheres of a planet: direct imaging and transits. The direct detection of a planet is still very challenging due to its high contrast ratio with respect to the host star, which can reach values of 10−10 for an Earth-like planet (see, e.g., Chauvin et al. Reference Chauvin, Lagrange, Zuckerman, Dumas, Mouillet, Song, Beuzit, Lowrance and Bessell2005; Lafreniére et al. Reference Lafrenière, Doyon, Marois, Nadeau, Oppenheimer, Roche, Rigaut, Graham, Jayawardhana and Johnstone2007; Biller et al. Reference Biller, Liu, Wahhaj, Nielsen, Hayward, Males, Skemer, Close, Chun and Ftalias2013). Transits give important diagnostic on the probable modification of the atmosphere due to the history of the planet allowing transmission and emission spectroscopy. Transmission spectroscopy, possible only when the planet transits its host star along the line of sight, allows one to infer the main opacity sources present in the high atmosphere of the planet (Brown Reference Brown2001; Tinetti et al. Reference Tinetti, Liang, Vidal-Madjar, Ehrenreich, Lecavelier des Etangs and Yung2007). Complementary, emission spectroscopy (Charbonneau et al. Reference Charbonneau, Allen, Megeath, Torres, Alonso, Brown, Gilliland, Latham, Mandushev, O'Donovan and Sozzetti2005), observing the day hemisphere of the planet and exploiting its occultation during the secondary transit, gives evidence on the thermal structure of the planetary atmosphere and the emission/reflection properties of the planetary surface. In order to maximize the finding of habitable planets with transit search, a lot of surveys have been dedicated to search for earth and super earths size planets around M stars (e.g. Nutzman & Charbonneau Reference Nutzman and Charbonneau2008). Due to a more favourable ratio between the radii, some small rocky companions have been discovered in the habitable zone (HZ) of these red and cold stars. The study of super earths in the HZ of stars cooler than the Sun will challenge the paradigm of the Earth-twin orbiting a Sun-twin as the only possible cradle of life (Segura et al. Reference Segura, Kasting, Meadows, Cohen, Scalo, Crisp, Butler and Tinetti2005). In the past, starting by Huang (Reference Huang1959, Reference Huang1960) and Dole (Reference Dole1964), astronomers have considered stars very different by the Sun not suitable for biology. The stars with larger masses because evolve too fast, and those with smaller masses because their luminosity is too faint. In the latter case (the M star case), the HZs are so close to the star that the planet results tidally locked to the host star (e.g. Kasting et al. Reference Kasting, Whitmire and Reynolds1993) keeping always the same hemisphere facing the star. Haberle et al. (Reference Haberle, McKay, Tyler, Reynolds and Doyle1996) with a one-dimensional (1D) simple model and successively Joshi et al. (Reference Joshi, Haberle and Reynolds1997) with a more complex 3-D model showed that the atmospheric heat transport could prevent the freeze out of the night hemisphere of the planet. All these considerations coupled with the realization that 75% or more of the stars are M-type dwarfs (Henry Reference Henry, Hilditch, Hensberge and Pavlovskipp2004) make them appealing stars to search for life.
On Earth, due to the more efficient use of energy, the evolutionary selection preferred the photochemistry instead of chemolithotrophic reaction as energy source for growth (Wolstencroft & Raven Reference Wolstencroft and Raven2002; Kiang et al. Reference Kiang, Siefert, Govindjee, Blankenship and Meadows2007a). On Earth-like planets orbiting other stars could happen the same at the correspondent evolutionary state also if the means of energy transformation although redox reactions are essential need not necessarily involve the detailed mechanisms used on Earth.
The detection of photosynthesis on a super earth orbiting a star different by a solar twin is an attractive possibility for the remote sensing of life. In fact, photosynthesis will lead to an accumulation of free O2 in the planet atmosphere detectable via spectroscopic detection of O3 produced by O2 in photochemical reactions. The presence of ozone in the NIR (band at 10 μm) could be used as biosignature (Angel et al. Reference Angel, Cheng and Woolf1986; Leger et al. Reference Leger, Pirre and Marceau1993) also if cautions should be taken into account for false positive created by photochemical reaction in high atmosphere (e.g. Selsis et al. Reference Selsis, Despois and Parisot2002; Kiang et al. Reference Kiang, Siefert, Govindjee, Blankenship and Meadows2007a, Reference Kiang, Segura, Siefert, Tinetti, Govindjee, Blankenship, Cohen, Siefert, Crisp and Meadowsb). A detectable concentration of O2 and/or O3 in combination with reduced gases such as CH4 is a more robust signature of biologic activity (Lammer et al. Reference Lammer2009). Signatures of the presence of photosynthesis on the surface of a planet are mainly the spectral reflectance characteristics of organisms due to the wavelength range in which they absorb the light. On Earth there are two spectral signatures. The former is the ‘green bump’ due to the absorption of light by green plants in the range between 400 and 700 nm. The later, more significant, is the ‘red edge’ due to the high reflectance at 700–850 nm. The red edge causes a high contrast between the visible and the NIR in the spectra (Kiang et al. Reference Kiang, Siefert, Govindjee, Blankenship and Meadows2007a, Reference Kiang, Segura, Siefert, Tinetti, Govindjee, Blankenship, Cohen, Siefert, Crisp and Meadowsb and references therein). Theoretical studies (Wolstencroft & Raven Reference Wolstencroft and Raven2002) show that the photosynthetic production of O2 should be greater on cloud-free planets orbiting in the inner limit of the HZ of warmer Solar-like stars than on those with cooler parent stars. The lower O2 production in habitable planets orbiting colder stars is due to the poor match between the spectral energy distribution of the parent star and the properties of terrestrial pigments, but M star planets could be more productive if useful photons extend to 1.1 μm for anoxygenic photosynthesis (Tinetti et al. Reference Tinetti, Rashby and Yung2006; Kiang et al. Reference Kiang, Segura, Siefert, Tinetti, Govindjee, Blankenship, Cohen, Siefert, Crisp and Meadows2007b).
This introduction could not be exhaustive of the multitude of theoretical works done in these years on this topic. A lot of hypotheses have been done on role of photosynthesis in the habitability of extrasolar planets and on its efficacy under the radiation of stars of different spectral types with particular efforts on M stars.
In this framework, it is interesting to explore in the laboratory how the irradiation of an M star modifies (if it does) the oxygen production of photosynthetic bacteria.
This could be done putting photosynthetic bacteria inside steel reaction cells where it is possible to maintain a mixture of gases simulating a planetary atmosphere as done in our experiment described in this paper. The reaction cells are positioned inside an environmental simulator that can control the temperature and the pressure. In particular in the Section ‘Criteria and material’ we explain with what criteria we selected the environmental conditions and describe the material used in the laboratory experiment. The experiment, its status and the preliminary results on commissioning of the environmental simulator are described in the Section ‘The experiment plan and setup’ and ‘Commissioning results and status’ while ‘Conclusions’ are given in the last section.
Criteria and material
The main target of the experiment is to study the modification to the secondary atmosphere of a habitable rocky planet orbiting an M star due to the presence of photosynthetic bacteria on its surface. This scenario constraints the environmental parameters such as pressure, temperature, planetary atmosphere contents and irradiation pattern that we want simulate in laboratory.
M stars and habitable planets
In the case of a planet in the HZ of an M star, the situation is complicate because it is tidally locked with the star. The day side of the planet, always irradiated by the star, is hotter than the night side. If there is not any heat exchange between the two hemispheres, the night side could be so cold that all the atmosphere constituents will condense out on the surface following what is called the atmospheric collapse. Actually, the atmospheric motions reduce the day/night temperature gradient by transporting heat. Horizontal advection is strong enough to prevent the atmospheric collapse of the night hemisphere (Joshi et al. Reference Joshi, Haberle and Reynolds1997; Joshi Reference Joshi2003). Haberle et al. (Reference Haberle, McKay, Tyler, Reynolds and Doyle1996) used a simple energy balance model to show that a pure CO2 atmosphere having a value of p 0 of about 15 kPa is sufficient dense to warm up the night hemisphere of such a planet over the freezing point of CO2. Later, with a more refined and complete 3-D model Joshi et al. (Reference Joshi, Haberle and Reynolds1997) show that an Earth-like planet in the HZ of an M star can support an atmosphere and if the atmosphere is as thick as 100–200 kPa it may also support liquid water on a large fraction of the surface. In fact, later models allowed completely ocean-covered water worlds (Joshi Reference Joshi2003).
The atmospheric level of CO2 and its variations due to changes on plate tectonic and volcanism are important factors for the planetary climate and temperature variation (Kasting & Catling Reference Kasting and Catling2003).
Moreover the definition of the temperature range in which the green house effect is effective to sustain the superficial temperature of the planet as high as it can maintain the water in the liquid state, depends on the host star, the orbital distance of the planet and the planet itself (Kasting et al. Reference Kasting, Whitmire and Reynolds1993; Selsis et al. Reference Selsis, Kasting, Levrard, Paillet, Ribas and Delfosse2007). Using both the ‘Mars’ and ‘Venus’ criterion (Selsis et al. Reference Selsis, Kasting, Levrard, Paillet, Ribas and Delfosse2007) this range is between 216 K (first condensation of CO2) and 373 K (water loss limit). In any case, in order to avoid difficulties in this first phase of the experiment and expensive laboratory infrastructure, we consider earths and super earths well inside the HZ of the host star. This make the temperature ranges between 273 and 288 K (the current temperature value on Earth).
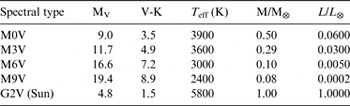
M dwarfs are faint hydrogen burning stars with low photospheric temperature which spectra are dominated by molecular bands like, in the visible, TiO and VO. Even the most luminous M star (spectral type M0) is over 10 times fainter than the Sun. The steep dependence of stellar luminosity on mass results in M stars spanning a factor of about 100 in bolometric luminosity. Another characteristic of these stars is that their effective temperatures range from 3900 to 2400 K, passing from M0 to M9 (see Table 1). In the visible these stars are something like 60 000 times fainter than the Sun (absolute visible magnitude change from 9 to 20). These characteristics are also reflected in the ultraviolet (UV) zone of the spectrum. The UV emission has two components that are both dependent by the age of star. Photospheric component, depending by stellar surface temperature has a faint dependence by the stellar age (Gough Reference Gough1981). This component is weak for stars of spectral type later than G. Instead, the second component, due to the active chromosphere that drains energy by the dynamo mechanism in the stellar interiors, is the main cause for UV radiation emission of M stars. This component depends on the stellar rotation and is thought to decline with age (e.g. Ayers et al. Reference Ayres1997). When they are young they are more magnetically active and exhibit large flares and strong X-ray and UV emission. But due to their typical masses once they are burning hydrogen the HZ can be stable and in place for 100 Gyr (Tarter et al. Reference Tarter, Backus, Mancinelli, Aurnou, Backman, Basri, Boss, Clarke, Deming and Doyle2007) and in part of this time the star could evolve in a stiller state. In order to maximize the output of the experiment we decide to simulate the irradiation of an M0V star.
M star characteristics compared with those of the Sun

Photosynthetic bacteria
Photosynthetic bacteria are the key to understand how a hot, inhospitable planet evolves in a beloved and safe green planet. In Kiang et al. (Reference Kiang, Siefert, Govindjee, Blankenship and Meadows2007a) it is possible to find a review of the basic processes at work with photosynthetic organisms and a quite complete directory of photosynthetic bacteria, algae and plants on Earth together with their habitats and main characteristics.
In phototrophs Chlorophylls (Chls) both harvest the light and transduce it into chemical energy; there are four chemically different chlorophylls termed Chls a, b, c and d in the order of their discovery. All four pigments are present in light-harvesting complexes, though until recently only Chl a was thought to be indispensable for energy transduction in the photosystem reaction centres. This paradigm was challenged with the discovery of the red-shifted Chl d, in the cyanobacterium Acaryochloris marina, where it constitutes up to 99% of all Chl. Other photosynthetic pigments are the phycobiliproteins present in the light-harvesting complex of cyanobacteria with absorption spectra ranging from 480 to 650 nm.
The photosynthetically active radiation (PAR) represents the active radiation boundaries between which photosynthesis can be able to operate. For plants it is enclosed between 0.40 and 0.70 μm. Other living organisms, such as green bacteria, purple bacteria and heliobacteria, can exploit solar light in slightly extended spectral regions or in ecological niches, such as the near-infrared. These bacteria live in environments such as the bottom of stagnant ponds, sediment and ocean depths. Because of their pigments, they form colourful mats of green, red and purple. Purple bacteria have absorbance peak in the 1.013–1.025 μm range which use bacteriochlorophyll b like Blastochloris viridis or Rhodopseudomonas viridis (that absorbs at 0.96 μm) and other bacteriochlorophylls in the range 0.7–0.9 μm (Scheer et al. Reference Scheer, Green and Parsons2003). They do not use water as H donor, and then do not release oxygen as by-product. Other bacteria that can photosynthesize in the IR are the Chlorobium genus, with an absorbance peak in their pigments at 0.84 μm or Rhodospirillum rubrum and Rhodospirillum capsulata both absorbing at 0.87 μm (Heath et al. Reference Heath, Doyle, Joshi and Haberle1999). The bounds of the shorter PAR band could be set at 0.40–0.73 μm to acknowledge the ability of A. marina to utilize the longer wavelengths (Chen et al. Reference Chen, Telfer, Lin, Pascal, Larkum, Barber and Blankenship2005; Kiang et al. Reference Kiang, Segura, Siefert, Tinetti, Govindjee, Blankenship, Cohen, Siefert, Crisp and Meadows2007b).
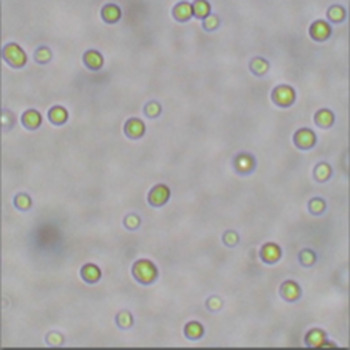
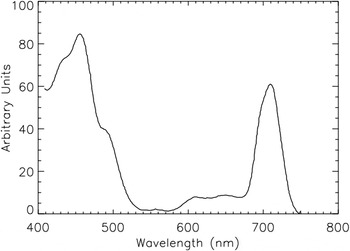
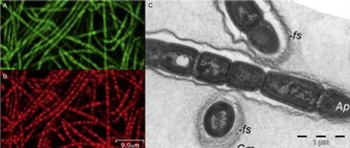
The cyanobacterium A. marina (see Fig. 1) produces Chl d and it utilizes far-red light, at 710 nm wavelength (Fig. 2) and in condition of faint irradiation at shorter wavelength it may be adapted to receive light at longer wavelength (Kiang et al. Reference Kiang, Siefert, Govindjee, Blankenship and Meadows2007a).
Image of Acaryochloris marina.

Absorption spectra of Acaryochloris marina. The spectrum shows the features that are typical for Chl d-dominate organisms (adapted by Mohr et al. Reference Mohr, Voss, Schliep, Kurz, Maldener, Adams, Larkum, Chen and Hess2010).

It is worth to mention other two kinds of photosynthetic bacteria: Chroococcidiopsis spp. and Halomicronema hongdechloris.
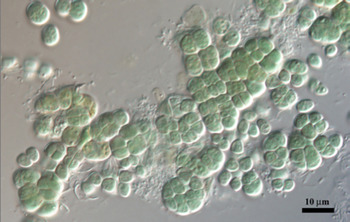
The former is a desiccation-tolerant lithic cyanobacterium (see Fig. 3).
Image of Chroococcidiopsis.

According to Billi et al. (Reference Billi, Viaggiu, Cockell, Rabbow, Horneck and Onofri2011), O2 production (evolution-uptake) was recorded to be about 40 fmol cell−1 h−1 in normal growth condition (20 μmol of photons m−2 s−1). Taking as approximation a typical bacterial cell mass around 1 pg this would lead to a production of about 40 mmol g−1 h−1. Chroococcidiopsis normal growth condition is 20 μmol of photons m−2 s−1. The theoretical photosynthetic production limit is 0.1 × 10⁻⁶ mol of photons m−2 s−1.
The latter is a filamentous cyanobacterium that contains Chl f (shown in Fig. 4).
Image of Halomicronema hongdechloris.

Photosynthetic organisms can produce gases, such as O2 (or O3 from its photolysis), and nitric oxides such as N2O, NO X , CH3Cl or COS from the breakdown of organic matter. All these molecules can modify exoplanet's atmospheres and can be detected remotely from Earth. O2 can be produced even abiotically through photolysis and the effects of carbon burial and hydrogen escape (Selsis et al. Reference Selsis, Despois and Parisot2002; Kiang et al. Reference Kiang, Siefert, Govindjee, Blankenship and Meadows2007a). Though its simultaneous presence with other reduced gases can be explained only with biotic processes that maintain chemical disequilibrium (Kiang et al. Reference Kiang, Segura, Siefert, Tinetti, Govindjee, Blankenship, Cohen, Siefert, Crisp and Meadows2007b).
Detectability of photosynthetic processes depends on biotic productivity, which depends on several factors, such as availability of resources (water, light, minerals, electron donors, nutrients, etc). During photosynthesis, light impacts on photo-receptive organisms that split water molecules and produce proton gradients and energy useful for the cells (Kiang et al. Reference Kiang, Siefert, Govindjee, Blankenship and Meadows2007a). It is crucial to understand the ability of organisms to use photosynthesis on M star planets. PAR on M star planets can be lower than the average terrestrial value even by an order of magnitude (Heath et al. Reference Heath, Doyle, Joshi and Haberle1999). Nevertheless this could not represent a problem because several marine organisms on Earth evolved to use only 5 × 10⁻⁴ times the average flux received at the Earth's surface, like sulphur bacteria with peculiar light-harvesting antenna, known as chlorosome, that permit to use only small fractions of light intensities (McKay Reference McKay2000). In these regions, radiation is dominated by red or IR radiation.
For our purpose we need a bacterium that is resistant to harsh conditions (e.g. an extremophile) and capable to photosynthesize in the NIR as explained in the previous paragraph. The choice has been fallen on the cyanobacterium A. marina. The use of this kind of bacteria defines the working wavelength range of the experiment to be in between 400 and 900 nm (see Fig. 2).
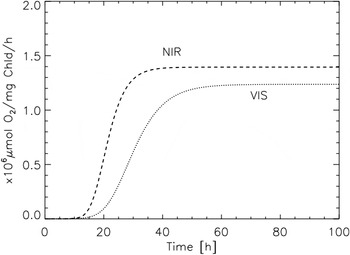
Studies on O2 productivity of these bacteria show that it is directly dependent on bacteria growth. The increase in number of bacteria often shows a phase in which the specific growth rate starts at a value of zero and then accelerates to a maximal value in a certain period of time, resulting in a lag time. In addition, growth curves contain a final phase in which the rate decreases and finally reaches zero, so that an asymptote is reached. When the growth curve is defined as the logarithm of the number of organisms plotted against time, these growth rate changes result in a sigmoidal curve, with a lag phase just after t = 0 followed by an exponential phase and then by a stationary phase. In order to evaluate the production of O2 by these bacteria we use as growth model, the Gompertz model fully described in Zwietering et al. (Reference Zwietering, Jongenburger, Rombouts and van't Riet1990), that take into account the bacteria rate of growth, the lag time and the maximum value that could be reached in growth. These three parameters depend on the bacterial population and are derived by measuring them. Behrendt et al. (Reference Behrendt, Schrameyer, Qvortrup, Lundin, Sørensen, Larkum and Kühl2012) characterized in biochemical and biophysical way the A. marina obtaining also the required parameters. The O2 production is evaluated multiplying the rate of growth for the maximum gross photosynthesis found by Behrendt et al. (Reference Behrendt, Schrameyer, Qvortrup, Lundin, Sørensen, Larkum and Kühl2012) that is 1272 μmol O2 mg−1 Chld h−1 in the NIR (700 ≤ λ ≤ 730 nm) and 1128 μmol O2 mg−1 Chld h−1 in the VIR range (300 ≤ λ < 700 nm). The result is shown in Fig. 5.
Summary
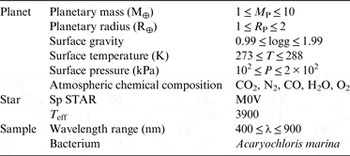
To summarize (Table 2) in our experiment we measure the oxygen production of the A. Marina considering a habitat very similar to that on Earth, but illuminated by a M0V star.
Summary of values of quantities to be simulated into the laboratory

Once obtained this result we will be able to test the oxygen production by this cyanobacterium under other, more challenging, environmental conditions using our simulator.
The experiment plan and setup
A lot of theoretical works have been done on this topic and all of them suggest theory to be verified with laboratory experiments. The amount of work necessary to verify most of the suggested hypothesis is a huge and challenging one. But, because also a long walk begins with a single step, we start with this first approach to the experimental verification on the efficiency of production of O2 by photosynthetic organisms illuminated by a cold black body. The main pipeline of the experiment consists of three phases. The first phase is a fiduciary experiment in which we will measure the photosynthetic bacteria O2 production in terrestrial conditions using a solar simulator. This first phase is necessary to understand if the setup of the experiment allows us to perform all the measurements we need. On the contrary, it let us to comprehend what and why there is something wrong. Once performed this first phase it will be possible to move to the next step and change the irradiation source. For this second phase we will use an illuminator that simulate the M0 star irradiation. Finally, we will change the gas mixture (the atmosphere) inside the cells (the third phase), keeping M0 star simulator source as in the previous step, to perform the experiment in different environmental condition. At this phase the composition of the mixture of gas to be used will come by theoretical simulation of super earth atmospheres.
The setup of the experiment consists in an environmental simulator that can host up to six reaction cells in which the biological sample will be placed and irradiated. In the following of this paragraph, the setup of the experiment is outlined.
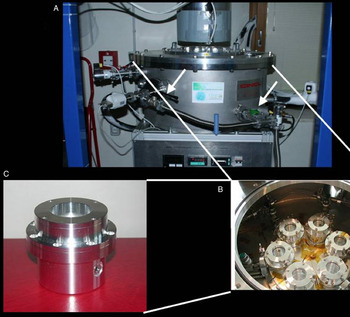
The environmental simulator Laboratorio Italiano Simulazione Ambienti (LISA) (Galletta et al. Reference Galletta2006), shown in Fig. 6, was designed and built with the technical support of the Center of Study and Space Activity of Padua (CISAS) in order to perform survival experiments of terrestrial bacteria strains. It has been exploited in the past to study the limit of bacterial life on the planet Mars (Galletta et al. Reference Galletta, Bertoloni and D'Alessandro2010). It allows up to six simultaneous experiments in corresponding steel reaction cells of 250 cc, each containing a bacterial or soil sample. The cover of the simulator has a glass window (that could be obscurated) to allow the illumination of the inner part by an external light source. LISA environmental chambers can reproduce the conditions of many rocky planet locations near the surface. Temperature inside the simulator could be modified during the experiment in the range between +100 and −100°C whenever we need to simulate a variation between day and night or summer and winter. A pump system modifies the pressure inside the chamber in order to keep void during cooling. The temperature in the chamber could be raised acting on resistances or lowered by means a closed circuit with liquid nitrogen or glycol depending on the lower limit we like to reach. The reaction cells containing the biological samples are cooled by contact with a large aluminium dish that is at the top of a small reservoir of about 2000 cm3 containing the refrigerator liquid fed by an external receptacle. A PT100 temperature sensor connected with an electric valve opens or closes the refrigerator liquid flux. If needed, an electric resistance between the dish and the reservoir is open, in a feedback circuit that keeps the vessels temperature fixed within ±0.5°C.
The gross O2 production of Acaryochloris marina. In the Gompertz model the maximum is represented by the plateau at the maximum rate.

In the picture can be seen the instrumental complex in to (a) and the particular of one of the six cells located inside it (b, c). The LISA SAM has been built by the Astronomy Department of University of Padua.

Atmosphere with different compositions could be pumped inside the reaction cells.
Cells are connected with the outer part by pipes with mechanical filters to let the gas to course and avoid biological material to go inside the cryostat chamber.
The reaction cells have been slightly modified from the original design mainly because we plan to measure the oxygen content and its variation by means the diode laser spectroscopy based on fluorescence. This technique has had a large development in both monitoring of gases in food packaging and in the medical field. The instrument tunes the wavelength of the laser across a wavelength interval where the probed gas has an absorption line and the light is sent along a path through the gas. A detector records the intensity of the light that passed through the gas as a function of time. The measurement is based on the Beer–Lambert law (Beer Reference Beer1852):
 $$I({\rm \lambda} ) = I_0 ({\rm \lambda} ){\rm} \cdot {\rm e}^{ - {\rm \sigma} ({\rm \lambda} )c\cdot L}, $$
where c is the concentration of the gas, L is the length of the light path, and σ is the molar absorptivity. If the path length is given in centimetres, and the concentration in molecules per cm3, σ must have the unit cm2 for the exponent to be dimensionless. To extract the concentration from the measured intensity decrease, both σ and L must obviously be known. L is fixed by the reaction cell dimension while σ could, in principle, be known from databases such as HITRANFootnote 3 (Rothman et al. Reference Rothman, Gordon, Babikov, Barbe, Benner, Bernath, Birk, Bizzocchi, Boudon and Brown2013), and indeed sometimes this is the way to proceed. However, it is probably more common to perform calibration measurements with known gas concentrations. The main advantages of this approach is that it is then not necessary to know exactly which absorption line of the gas is being monitored, and that the whole signal-processing chain is automatically considered in the calibration (Werle Reference Werle1998). For this the reaction cell has been redrawn in order to allow laser light to pass through the gas.
Once the reaction cells will be filled with the gas at the required pression (it depends on the phase of the experiment) and the sample will be accommodated inside them, the sample will be lightened. During the first phase we will use a Solar simulator, while in the second phase we will use an M0 star light simulator.
The power of the illuminators has been chosen in order to allow bacterial photosynthesis and taking into account the planet to star separation for which HZ is defined. Void will be kept inside the chamber around the aluminium cells to avoid frosting damages. Before and during sample irradiation will be taken measurements of gas composition, expecting a peak of gas concentration variations at the end of bacteria metabolic and photosynthetic process. M0 star spectra have strong absorbing lines and bands, so it is difficult to reproduce exactly it as they are not good black body emitters. Once this illuminator will be ready, measurements will be taken as in the fiduciary step using the new lamp instead the Sun simulator one.
Commissioning results and status
The experiment is under development and it is evolving on more than one level, each of which is an essential part of it.
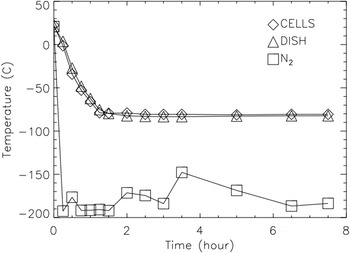
In the laboratory we tested the performance of the environmental chamber. The thermal efficiency of LISA has been evaluated cooling the dish up to −80 °C and evaluating the temperature inside the reaction cell obtaining the same results described by Galletta et al. (Reference Galletta2007) and shown in Fig. 7.
Decreasing of temperature inside the environmental simulator.

Moreover we tested also the reaction cells for leakage with a helium leak detector in order to know how they are able to confine the gasses. The main parameters to keep under control is the time constant τ calculated as τ = t/ln [k/(P 0 − P(t))] where P(t) is the pressure at time t, P 0 is the zero pressure, k is the difference between P 0 and P(t = 0) that is the first measure kept close to the vacuum. The loss rate Q A, calculated as P 0/τV where V is the cell volume, that is, 0.25 l. Each cell has an average time constant of about 2000 h and a loss rate Q A = 13 Pa h−1.
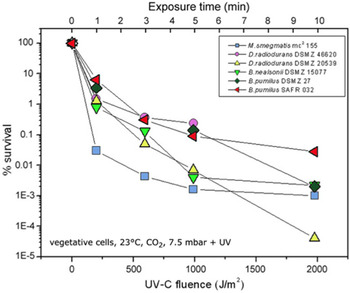
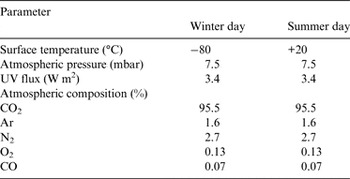
As cells, all the hardware described in the previous section was refurbished in order to update most of the electronics and control system. So we performed an experiment in order to test all the hardware in working condition. This ‘commissioning’ experiment was designed to determine how short-term Martian atmospheric conditions affect vegetative cells survivability. Martian conditions were simulated using LISA facility. Cellular suspension (layered on sterile coverslip dehydrated under sterile air flux) was exposed respectively to ‘winter’ and ‘summer’ Mars-like conditions. The selected winter and summer Martian conditions are reported in Table 3. In both cases specimens were exposed to UV and continuum lamp (UV-samples) or shielded from any light (Dark samples). Once colonies are formed, they are counted to establish the survival percentage with respect to the original sample. Details of the procedure and on results will be object of another paper (Galletta et al. in preparation) and they will not described here. In general, as seen in Fig. 8, vegetative cells at ‘Summer’ temperature are soon killed by the UV radiation of the lamp simulating the Sun on Mars surface. In particular, Deinococcus radiodurans, a bacterium known to resist to an instantaneous dose of up to 5000 GYFootnote 4 of ionizing radiation with no loss of viability (while 10 GY can kill a human) appears to not resist to the combined action of the desiccation due to the low pressure (0.7 kPa) and the UV light, showing no survival in our samples after 5–8 min of exposure.
Survival in simulated Martian conditions for vegetative cells. All strains are killed in few minutes.

Environmental parameters in the Mars simulated chambers and on the surface of Mars for the same parameters estimated from MGC TES data (Hargitai et al Reference Hargitai, Bérczi, Nagy, Gucsik and Kereszturi2008) at the temperature at 14 h after the solstices at the equator (labelled summer day) and at the temperature at 14 h in the winter solstice at 40°N (labelled winter day)

A higher resistance is shown by the Bacillus pumilus SAFR032 strainFootnote 5 , whose survival is still 10% after 10 min exposure. However, no cells survive after a few minutes of irradiation. Cooling of these cells produce an additional disruption, due to the sublimation of the water present inside the cells or to its conversion to ice. This means that, as expected, no biological activity of vegetative cells, rich in water for more than 75%, is possible in Martian conditions.
Then we have freezed the samples, bringing them to winter day temperature on Mars (typically −80°C) and exposing them for longer time to UV radiation. These experiments are still ongoing, but preliminary results indicate that one of our Bacillus strains has a particular capability to survive in Martian conditions. More details will be found in Galletta et al. (2015).
This experiment made us aware of the functionality of the experimental setup. In the commissioning experiment just described we used a UV lamp. In the planned experiment a new illuminator is necessary. Actually, what kind of illuminator and its characteristics are critical for the experiment. As planned the first phase foresees that the biological samples will irradiate with a Solar light simulator. It is important to recall that it is not necessary to mimic the whole Solar and stellar spectrum but only that portion that is inside the wavelength range defined in Table 2.
In order to build irradiation sources suitable for the experiment aims we have analysed different light sources, mainly lamps and LEDs (Light Emitted Diode).
Lamps as tungsten-halogen, mercury, xenon and metal-halide are the most common radiation sources on the marketplace. They are broadband devices with an emission spectrum that can cover different wavelengths. The advantage of lamps is their high luminosity and broad bandwidth, but their disadvantage is the stillness of the spectrum and the impossibility to change it in real time. Though, the tungsten-halogen and the xenon lamps are the only capable to emit in the NIR bandwidth (the peak of M0 type stars). One problem with this kind of lamps is the UV radiation. The emission of UV could be reduced or eliminated by means of appropriate filtering. We do not use this part of the spectrum of the lamp because we are not interested, at the moment, to test the survival of photosynthetic bacteria once exposed to UV. We want to test their productivity rate once they are in a safe location.
For the fiduciary experiment we need to reproduce the solar spectrum at the top of the atmosphere of the Earth and for this purpose mercury, xenon and metal-halide lamps could be useful like for example a xenon arc lamp a ORIEL 6258 300 Watt Ozone Free.
In order to represent the M0 star's planets we have to replicate the M0 star irradiation at the top of the atmosphere of an extrasolar terrestrial planet. LEDs could be a good alternative to lamps. In fact, they are cheap, small and more versatile. For our purpose, one of the best features of LEDs is that it is possible to modulate their intensity and switch it on or off driving it by a PC. This is a great advantage with respect to lamp illumination that has a fix spectrum, because an array of LEDs could be used to match the desired part of the spectrum lightening them in sequence.
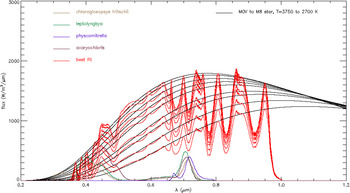
In collaboration with the Engineering Department of the Padova University we started a project to build a LED illuminator that is able to simulate the irradiation of an M0 star at different star–planet distances. We individuate the suitable LEDs for this aim. In Fig. 9, the radiation curves of these LEDs are superimposed on the black body curve representative of an M0 star at the top of the atmosphere of a planet at the distance of the inner limit of the correspondent HZ. The illuminator is under development and we are tackling some hardware and optical problems. First of all we need a homogeneous illumination of the reaction cell that has an acceptance window of 40 mm in diameters. A solution is to use an integrating sphere that produce in output a quasi-lambertian beam with a beam diameter a little bit greater than the reaction cell window.
The radiance curves of several LEDs useful to mimic the black body representative of the M stars (from M0 to M8 spectral type). The absorption spectra of several photosynthetic bacteria are also shown.

Conclusions
M stars are the new frontier for the search for life and this in despite of their activity in young age and faintness. On the other hand, M dwarf stars are very numerous in the Galaxy and also are simpler target in search for small planets with the transit technique. In fact, for the time being, some scores are gathered also in HZ of these stars. To handle remote sensing of the presence of life means to be able to individuate and interpret the biosignatures in the planetary spectra. In this paper, we discussed the difficulties and the possibility of a life system to thrive on a planet in the HZ of an M star. As result we were able to define a set of scientific requirements for physical quantities to be reproduced in a laboratory experiment. Moreover, we have outlined an experiment that is focused on the analysis of the formation of biosignatures in the atmosphere of a super earth orbiting an M0 star well inside its Hz. The experimental setup was tested with a gas mixture simulating the Mars atmosphere. With this ‘commissioning’ test we analyse the capacity of survivability of vegetative cells under the UV irradiation in simulated different Martian conditions. This experiment also gave useful information on the behaviour of the environmental chamber during several duty cycles. It also shows that various kinds of experiments may be performed in the simulator, from inorganic chemistry to biological activity. Furthermore we outlined how to reproduce the irradiation coming from a host star colder than our Sun.