INTRODUCTION
Accurate and precise chronologies of human occupation are crucial to elucidate if Neanderthals disappeared before Anatomically Modern Humans (AMH) reached the Iberian Peninsula (IP), or if both human types have co-existed and interbred, as deduced from anthropological, chronostratigraphic, and genetic evidence from Eastern Europe and Western Asia (e.g., Trinkaus, Reference Trinkaus2007; Sankararaman et al., Reference Sankararaman, Patterson, Li, Pääbo and Reich2012; Higham et al., Reference Higham, Douka, Wood, Ramsey, Brock, Basell and Camps2014; Hublin, Reference Hublin2015; Fu et al., Reference Fu, Posth, Hajdinjak, Petr, Mallick, Fernandes and Furtwängler2016), as well as to elucidate the causes of Neanderthal extinction. Paleoenvironmental change may have significantly affected hunter-gatherer groups, but this context can only be established if both geological archives of paleoenvironmental change and archeological evidence of human occupation can be reliably dated. Since few fossils of late Neanderthals and even less of early AMH have been found in the IP and few of these could be directly dated, chronological models rely on dating archeological levels defined by lithic industries of Mousterian or Aurignacian attributed to Neanderthals or AMH, respectively. In the respective time range, radiocarbon (14C) dating is near the analytical limit of the method and prone to contamination issues resulting from taphonomical problems with charcoal or bone samples, while other geochronological approaches provide results of limited precision. In addition, cultural attributions are not always unequivocal and the sedimentary context from which samples used for dating were taken is often poorly documented. Thus, the timing of the late Middle Paleolithic (LMP) and its attribution to late Neanderthals, as well as the appearance of early AMH in the IP, have been hotly debated topics of Paleolithic archeology and anthropology (e.g., Finlayson et al., Reference Finlayson, Giles Pacheco, Rodríguez-Vidal, Fa, Gutierrez López, Santiago Pérez, Finlayson, Allue, Preysler, Cáceres, Carrión, Fernández Jalvo, Gleed-Owen, Jimenez Espejo, López, López Sáez, Riquelme Cantal, Sánchez Marco, Giles Guzman, Brown, Fuentes, Valarino, Villalpando, Stringer, Martinez Ruiz and Sakamoto2006; Zilhão, Reference Zilhão2006; Maroto et al., Reference Maroto, Vaquero, Arrizabalaga, Baena, Baquedano, Jordá and Julià2012; Wood et al., Reference Wood, Barroso, Caparrós, Jordá-Pardo, Galván Santos and Higham2013).
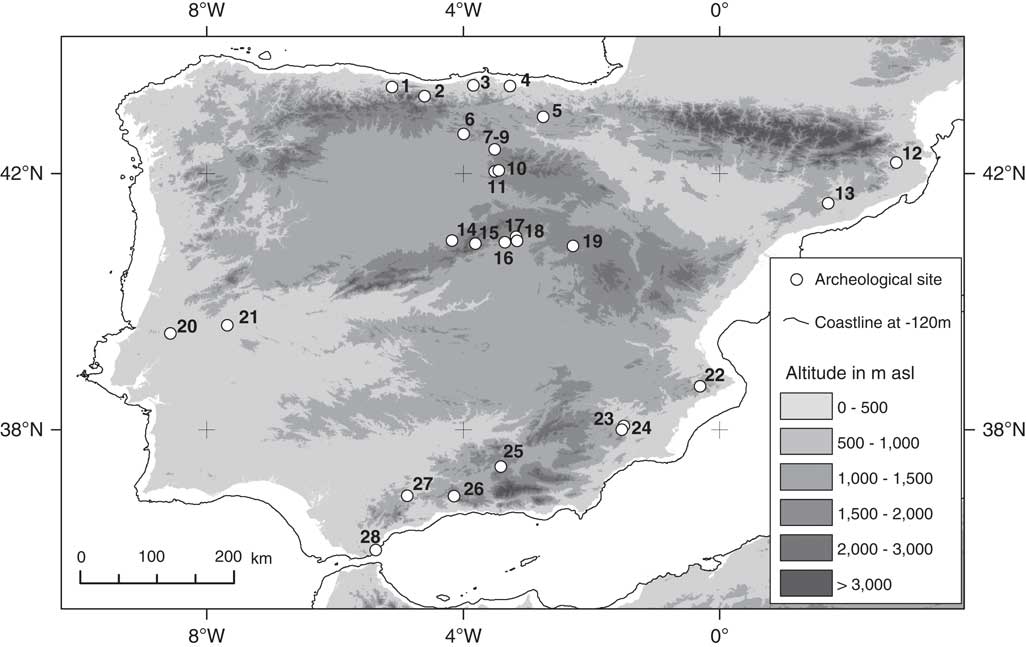
Several sites have been discussed in this context (Fig. 1) and numerous radiocarbon dates published on the timing of the LMP in Iberia (Supplementary Table 1). For Southern Iberia, a prolonged Neanderthal survival until about 32 ka has been postulated based on radiocarbon dating of sites such as Gorham’s cave (Finlayson et al., Reference Finlayson, Giles Pacheco, Rodríguez-Vidal, Fa, Gutierrez López, Santiago Pérez, Finlayson, Allue, Preysler, Cáceres, Carrión, Fernández Jalvo, Gleed-Owen, Jimenez Espejo, López, López Sáez, Riquelme Cantal, Sánchez Marco, Giles Guzman, Brown, Fuentes, Valarino, Villalpando, Stringer, Martinez Ruiz and Sakamoto2006), Boquete de Zafarraya (Hublin et al., Reference Hublin, Barroso-Ruiz, Lara, Fontugne and Reyss1995), or Carigüela (Fernández et al., Reference Fernández, Fuentes, Carrión, González-Sampériz, Montoya, Gil, Vega-Toscano and Riquelme2007). Recently, the accuracy of these young 14C dates was doubted because of possible age underestimation related to problems with site integrity, contamination with younger carbon from other sources, or poor preservation of collagen in bone (e.g., Jöris et al., Reference Jöris, Álvarez-Fernández and Weninger2003; Zilhão, Reference Zilhão2006; Wood et al., Reference Wood, Barroso, Caparrós, Jordá-Pardo, Galván Santos and Higham2013). Based on new dating studies, it appears more likely that Neanderthals disappeared from the south of the IP much earlier. At Gruta da Oliveira, Portugal, uranium series dating on three bone samples from the uppermost Mousterian layer, Level 8, gave ages between 34 and 40 ka (Hoffmann et al., Reference Hoffmann, Pike, Wainer and Zilhão2013). These dates corroborate 14C ages of about 38 ka cal BP on two pieces of burnt bone from the same level (Angelucci and Zilhão, Reference Angelucci and Zilhão2009). In addition, the in situ preserved artifact-rich Late Mousterian layer of Foz do Enxarrique was indirectly dated to about 38 ka, based on fading corrected potassium feldspar luminescence ages of overlying sands of the T5 alluvial terrace (Cunha et al., Reference Cunha, Martins, Huot, Murray and Raposo2008). Finally, two charcoal samples pretreated for 14C analysis using a more rigorous extraction method (ABox; Bird et al., Reference Bird, Ayliffe, Fifield, Turney, Cresswell, Barrows and David1999) from Mousterian level Ik of Cueva Antón and another one from directly below this gave ages between 35 and 37 ka cal BP (Wood et al., Reference Wood, Barroso, Caparrós, Jordá-Pardo, Galván Santos and Higham2013; Zilhão et al., Reference Zilhão, Ajas, Badal, Burow, Kehl, López-Sáez and Pimenta2016, Reference Zilhão, Anesin, Aubry, Badal, Cabanes, Kehl and Klasen2017). Recent studies on charcoal and faunal bone from Mousterian level UE at Boquete de Zafarraya gave 14C ages of 39 to 43 ka cal BP which agree well with results obtained by a combined uranium-series/electron spin resonance (U-series/ESR) approach on faunal bone dating the overlying Mousterian deposit within level UE to 30 to 46 ka (Michel et al., Reference Michel, Delanghe-Sabatier, Bard and Barroso Ruiz2013). Wood et al. (Reference Wood, Barroso, Caparrós, Jordá-Pardo, Galván Santos and Higham2013) screened a series of bone samples from Mousterian levels of Boquete de Zafarraya for collagen preservation and concluded that most of the bones are inappropriate for 14C dating due to intense or complete collagen degradation or possible contamination with young 14C. If collagen could be extracted, about 10 ka years older 14C ages could be obtained in some cases by applying the ultrafiltration method of the collagen fraction (Michel et al., Reference Michel, Delanghe-Sabatier, Bard and Barroso Ruiz2013). Few bone samples from archeological sites in Southern and Central Iberia fulfilled the criteria for sufficient collagen preservation, hence Wood et al. (Reference Wood, Barroso, Caparrós, Jordá-Pardo, Galván Santos and Higham2013) concluded that, particularly in Southern Spain, extreme care is needed in evaluating 14C results on bone.
The Iberian Peninsula with location of sites mentioned in the text: (1) La Güelga; (2) Esquilleu; (3) Cueva Morín; (4) El Cuco; (5) Cueva de Arrillor; (6) Valdegoba; (7) Hundidero; (8) Hotel California; (9) Galería de las Estatuas; (10) Cueva Millán; (11) Cueva de la Ermita; (12) Cueva de L’Arbreda; (13) Abric Romaní; (14) Abrigo del Molino; (15) Pinilla del Valle; (16) Jarama VI; (17) Peña Cabra; (18) Peña Capón; (19) Los Casares; (20) Gruta da Oliveira; (21) Foz do Enxarrique; (22) El Salt; (23) La Boja; (24) Cueva Antón; (25) La Carigüela; (26) Boquete de Zafarraya; (27) Sima de Las Palomas de Teba; and (28) Gorham’s Cave.

Similarly, poor preservation of charcoal and contamination with exogenous carbon poses problems at many archeological sites of the IP. Using other dating techniques than 14C to provide independent age control is thus crucial. Galván et al. (Reference Galván, Hernández, Mallol, Mercier, Sistiaga and Soler2014) dated sediment deposition of LMP occupations at El Salt, Alicante, using thermoluminescence (TL) and optically stimulated luminescence (OSL). Levels VIII to V middle including the uppermost Mousterian assemblages were dated to between 43 and 54 ka, if error margins are included. Depending on the luminescence techniques used, Kehl et al. (Reference Kehl, Burow, Cantalejo, Domínguez-Bella, Durán, Henselowsky and Klasen2016) determined a terminus ante quem for Mousterian layers at Sima de Las Palomas de Teba of 39.4±2.6 ka (OSL), 44.9±4.1 ka (pIRIR225, i.e. post-infrared infrared stimulated luminescence at 225°C), and 51.4±8.4 ka (TL), hence mostly before 40 ka. This would mean that Neanderthals disappeared before Heinrich Stadial 4 (H4), a time of comparatively dry and cold climatic conditions in the Iberian Peninsula (e.g., Fletcher and Sánchez-Goñi Reference Fletcher and Sánchez Goñi2008; Moreno et al., Reference Moreno, González-Sampériz, Morellón, Valero-Garcés and Fletcher2012, Reference Moreno, Svensson, Brooks, Connor, Engels, Fletcher and Genty2014; see also discussion in Schmidt et al., Reference Schmidt, Bradtmöller, Kehl, Pastoors, Tafelmaier, Weninger and Weniger2012). These examples illustrate that dating of the LMP and Late Neanderthals in Southern Spain is still a matter of dispute, and that independent age control is a major contribution to setting up chronological frameworks.
For Central Iberia, the presence of Neanderthals is documented in several stratified cave sites, such as Cueva Millán and Cueva de la Ermita (Díez Fernández and Navazo, Reference Díez Fernández-Lomana and Navazo Ruiz2005; Roselló and Morales, Reference Roselló Izquierdo and Morales Muñiz2005; Díez Fernández et al., Reference Díez Fernández, Alonso, Bengoechea, Colina, Jordá, Navazo, Ortíz, Pérez and Torres2008), Valdegoba (Quam et al., Reference Quam, Arsuaga, Bermudez de Castro, Díez, Lorenzo, Carretero, García and Ortega2001), and Los Casares (Barandiarán Maestu, Reference Barandiarán Maestu1969; Alcolea et al., Reference Alcolea, Balbín, García, García, Jiménez, Aldecoa and Casado1997; Alcaraz-Castaño et al., Reference Alcaraz-Castaño, Weniger, Alcolea, Andrés-Herrero, de, Baena, de Balbín and Bueno2015, 2017). In addition, a large number of open-air sites with Mousterian artifacts have been found (cf. Álvarez-Alonso et al., Reference Álvarez-Alonso, Andrés-Herrero, de, Díez-Herrero, Medialdea and Rojo2016). Recent radiocarbon and luminescence dating at Jarama VI (Kehl et al., Reference Kehl, Burow, Hilgers, Navazo, Pastoors, Weniger, Wood and Jordá-Pardo2013; Wood et al., Reference Wood, Barroso, Caparrós, Jordá-Pardo, Galván Santos and Higham2013, Jordá-Pardo et al., Reference Jordá-Pardo, Navazo and Díez Fernández-Lomana2014), as well as luminescence ages for Hotel California (Arnold et al., Reference Arnold, Demuro, Navazo, Benito-Calvo and Pérez-González2013), Hundidero (Carbonell et al., Reference Carbonell, Huguet, Cáceres, Lorenzo, Mosquera, Ollé and Rodríguez2014), Pinilla del Valle (Márquez et al., Reference Márquez, Mosquera, Panera, Bárez, Rus, Gómez and Arsuaga2008; Arsuaga et al., Reference Arsuaga, Baquedano, Pérez-González, Sala, Quam, Rodríguez and García2012), Galería de las Estatuas (Arsuaga el al., Reference Arsuaga, Gómez-Olivencia, Sala, Martínez-Pillado, Pablos, Bonmatí and Pantoja-Pérez2017), and Abrigo del Molino (Álvarez-Alonso et al., Reference Álvarez-Alonso, Andrés-Herrero, de, Díez-Herrero and Rojo2013, Reference Álvarez-Alonso, Andrés-Herrero, de, Díez-Herrero, Medialdea and Rojo2016b) place the LMP in Central Iberia before 45 ka. Afterwards, the dispersion of AMH into Central Iberia was apparently delayed for a long period of time. The earliest Upper Paleolithic assemblages were found at Peña Capón or Las Delicias and attributed to the Solutrean (Alcolea et al., Reference Alcolea, Balbín, García, García, Jiménez, Aldecoa and Casado1997; Alcaraz-Castaño et al., Reference Alcaraz-Castaño, López Recio, Roca, Tapias, Rus, Baena, Morín, Pérez-González and Santonja2012). New excavation at Peña Capón, however, yielded artifacts attributed to the Late Gravettian period (Alcaraz-Castaño, M., personal communication, Reference Alcaraz-Castaño, Alcolea-González, Kehl, Albert, Baena-Preysler, Balbín-Behrmann, Cuartero, Cuenca-Bescós, Jiménez-Barredo, López-Sáez, Piqué, Rodríguez-Antón, Yravedra and Weniger2017), which would be the earliest Upper Paleolithic in Central Iberia. Since the onset of the Gravettian culture in the IP is dated to about 33 ka (Schmidt et al. Reference Schmidt, Bradtmöller, Kehl, Pastoors, Tafelmaier, Weninger and Weniger2012; de la Peña, Reference de la Peña2013; Bicho et al., Reference Bicho, Marreiros, Cascalheira, Pereira and Haws2015; Bradtmöller et al., Reference Bradtmöller, Arrizabalaga, Calvo, Iriarte-Chiapusso and de la Peña2015), the missing Aurignacian in Central Iberia indicates a gap in occupation of several thousand years.
Abrigo del Molino is a recently discovered Middle Paleolithic rock-shelter located close to the city of Segovia on the northern foothills of the Central System separating the Duero and Tajo basins located to the north and south, respectively. Four excavation campaigns and ongoing sedimentological and geoarcheological studies have exposed a detailed sequence of sediment strata with several archeological levels bearing Mousterian industry artifacts (Álvarez-Alonso et al. Reference Álvarez-Alonso, Andrés-Herrero, de, Díez-Herrero and Rojo2013, Reference Álvarez-Alonso, Andrés-Herrero, de, Díez-Herrero and Rojo2014a, Reference Álvarez-Alonso, Andrés-Herrero, de, Díez-Herrero, Medialdea and Rojo2016). Álvarez-Alonso et al. (Reference Álvarez-Alonso, Andrés-Herrero, de, Díez-Herrero, Rojo, Medialdea, Benito and Vegas2014b, Reference Álvarez-Alonso, Andrés-Herrero, de, Díez-Herrero, Medialdea and Rojo2016) presented the stratigraphy and lithological properties of the sediment sequence as well as a model of site formation. First chronometrical results based on luminescence dating of sediment deposition were discussed, as well. Here, we present a set of 14C results and new luminescence ages, which place the sequence to the end of the LMP and of Neanderthal occupation in the IP and allows tight correlation with the global climate patterns of Greenland ice core and marine records. In addition, we report on micromorphological features of the deposits to further shed light on site formation processes.
SITE DESCRIPTION
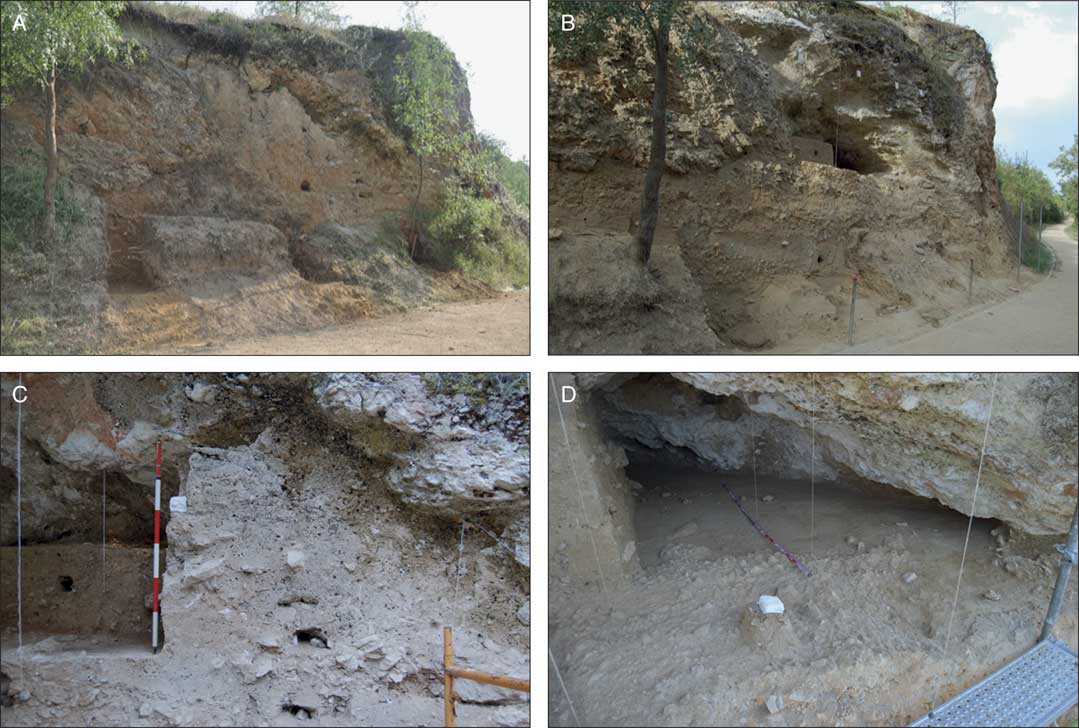
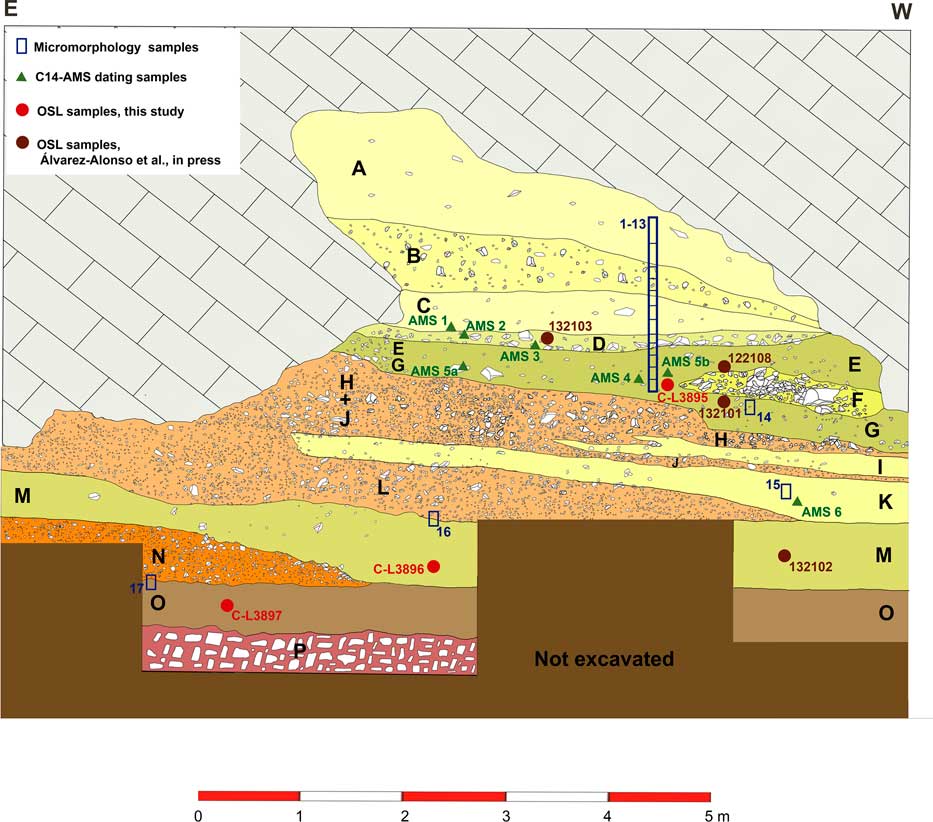
Abrigo del Molino (Fig. 2) is located on the northern piedmont of the Guadarrama Mountains, where the Central System slopes towards the Cenozoic basin of the northern plateau drained by the Duero River. The site consists of a cavity in Upper Cretaceous dolostone forming a small cliff on the southern embankments of the Eresma River flowing towards the west. Besides dolostone and other limestones, igneous rocks, including granodiorite, quartz monzonite, and orthogneiss, are found in the catchment of the river. During construction of a sewage collector in the early 1980s, the riverside part of the bedrock hosting the cavity was cut and an approximately 4.5-m-thick sequence of unconsolidated detrital sediments completely filling the cavity was exposed. In 2012, it was noticed that these sediments host archeological finds (Álvarez-Alonso et al., Reference Álvarez-Alonso, Andrés-Herrero, de, Díez-Herrero and Rojo2013, Reference Álvarez-Alonso, Andrés-Herrero, de, Díez-Herrero and Rojo2014a). The base of the sequence is located at about 11 m above the modern water level of Eresma River. Field inspection and sedimentological analyses of the sediment sequence resulted in the identification of 16 different lithological-sedimentological layers numbered A to P from top to bottom (Fig. 3). A detailed description and stratigraphic profile of these layers, as well as a reconstruction of the sequence of events during evolution and filling of the cavity, are presented by Álvarez-Alonso et al. (Reference Álvarez-Alonso, Andrés-Herrero, de, Díez-Herrero, Medialdea and Rojo2016). Here, we summarize the main characteristics of the stratigraphy from bottom to top and add additional field observation gathered during the 2015 excavation campaign.
(color online) The rock-shelter of Abrigo del Molino (A) at the start of excavation in 2013 and (B) after end of excavation in 2015. (C) The upper part of the sequence including levels A to G (2014). (D) Planum in archeological level 3 (layer E/G) with sample for micromorphology, in 2016. For dimensions of the site, please refer to Figure 3. Wires visible in photographs B, C, and D delineate square meter grid.

(color online) East-west stratigraphic profile with lithological layers A to P. Locations of radiocarbon samples (AMS1 to AMS6), luminescence samples 122108 and 132101–132103 (Álvarez-Alonso et al., Reference Álvarez-Alonso, Andrés-Herrero, de, Díez-Herrero, Medialdea and Rojo2016), and C-L3895-3897 (this study), as well as monoliths for preparation of thin sections are indicated. Vertical (and horizontal) scale is in meter.

The lower set of sediments (layers P to M) starts with layer P, characterized by a grain-supported fabric of angular gravel, stones, and few boulders with a silty to fine sandy matrix. This layer represents a transition zone between weathered bedrock and coarse textured colluvial debris. Layer O is a sequence of fine textured deposits unconformably covering layer P. It consists of silty sands and sands, as well as few coarser rock fragments (ellipsoidal rolling stones). Characteristic sedimentary structures including fine horizontal to cross laminations, current ripples, and climbing ripples; coarse textured sand layers suggest deposition during paleofloods as slack water deposits in eddy bars (Álvarez-Alonso et al., Reference Álvarez-Alonso, Andrés-Herrero, de, Díez-Herrero, Rojo, Medialdea, Benito and Vegas2014b). Layer O is a more or less horizontal layer reaching from east to west across the profile (Fig. 2B and 3). In the east, layer O is unconformably covered by a coarse-grained, clast-supported debris with silty matrix forming a wedge that thins towards the interior of the cavity. Layer N is better sorted than the coarse-grained deposits of the middle part of the sequence and many clasts have rounded shape. The accumulation itself was likely caused by mass movement along the slope transporting more or less coarse-grained rock fragments, but it is likely that these sediments were transported by river flow before being deposited in the cavity. To the west, silty sands of layer M directly cover the sands of layer O. Layer M shows a clear slope from east to west (Fig. 2B and 3). The sands of this layer may have been transported and sorted by fluvial action, but their final deposition within the cavity was by colluvial processes. In addition, intercalation of colluvial debris of layer N clearly shows that accumulation of both sand-rich layers occurred during different events.
The middle set includes layers L, J, and H, all being composed of grained-supported deposits with a silty matrix and showing upward coarsening. With increasing thickness towards the west, the two finer-grained layers of K and I are intercalated. It is likely that these finer deposits represent karst mudflows, while the coarser layers have been accumulating by mass transport along the slope and rockfall from the shelter roof.
The upper set starts with layer G and consists of silty, rather fine-grained deposits with few gravel, stones, or boulders, except for layer F, which forms an irregular lens of clast-supported angular to subangular debris with limited amounts of silt. This lens probably accumulated by roof fall, while the other layers represent a mixture of roof-fall, physical-chemical weathering products of the host rock, slope debris, and possibly even silty inputs by eolian dust. The uppermost horizontal laminations indicating deposition by runoff deposition are found in layer G. Near the top of the sequence in layers A and B cementation by carbonates shows backfill alteration and weathering of the host rock. All layers show a slope from east to west into the interior of the cavity. Therefore, the former opening and entrance for sediments and human beings was likely in the east of the cavity.
From an archeological point of view, we have divided the sequence taking into account its archeological and paleontological remains in order to have a better description of the human occupations. Level 1, without archeological remains, encompasses lithological layers A and B and includes some microfaunal remains in layer B. Level 2 with lithological layers C and D contains macro- and microfaunal remains, as well as lithic industry attributed to the Mousterian. At the base of layer D, there is a layer with clasts, an event of a rock fall, which allows us to separate level 2 and level 3. Level 3, comprising layers E, F, and G, contains a larger number of Mousterian lithics and macro- and microfaunal remains, mainly concentrating at the base of the level with lithological layer G. This layer merges with layer E (E+G) to the east of the site (Álvarez-Alonso et al., Reference Álvarez-Alonso, Andrés-Herrero, de, Díez-Herrero, Medialdea and Rojo2016; Fig. 2C).
Within lithological layer K, few artifacts of Mousterian affinity have been identified during profile cleaning. All other lithological layers are archeologically sterile at the present state of excavation.
METHODS
Excavation
Archeological level 2 (layers C+D) has been excavated on an area of 7 m2. The excavation of layers E and F is finished, whereas there is an area of less than 1 m2 that corresponds to level G, which has not been excavated yet. In total, the excavated area of level G is slightly greater than 11 m2, according to the current state of the excavation at the end of the 2016 campaign. Layer K has not been excavated yet and, therefore, no archeological data except of a few finds from profile cleaning are available for this layer.
The excavation was carried out by developing artificial layers less than 5 cm thick, adapted in all cases to the identified lithological layers. A general grid with 1 m2 squares was established to ensure appropriate excavation. Each square was subdivided into 9 sectors of 33.33 cm, with the aim of identifying the highest possible number of items in the archeological surface, ensuring exhaustive stratigraphic and spatial control. All lithic and faunal findings were coordinated with a total station, and all the sediments excavated were collected, identifying square, sector, layer, and level for their subsequent cleaning with water using a 2-mm mesh. This procedure allowed us to collect a large number of minuscule lithic and faunal remains, as well as a large amount of microfauna, enabling us not only to obtain more information on each level, but also to determine the existence of occupation floors, knapping areas or fire place areas.
Micromorphology
Several sediment monoliths were extracted in the field after reinforcing with gypsum bandages. After drying, saturation with artificial resin and hardening, a series of 22 thin sections were prepared according to methods described in Beckmann (Reference Beckmann1997). Flatbed scans of the thin sections were inspected at low magnification, while a petrographic microscope was used to study sediment composition and fabric at magnifications of 12–500×using plane polarized light (PPL) or crossed polarizers. In addition, oblique incident light (OIL) was used in some cases. The description of thin sections follows terminology suggested by Stoops (Reference Stoops2003). The sample locations and correlation with sediment layers are shown in Figure 3 and Supplementary Table 2, respectively.
Radiocarbon dating
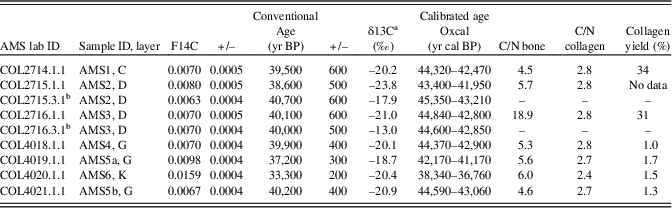
As depicted in Figures 3 and 4, three bone samples were taken from layers C and D in 2014 (samples AMS1 to AMS3, all showing cut and impact marks), and another three from layer E+G or G in 2015 (AMS4, AMS5a, and AMS5b). The latter two showed anthropic marks. These samples were collected from the interior of the site during excavation, whereas another bone sample (AMS6, with cutmarks) was taken from layer K at the surface of the profile. Collagen extracts were prepared according to Rethemeyer et al. (Reference Rethemeyer, Fülöp, Höfle, Wacker, Heinze, Hajdas, Patt, König, Stapper and Dewald2013), involving decalcification with HCl to remove bone mineral and exogenous carbonates followed by gelatinization and hot filtration through glass fiber filters. Ultrafiltration was tested for samples COL2715 and COL2516 (Table 1). As based on experience with bone from other Middle Paleolithic sites of the IP, differences between ultrafiltrated and non-ultrafiltrated bone samples were found to be negligible (see also Fülöp et al., Reference Fülöp, Heinze, John and Rethemeyer2013). All samples were tested for collagen preservation and quality using C/N elemental analyses of original bone and extracted collagen as well as collagen yields (Table 1). The N contents and C/N ratios of the bone samples were all >0.7 and >4, respectively, indicating relatively good collagen preservation (van Klinken, 1999; Brock et al., Reference Brock, Wood, Higham, Ditchfield, Bayliss and Bronk Ramsey2012). Although collagen yields of samples from layer G and K were relatively low (1.0–1.7 %), the quality of the collagen fraction of all samples was relatively good, indicated by C/N ratios of the collagen fraction between 2.4 to 2.8 (van Klinken, 1999). The freeze-dried collagen was converted to graphite targets (Rethemeyer et al., Reference Rethemeyer, Fülöp, Höfle, Wacker, Heinze, Hajdas, Patt, König, Stapper and Dewald2013) and 14C concentrations were measured on a 6 MV Tandetron accelerated mass spectrometer (AMS; High Voltage Engineering Europa B.V., The Netherlands) at the Cologne AMS facility (Dewald et al., Reference Dewald, Heinze, Jolie, Zilges, Dunai, Rethemeyer and Melles2013). The results of the measurements are reported in F14C including blank correction and normalization for isotopic fractionation.
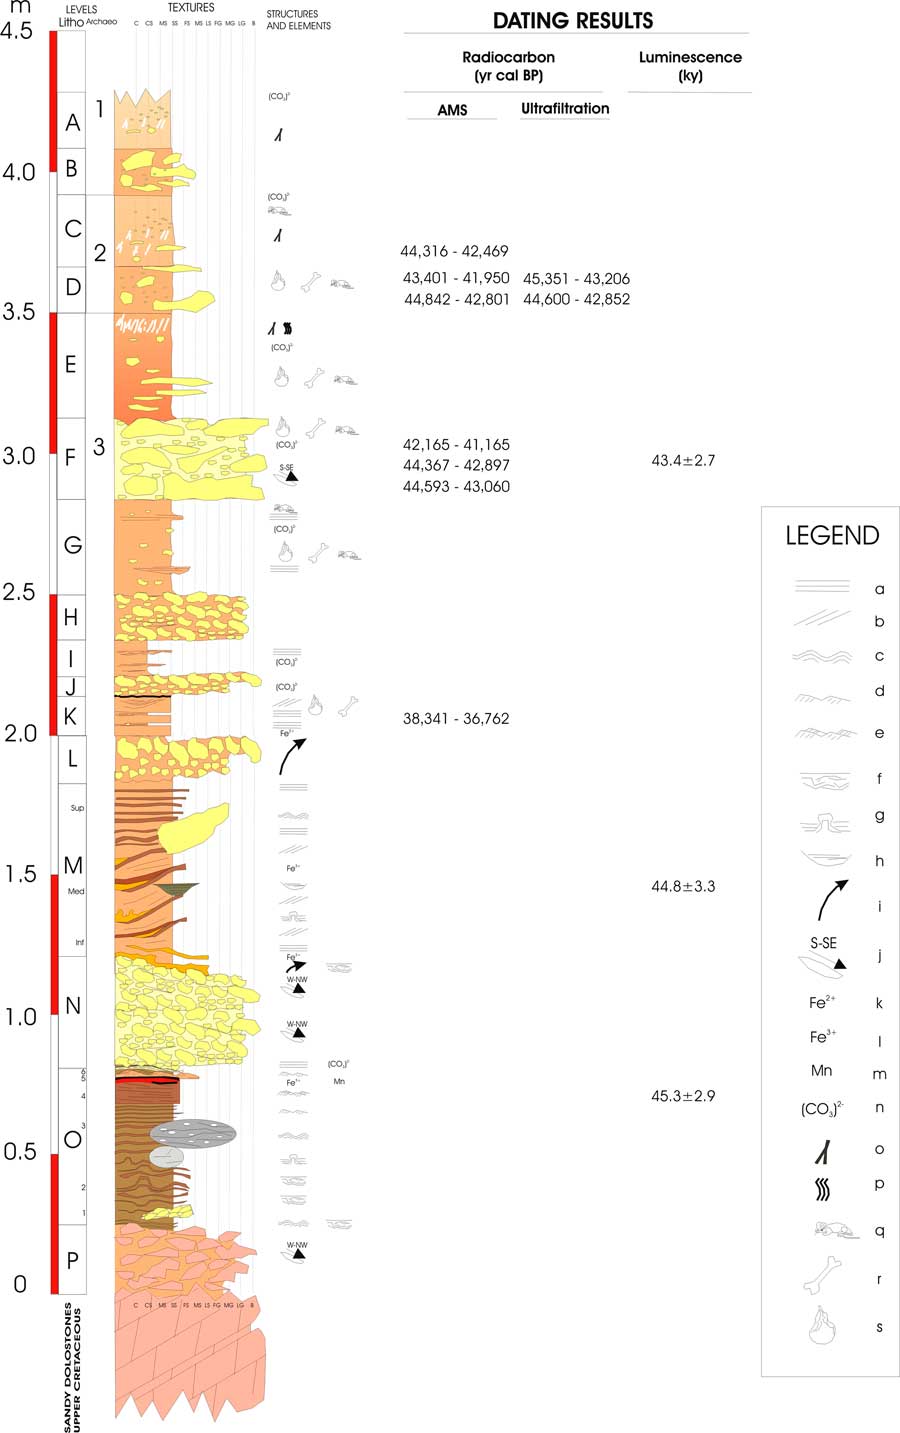
(color online) Stratigraphic column of Abrigo del Molino with results of radiocarbon and luminescence dating of this study. Symbol legend: (a) planar lamination; (b) cross lamination; (c) ondulated lamination; (d) current ripples; (e) climbing ripples; (f) deformation in lamination; (g) convolute lamination; (h) channelized structure; (i) coarsening upwards; (j) cardinal point of the pebble tilting; (k) ferrous iron enrichment; (l) ferric iron enrichment; (m) manganese enrichment; (n) carbonate enrichment; (o) rhyzoconcretions; (p) bioturbations; (q) micro-fauna remains; (r) macro-fauna remains; and (s) lithic industry.

Results of accelerator mass spectrometry (AMS) radiocarbon dating of bone samples from Abrigo del Molino including elemental analysis indicating bone and collagen quality.

a Measured with AMS.
b Ultrafiltration of collagen fraction.
The calibration of 14C dates was accomplished using OxCal v4.3.2 (Bronk Ramsey, Reference Bronk Ramsey2017) and the IntCal13 calibration curve (Reimer et al., Reference Reimer, Bard, Bayliss, Beck, Blackwell, Bronk Ramsey and Buck2013). In addition, OxCal was applied to run Bayesian modeling and outlier tests assuming that each sample has a 5% prior probability of being an outlier within the General t-type Outlier Model (Bronk Ramsey, Reference Bronk Ramsey2009). Finally, a table was compiled with published radiocarbon dates for Late Middle Paleolitithic levels at Iberian sites attributed to Châtelperronian or Mousterian technocomplexes (Supplementary Table 1).
Luminescence
Three luminescence samples were collected using steel tubes from levels G, M, and O (Fig. 3). Laboratory treatment included sieving to isolate the 100–150 µm (quartz) and 150–200 µm (feldspar) fractions, HCl (10%) to remove carbonates, H2O2 (10%) to remove organic material, and Na2C2O4 (0.01N) to remove clay as well as density separation (ρ=2.58 gcm–3 and ρ=2.65 gcm–3). The quartz fraction was extracted with hydrofluoric acid (37%, 40 minutes) plus a final HCl wash (10%, one hour). All measurements were carried out on an automated Risø TL/OSL DA 20 reader equipped with a calibrated 90Sr beta source. Blue-light emitting diodes (470 nm, FWHM=20) and a Hoya U 340 filter (7.5 mm) transmitting wavelengths of 330±40 nm were used for optical stimulation and signal detection of the quartz multi-grain aliquots (1 mm diameter of the grain layer). The single-aliquot regenerative-dose approach (SAR) was used for all measurements (Murray and Wintle, Reference Murray and Wintle2000, Reference Murray and Wintle2003).
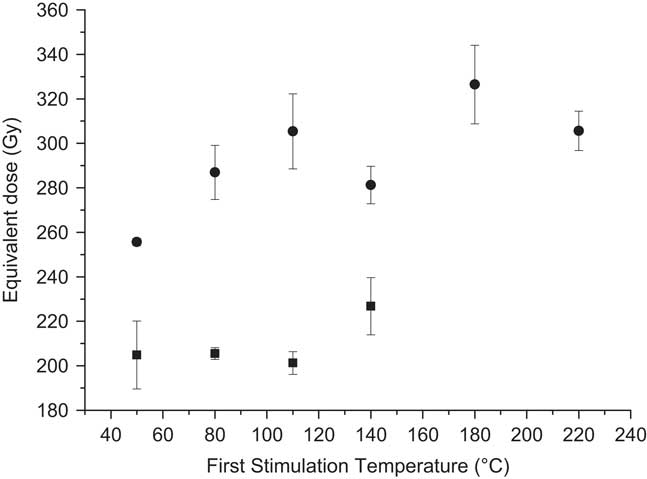
The multi-grain feldspar aliquots (1 mm) were stimulated with infrared diodes (870 nm, FWHM=40) and the signals were detected through an interference filter (410 nm). An elevated temperature infrared stimulated luminescence signal (pIRIR) was used (Buylaert et al., Reference Buylaert, Murray, Thomsen and Jain2009). The most appropriate prior-IR stimulation temperature was obtained in a laboratory experiment (Buylaert et al., Reference Buylaert, Jain, Murray, Thomsen, Thiel and Sohbati2012) using a range of different temperatures from 50 –250°C (25°C steps). The initial 4 s of the signal minus a background of the last 20 s was used for feldspar dating.
To test the performance of the pIRIR protocol further, a dose recovery test was carried out. For this dose recovery test, the samples were illuminated for 24 h in a Hönle Sol2 solar simulator followed by beta irradiation of 270 Gy (C-L3895) and 420 Gy (C-L3897). The prior IR stimulation temperature was kept constant at 50°C and pIRIR stimulation tracked the preheat temperature by –20°C. The laboratory dose was subsequently recovered. Fading was measured following the approach of Auclair et al. (Reference Auclair, Lamothe and Huot2003).
Data analyses were performed using the Risø Luminescence Analyst software (version 4.31.9). Equivalent doses were calculated with an arithmetic mean. The radionuclide concentrations were measured using high-resolution gamma ray spectrometry. In situ measurements were not performed. The gamma dose rate of sample C-L3896 was additionally calculated by combining the gamma dose rates from layer M, where the sample was collected and from layer O, below. We have assumed equal gamma dose rate contributions (50%) from both layers for simplification. The dose rate was calculated with DRAC v1.2 (Durcan et al., Reference Durcan, King and Duller2015) using conversion factors of Guerin et al. (Reference Guerin, Mercier and Adamiec2011), a measured a-value of 0.06±0.02 and the measured water content. The internal beta dose rate contribution of the feldspar samples was calculated by assuming a potassium content of 12.5±0.5% (Huntley and Baril, Reference Huntley and Baril1997). The cosmic dose rate was calculated following Prescott and Hutton (Reference Prescott and Hutton1994).
RESULTS
Archeological finds
The excavation and analysis of the site are still in progress, but archeological remains demonstrate that the rock shelter was occupied by Neanderthal groups at least in three different periods in time, i.e., during accumulation of level 2 (layers C and D), level 3 (layers E, F, and G), and layer K.
The analysis of the chaînes opératoires in levels 2 and 3 present many similarities, although the collections at level 3 (N>1200), where more than 50% of the pieces are smaller than 2 cm, are larger than at level 2 (N>160), where more or less 70% of the pieces are small.
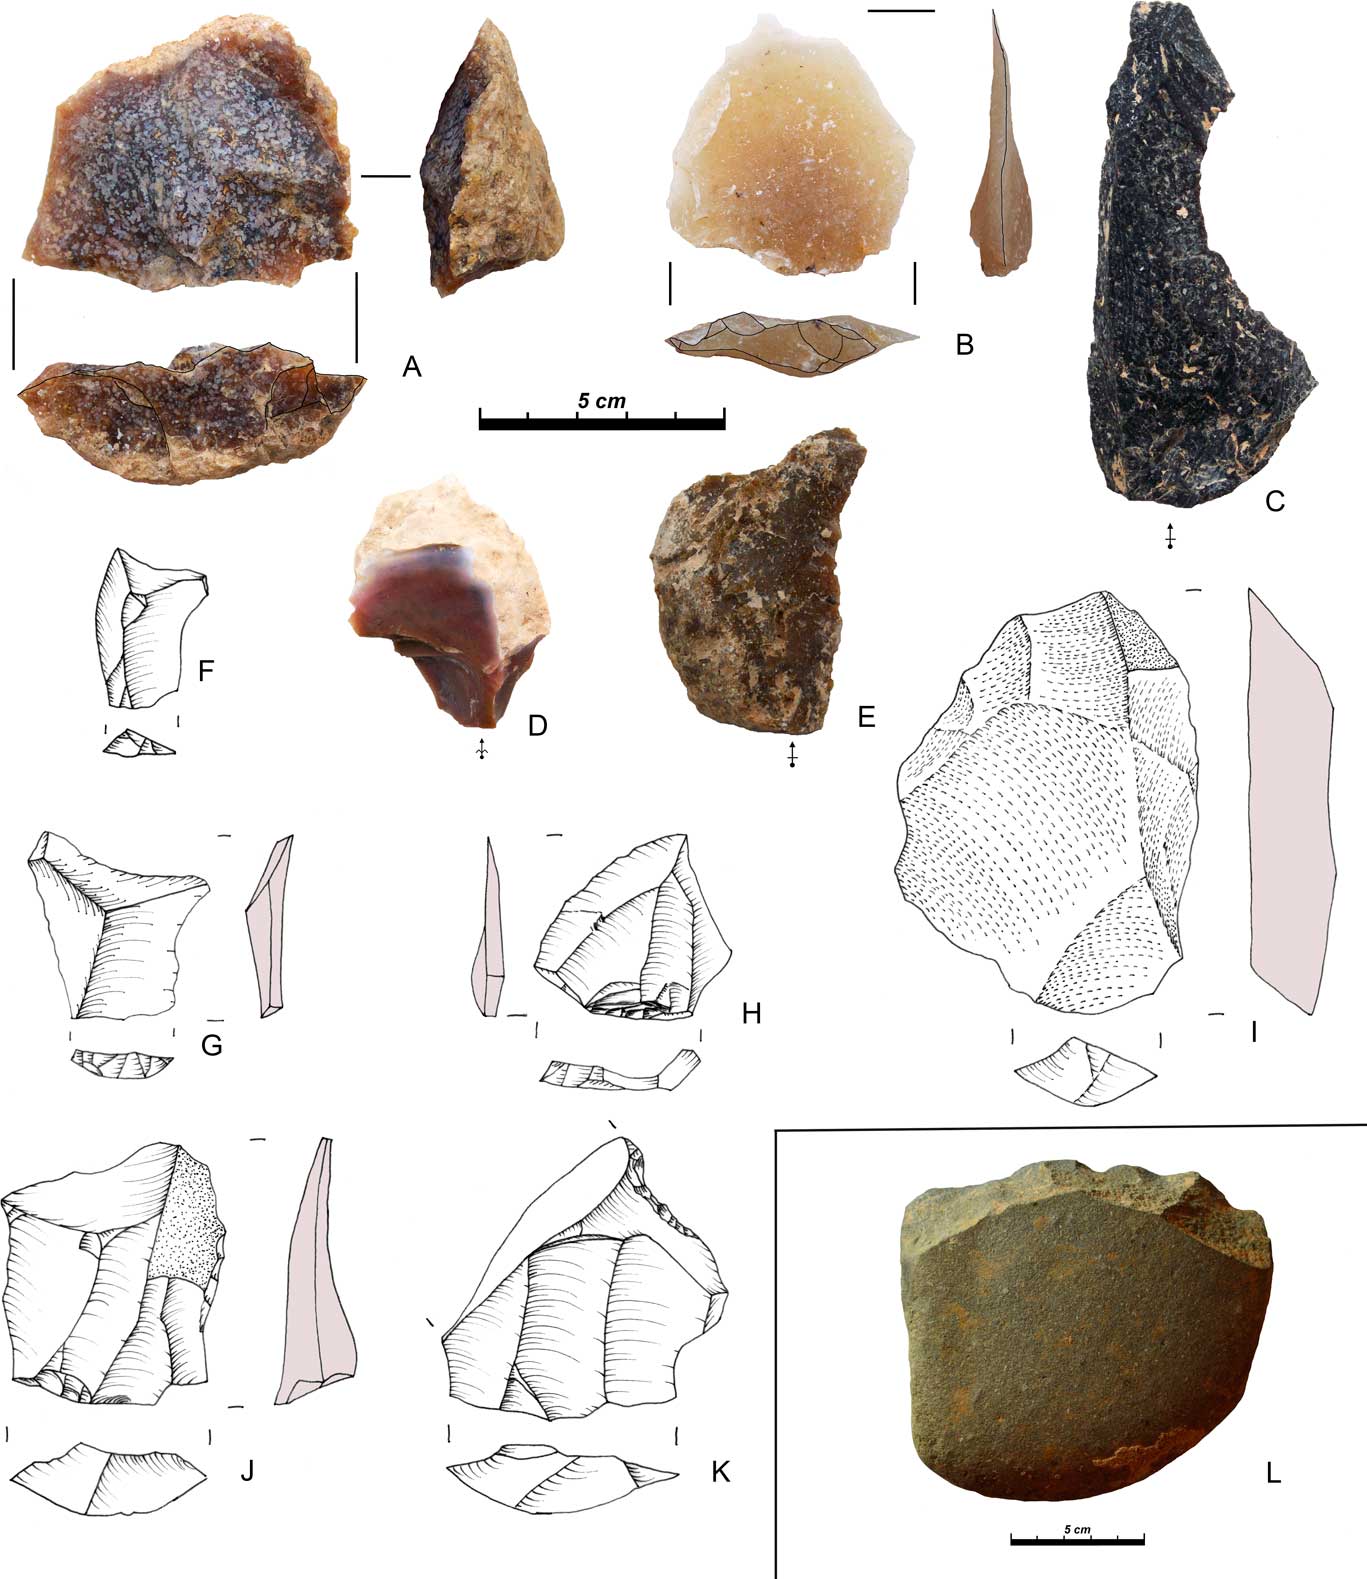
Regarding the identified toolkit, it comprises few pieces, essentially denticulates and notches, with a high presence of choppers (Fig. 5 L). Different Levallois products were identified at both levels, especially at level 3 (Fig. 4). This technique and the discoid method represent the two main types of lithic exploitation recorded at the site. Concerning the chaînes opératoires, there are two essential ones: the first one was focused on obtaining flakes, essentially in flint, and using Levallois and discoid methods; and the second one aimed at obtaining choppers or chopping tools, mainly in diorite. As for the integrity of the chaînes opératoires, we can affirm that there is a high level of integrity, due to the number and variety of the documented remains (hammers, cores, flakes, debris, and preparation products of different types), and because of the presence in the site of all the different stages of the knapping process (i.e., roughing, preparation, conditioning, and production). All these characteristics indicate the development of knapping processes inside the rock-shelter (Álvarez-Alonso et al., Reference Álvarez-Alonso, Andrés-Herrero, de, Díez-Herrero, Medialdea and Rojo2016).
Concerning lithic raw material procurement, the greater part of the raw materials has a local component, with an immediate catchment in the Eresma river valley and its surroundings (quartz, granite, gneiss, diorite, some flints). More than the 70% of the raw materials can be easily found in a 17-km radius from the site. Thus, if we calculate a catchment area of 4 hours from the site (Kelly, Reference Kelly2013), we can check that a high number of lithic resources that are present in the site are inside this area. The provenience of some of the siliceous materials used at the site still remains unknown, however, which suggests medium- and long-distance logistical planning within a wider territory would be combined (Álvarez-Alonso et al., Reference Álvarez-Alonso, Andrés-Herrero, de, Díez-Herrero, Medialdea and Rojo2016).
On the other hand, both levels 3 (N>4200) and 2 (N>270) showed a high degree of fragmentation of macromammal remains, with more or less 50% of fragments smaller than 1 cm. In both the levels, cut, fleshing, and percussion marks are documented in at least 10% of the remains larger than 1 cm. Although carnivore marks have also been recorded, there are very few, amounting to less than 1% of the sample, and they consist mainly of a secondary access to the resource. Regarding taxonomic identification, it has been difficult due to the high fragmentation of the bones and the lack of teeth and epiphysis in the record. Nonetheless, it was possible to confirm the presence of Equus sp. in level 2 (C+D); and Bos/Bison, Equus sp., and Cervus elaphus, as main taxa at level 3 (E+F+G; Álvarez-Alonso et al., Reference Álvarez-Alonso, Andrés-Herrero, de, Díez-Herrero, Medialdea and Rojo2016).
(color online) Lithic pieces from level 3: (A) Levallois core made on a flake; (B, F–J) Levallois flakes; (C–E) Flakes; (K) denticulate made on a Levallois flake; (L) chopper. Raw materials: (A–D) flint; (K) diorite; and (E) jasper.

Micromorphology
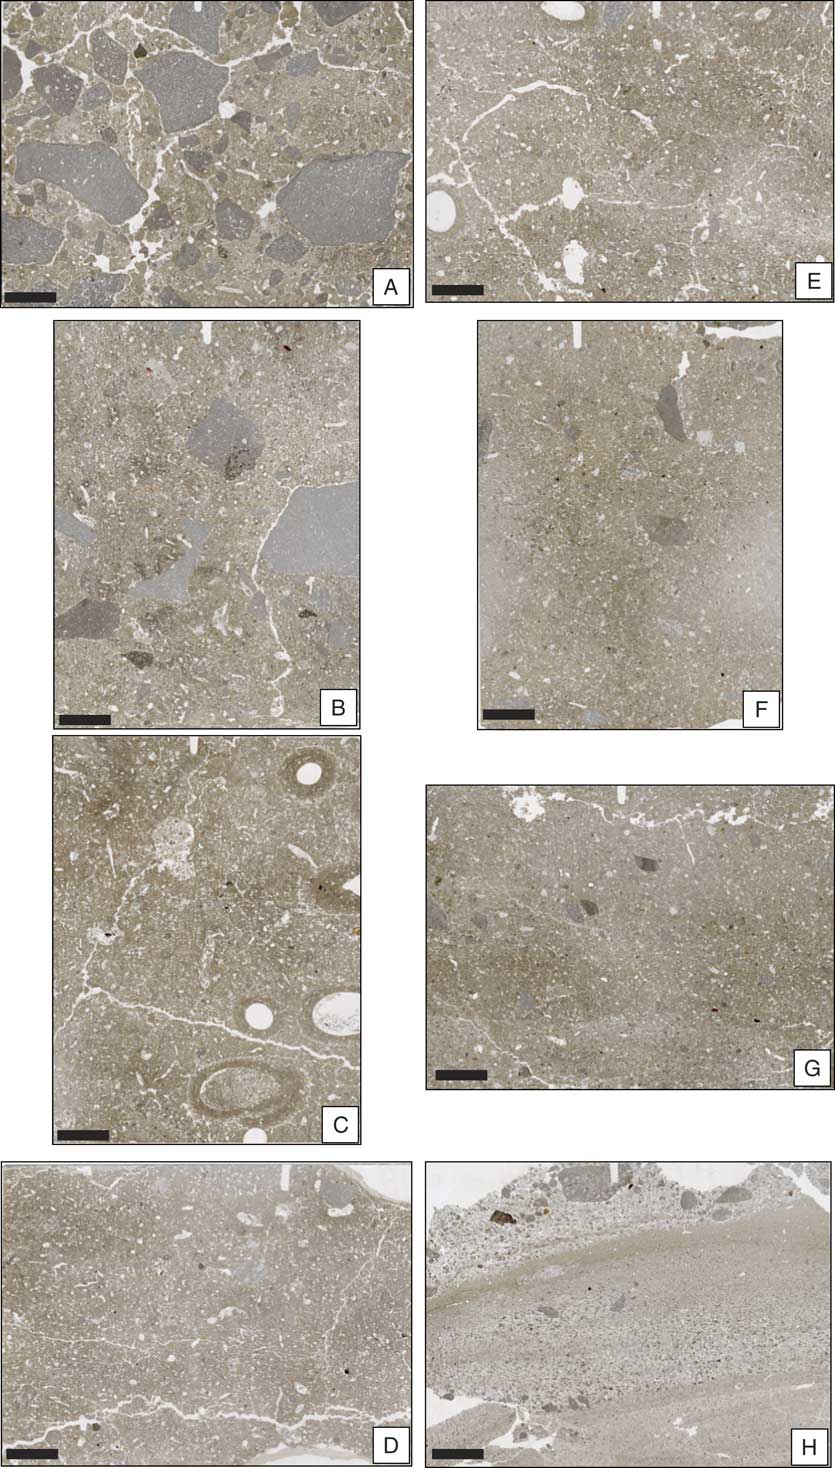
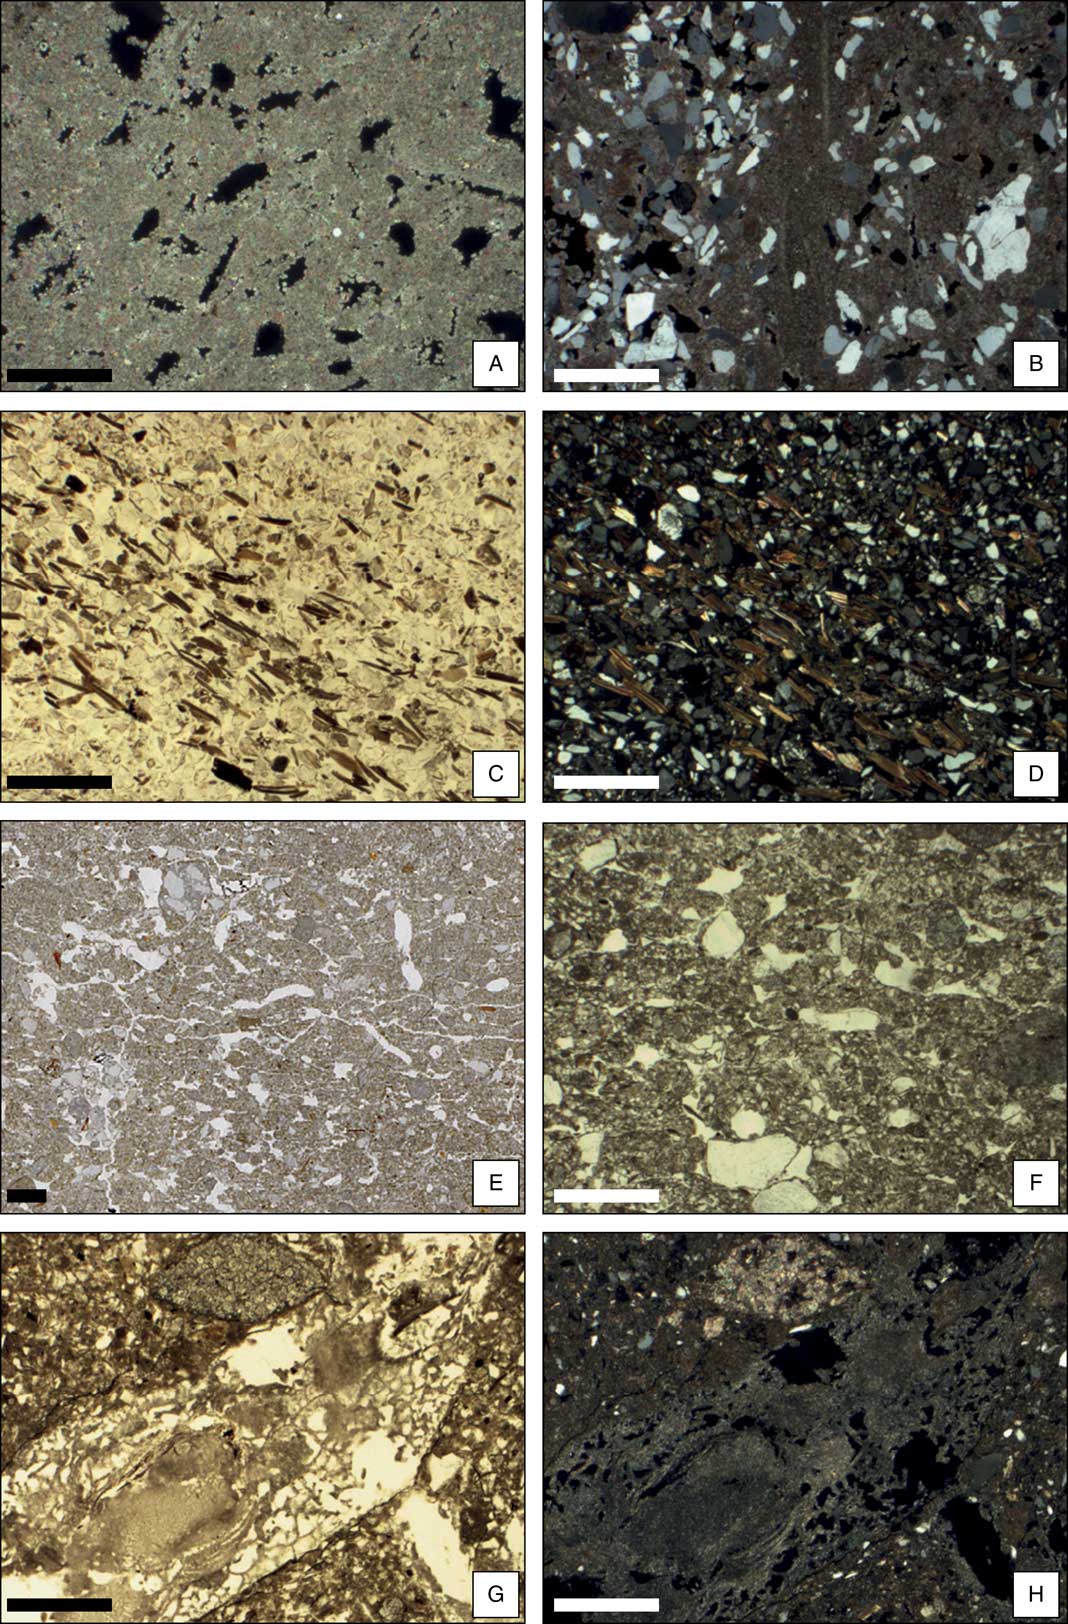
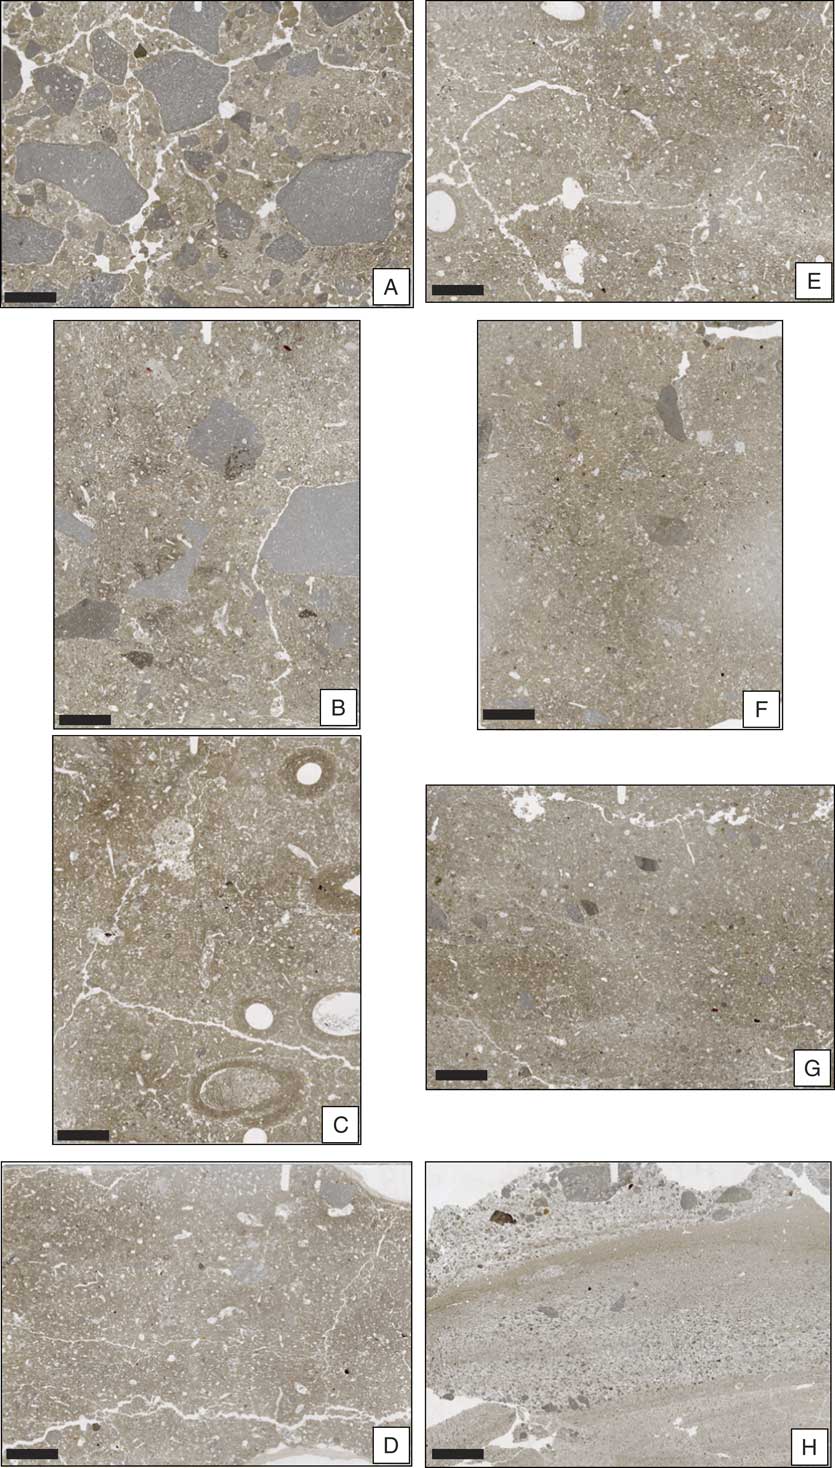
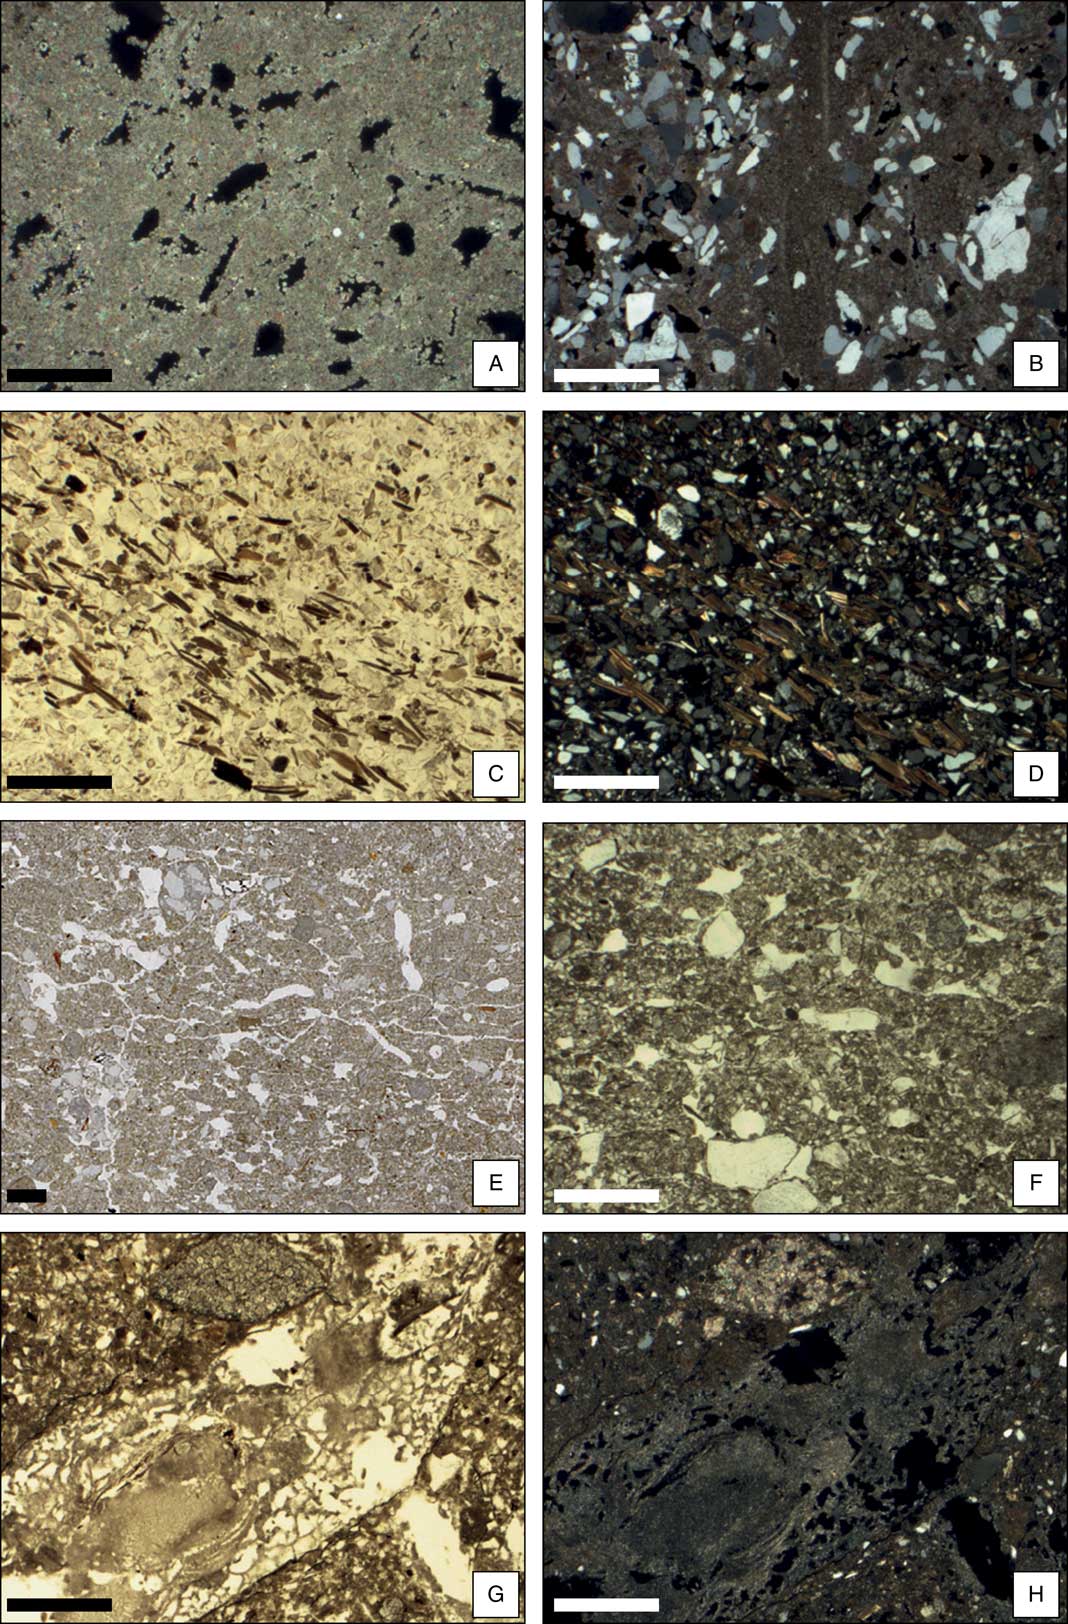
Detailed micromorphological descriptions of the thin sections are presented in Supplementary Table 2, while Figures 6A–6H and 7A–7H show selected thin section scans and micrographs, respectively. The coarse material, including grain sizes of medium and coarse silt, as well as sand and fine gravel, mainly consists of dolostone rock fragments. While few of these fragments are dense and monomineralic, most of them contain various amounts of irregular pores and angular, partly elongate quartz grains, which may be concentrated in quartz-rich microlayers (Fig. 7A and B). These petrographic features are typical for the Segovia dolostones. The sand and silt fractions, besides being rich in dolostone fragments, dolomite and calcite grains, are mainly composed of quartz, mica, and feldspar. The content and size of micas show a tendency to increase with depth attaining the highest levels and crystal sizes in the fluvial deposits of level O (Fig. 7C and D). Locally, granite or granodiorite rock fragments of sand size were found in thin sections from layer K and L/M.
Selected flatbed scans of thin sections (ts). (A) Archeologically sterile deposits of layer A, showing roof-fall debris of dolostone, pore infillings of secondary calcite, and a moderately developed blocky microstructure (ts AM2). (B) Thin section AM7.2 from archeological level 2 (layer C), grey patches result from precipitation of secondary carbonate. (C) Insect burrows in the uppermost part of archeological level 3 (layer E, ts AM10). Note the weakly developed lenticular microstructure. Large circular burrows with textural hypocoatings are probably related to wasps. (D) Clearly developed lenticular and partly platy microstructure in layer G (archeological level 3, ts AM12). Small pieces of charcoal. (E) Similar to D and including some large burrows and passage features (ts AM14.1, layer G, and level 3). (F) Densely compacted sediment of layer K (ts AM15.2). (G) Boundary between the densely packed slope deposits of layers M and N (ts AM16.2). (H) Fluvial deposits of layer O (ts AM17.1). Note the difference in fabric compared to the lower part of G. The scale bar is 10 mm. (For interpretations of the references to color in this figure legend, the reader is referred to the web version of this article.)
(color online) Micrographs of selected micromorphological details. (A) Porous dolostone in layer C (ts AM2, layer A, circular polarized light). (B) Quartz grains in dolostone (ts AM2, layer A, circular polarized light). (C) Mica rich microlayer in finely layered fluvial deposits of layer O (ts AM17.2, plane polarized light). (D) Same as C, but circular polarized light. (E) Detail of flatbed scan showing small rounded or elongate aggregates and a lenticular microstructure (ts AM12, layer G). (F) Micrograph showing weakly developed lenticular microstructure at the top of layer G (ts AM10, plane polarized light). (G) Incomplete infillings of micritic and needle-fibre calcite in layer A (ts AM2). (H) Same as G, but crossed polarizers. The scale bar in A–F is 1000 µm, in G and H 500 µm.
Very few materials other than mineral grains were detected. In thin sections AM11, AM12 (Fig. 6D), AM13.1, and AM13.2 from layer G, few pieces of charcoal were present, while very few, tiny pieces of bone were found in several thin sections from other layers as well. Locally, small remnants of modern roots were detected.
The micromass showed light-grey color and dotted limpidity in all thin sections. The birefringence-fabric was crystallitic throughout due to abundant micrite. Thin sections from the sandy loams of layers G, K, and L/M showed higher micromass contents than all other thin sections, corresponding with a single-spaced porphyric to open porphyric coarse/fine related distribution pattern (rdp), while other layers had a monic or single-spaced rdp.
Thin sections from the upper part of the sequence (layers A to G) displayed many different kinds of pores, including simple or complex packing voids, vughs, channels, and burrows (Fig. 6A–E). The latter two types are lacking in thin sections from the lower part where few vughs and planes (layers K and L/M; Fig. 6F and G) or simple packing voids (layer O, Fig. 6H) were present. Interesting to note is the presence of elongate and locally rounded peds, separated by moderately well-accomodating planes or complex packing voids, which result in a clearly developed lenticular and locally platy microstructure in thin sections from layers G and L/M (Fig. 7E and F). The porosity ranged from very low to high, being low to moderately high in the fluvial deposits of layer O, very low to low in the slope deposits of layer L/M and K, and high to very high in thin sections from layers G, D, and A, B, C, respectively. The microstructure types included subangular blocky, granular, channel, or vughy in the upper part; vughy, platy, and lenticular in the middle part; and coarse monic in the lowermost part.
The most common pedofeatures were incomplete infillings and coatings of micritic or needle-fiber calcite (Fig. 7G and H) as well as hypocoatings and few nodules containing micritic calcite. These are abundant in thin sections 2 and 5 from lithological layers A and B. In addition, many burrows and passage features were found in this part of the sequence. Large circular empty burrows surrounded by densely packed mineral grain hypo coatings are insect burrows probably of wasps (Fig. 6C), observed in thin sections from layers D, E, and G (Supplementary Table 1). In the lower part of the sequence, few typical nodules of manganese oxide or iron hydroxide were found.
Radiocarbon dating
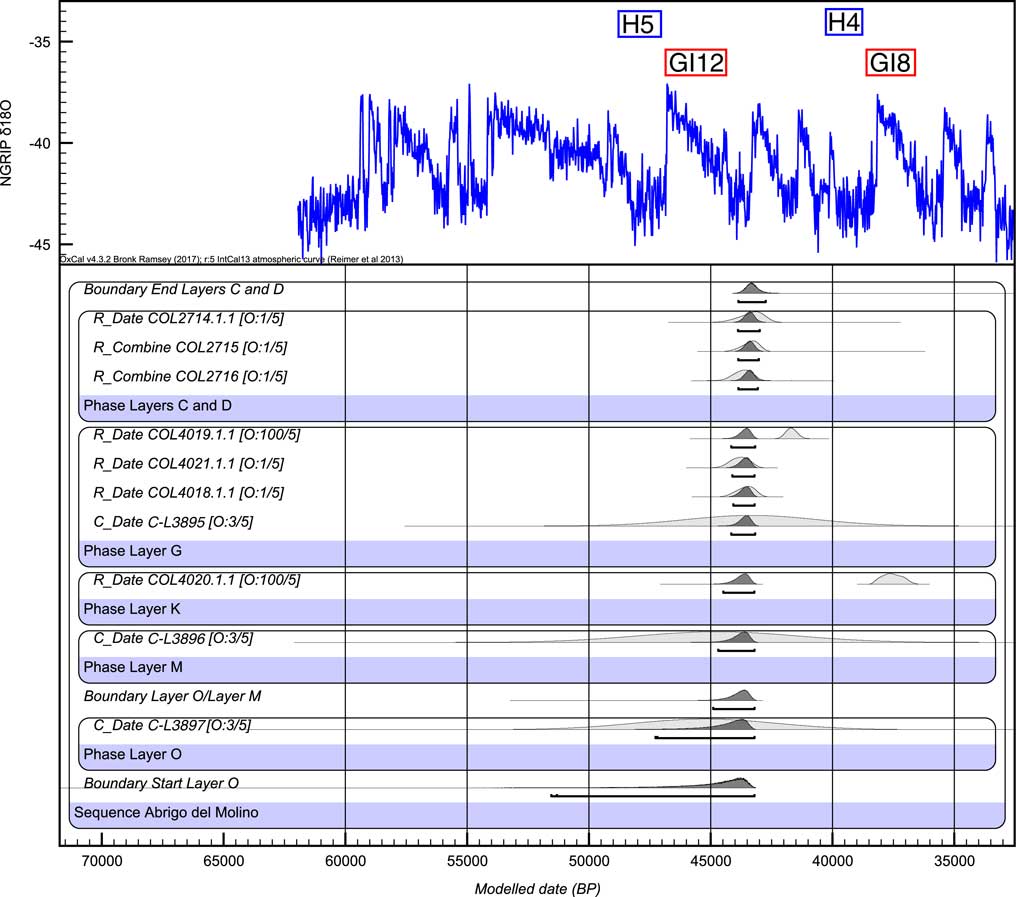
The conventional radiocarbon ages for bone samples from archeological levels 2 and 3 range from 37,200±310 14C yr BP (COL4019.1.1) to 40,700±400 14C yr BP (COL4015.3.1; Table 1). After calibration, the 95.4% probability intervals for these dates overlap and range from 41.2 ka cal BP to 45.4 ka cal BP. Among these, sample COL4019.1.1 yielded a comparatively lower age, but still with overlap of the 95.4% interval (Fig. 8). According to Bayesian modelling, there is a 100% probability that COL4019.1.1 is an outlier (Fig. 8, Supplementary Table 3). The stratigraphically lowermost sample, COL4020.1.1, extracted from layer K gave the lowest age of 36.4 to 34.8 ka cal BP (Fig. 5, Table 1) and clearly classifies as an outlier (Fig. 8, Supplementary Table 3). This age inversion possibly relates to the fact that the sample was taken from the surface of the profile near a root and may represent an intrusion from overlying layers. In addition, collagen of COL4020.1.1 has a low C/N ratio indicating less preservation of collagen.
(color online) Calibrated radiocarbon ages for seven human modified bones presented in this paper and shown in stratigraphic order from top to bottom shown in light grey. The 95.4% probability interval is indicated below the probability density distributions. Calibration was accomplished using OxCal 4.3.2 (Bronk Ramsey, Reference Bronk Ramsey2017) and the IntCal13 calibration curve (Reimer et al., Reference Reimer, Bard, Bayliss, Beck, Blackwell, Bronk Ramsey and Buck2013). Modelled ages were obtained assuming each sample has a 5% prior probability of being an outlier within the General t-type Outlier Model (Bronk Ramsey, Reference Bronk Ramsey2009). Samples COL2715 and COL2716 were measured with and without ultrafiltration. Using the R-combine function of OxCal none of them classifies as an outlier. Note that samples COL4020.1.1 and COL4019.1.1 have 100% probabilities to be outliers. For combined modeling, the pIRIR250 luminescence ages were included. The oxygen isotope record of North Greenland Ice Core Project (NGRIP) was plotted as implemented in OxCal 4.3 for comparison with the global climate record. Greenland Interstadials GI12 and GI8 (Rasmussen et al., Reference Rasmussen, Bigler, Blockley, Blunier, Buchardt, Clausen and Cvijanovic2014) and Heinrich Stadials H5 and H4 (Sánchez Goñi and Harrison, Reference Sánchez Goñi and Harrison2010) are indicated for orientation.
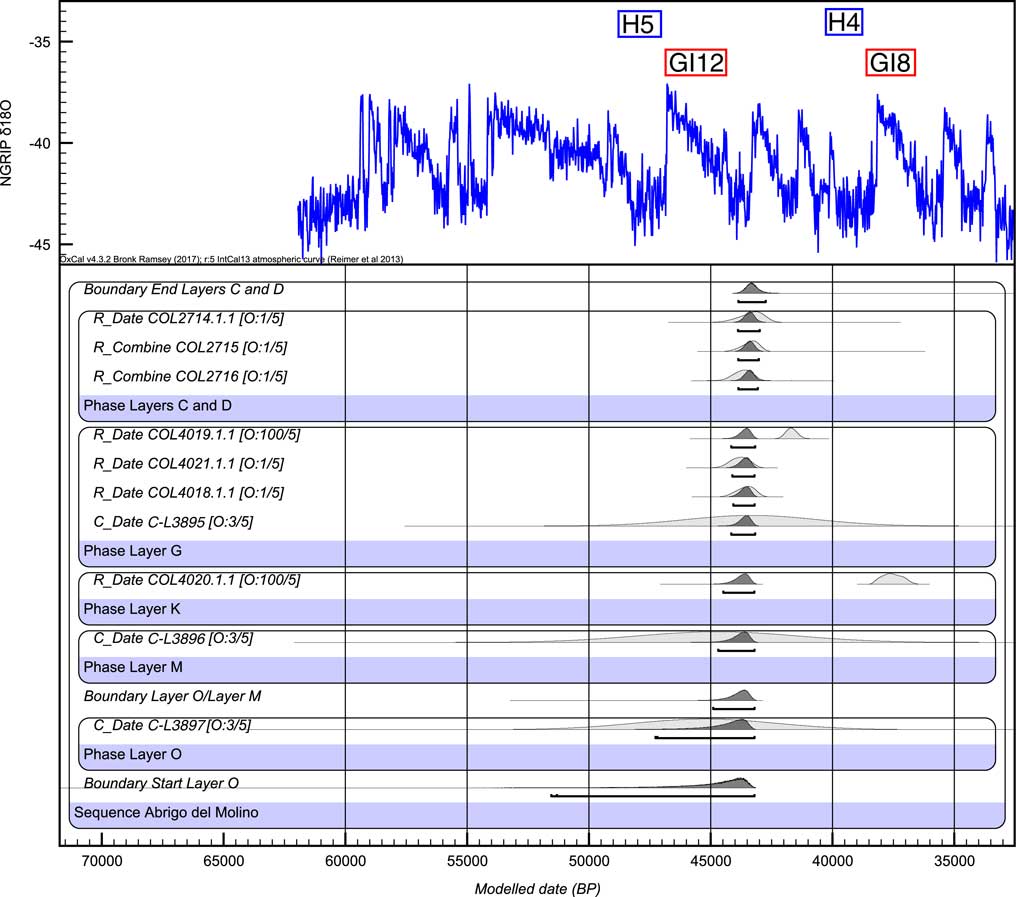
The difference between applying ultrafiltration or not is negligible in the case of COL2016, which yielded virtually the same ages independent of pretreatment. Ultrafiltration of COL2015 gave an age about 2 ka older than without ultrafiltration. After combining the two results of COL2015 using the R-combine function of OxCal, the resulting average was not identified as an outlier, but nicely fits into the modeled age range. OxCal gives a warning, however, that the two dates of COL2015 are statistically different from each other on a 5% level according to the chi-square test.
Luminescence dating
First measurements showed that the quartz OSL signal of all three samples is in saturation and no further measurements were carried out (Supplementary Figure 1).
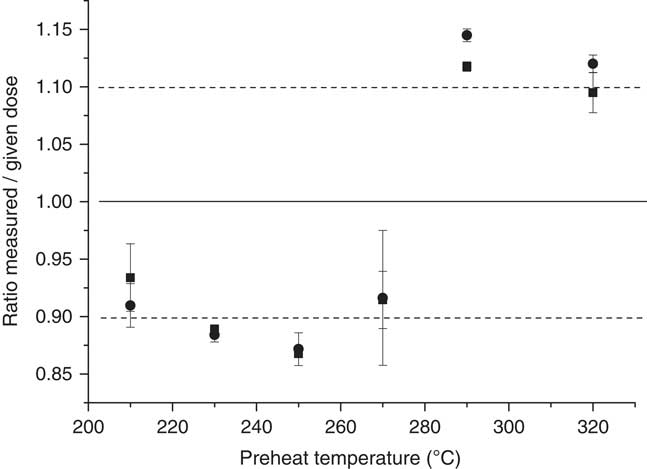
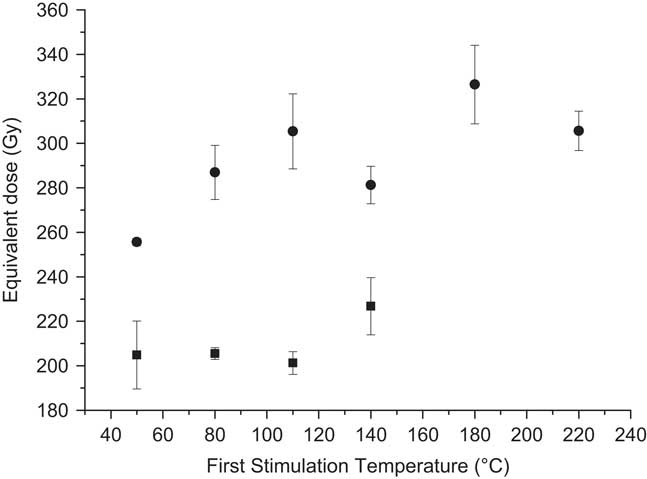
Feldspar samples were measured using a pIRIR protocol measured at 250°C. This temperature was chosen according to the results of a prior IR stimulation temperature test (Fig. 9) and a dose recovery test (Fig. 10). The prior-IR stimulation temperature was set to 50°C. Fading tests were carried out and g-values of 1.53±0.24% (C-L3895), 1.99±0.21% (C-L3896), and 0.71±0.24% decade (C-L3897) per decade were calculated. From bottom to top, the pIRIR250 stimulation resulted in sediment deposition ages of 45.3±2.9 ka (C-L3897) and 44.8±3.3 ka (C-L3896) for archeologically sterile layers O and M, respectively, as well as 43.4±2.7 ka (C-L3895) for layer E/G from archeological level 3 (Table 2). Combining the gamma dose rate of sample C-L386 did not have significant effect. By assuming a maximum contribution of 50% of the gamma dose rate from layer O, the total dose rate increased by 5%, resulting in an age of 42.6±3.2 ka. The actual gamma dose rate contribution of layer O is probably smaller, given the sampling location of C-L3896, which means that the increase of the total dose rate is also smaller. Therewith, the effect on the pIRIR250 age is not significant.
Prior-IR (pIRIR) stimulation temperature test of feldspar sample C-L3895 using pIR50IR250 (square) and pIR50IR290 (circle) stimulation. The preheat and pIRIR temperatures were kept constant at 270°C/250°C (square) and 320°C/290°C (circle) and the prior IR stimulation temperature was constantly increased from 50°C to 140°C (220°C). The results show that only the pIRIR250 signal is independent from the prior IR stimulation temperature, which indicates a stable signal.
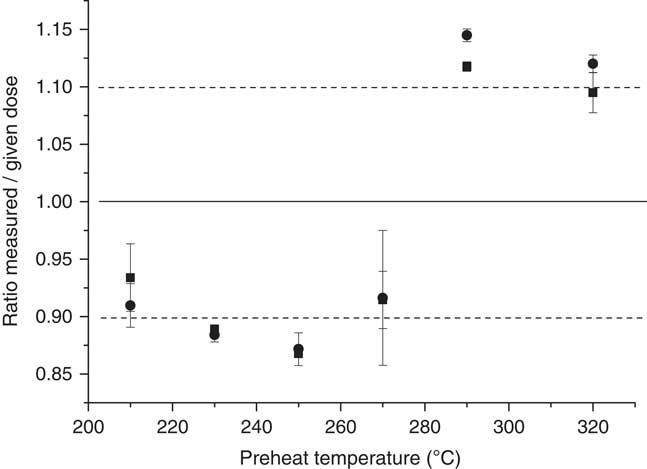
Dose recovery test of feldspar samples C-L3895 (square) and C-L3897 (circle). The prior-IR (pIRIR) stimulation temperature tracked the preheat temperature by –20°C. The samples were bleached for 24 h in the solar simulator and were artificially dosed with beta doses in the range of the natural dose. The laboratory given dose was recovered with a ratio of the measured to the given dose of 0.91±0.02 (C-L3895) and 0.91±0.06 (C-L3897) for pIR50IR250 stimulation.
Dose rate data, dose distribution characteristics, equivalent dose values and luminescence ages. m.b.s, meters below surface; KF, potassium feldspar; Moisture %, measured water content (water mass over dry sediment mass); U, uranium; Th, thorium; K, potassium. Age calculation is based on cosmic dose calculation after Prescott and Hutton (Reference Prescott and Hutton1994), conversion factors of Guerin et al. (Reference Guerin, Mercier and Adamiec2011) and the measured water content using DRAC v1.2 (Durcan et al., Reference Durcan, King and Duller2015). RSD, relative standard deviation; De, equivalent dose. The internal beta dose rate contribution of the feldspar samples was calculated by assuming a potassium content of 12.5±0.5% (Huntley and Baril, Reference Huntley and Baril1997).

Fading tests were carried out for all three samples and showed that fading is negligible for samples C-L3897 (~0.7% per decade) and C-L3895 (~1.5% per decade) and we regard these low fading rates as a laboratory artifact resulting from the measurement procedure. A higher laboratory fading rate of 1.99±0.21% was measured for sample C-L3896, which was collected 40 cm above sample C-L3897. The ages of both samples are statistically indistinguishable and therefore we regard the apparent fading rate of sample C-L3896 as a measurement artifact. This is also supported by the prior IR stimulation temperature experiment that showed no dependency of the pIRIR250 signal on the prior IR temperature, which is an indicator of a stable luminescence signal (Buylaert et al., Reference Buylaert, Jain, Murray, Thomsen, Thiel and Sohbati2012).
DISCUSSION
Site formation
The micromorphological evidence as well as field investigations during the excavations corroborate the findings on site formation presented before (Álvarez-Alonso et al., Reference Álvarez-Alonso, Andrés-Herrero, de, Díez-Herrero, Medialdea and Rojo2016). In the lower part of the sequence, the sandy sediments of layer O show lamination, cross bedding, and ripple structures typical for paleoflood fluvial deposits (Álvarez-Alonso et al., Reference Álvarez-Alonso, Andrés-Herrero, de, Díez-Herrero, Medialdea and Rojo2016). High amounts of muscovite and biotite mica grains mirror deposition of allochthonous silicates of igneous origin within the cavity, which are a source of potassium, and together with high contents of uranium and thorium are responsible for high dose rates (Table 2) of the sediments used for luminescence dating. Towards the top of the sequence, this allochthonous component decreases in importance, reaching very limited amounts of mainly small mica grains in thin sections from the uppermost layers A+B. Since mica does not form a component of the bedrock, its presence suggests that the backfill of the cavity did not result from weathering of the bedrock only, but included admixtures of possibly eolian inputs from alluvial terraces or crystalline-pediment rock outcrops. Quartz, however, may be derived from the sandy-dolostone bedrock of the cave or its close proximity, as well as from granite and granodiorite rock of the river catchment. Quartz grains often show irregular and angular shape pointing to lack of fluvial abrasion and local origin. In the lower part of the sequence (layers O and M), quartz grains are often well-rounded and circular, matching with the allochthonous origin of these sediments. Towards the top, the frequency of irregularly shaped quartz grains increases, indicating that autochthonous input of quartz from weathering of sandy-dolostones takes a more important role than for lower strata.
The high porosity and abundance of partly dissolved crystals within dolostone rock fragments may reflect differential degrees of weathering of rock fragments. There was no clear difference, however, between lithostratigraphic layers, and weathering may have occurred prior to deposition of the grains in the cave. Calcitic pedofeatures are frequent in thin sections from layers A to D, indicating considerable pedogenic accumulation of secondary carbonates (e.g., Durand et al., Reference Durand, Monger and Canti2010). Their number decreases in layers E and G, while they are mostly lacking in layers K, L, M, and O. This lack of calcitic and other pedofeatures in the lower part of the sequence (layers O, M/L, K, and G) as well as field evidence described before (Álvarez-Alonso et al., Reference Álvarez-Alonso, Andrés-Herrero, de, Díez-Herrero, Medialdea and Rojo2016), add to the notion of rapid sediment deposition and lack of extended periods of weathering and soil formation during filling of the lower part of the cavity.
Thin sections from layers E and G contain very limited amounts of archeologically relevant materials, including bone, charcoal, or lithic fragments, pointing to a low intensity of occupation. The good preservation of lenticular and locally platy microstructures, the lack of features characteristic of reworking of sediments, such as laminated or layered sediment, rolled aggregates or nodules, or heavy bioturbation, provide micromorphological evidence for in situ archeological horizons. In layer K, intercalations of coarse-grained materials show that sheet flow or overbank flood deposits occasionally reached the cavity. The fact that this intercalation is preserved points to good preservation of the primary stratification.
Lenticular and platy microstructures in soils and sediments have been explained by frost action (e.g., Van Vliet Lanoë, Reference Van Vliet-Lanoë2010; Van der Meer and Menzies, Reference Van der Meer and Menzies2011). Formation of ice by freezing causes volumetric expansion in soil pores and exerts pressure on the mineral particles. Repeated freezing and thawing cycles may then result in formation of soil peds, even in originally non-aggregated sediment. Small lenticular aggregates and spheroidal granules may be formed as well as larger plates. In addition, a banded soil fabric may result. The depth to which frost may affect soils and sediment depends on the frost regime. Outside permafrost areas, the frost action may reach 5 to 15 cm below the soil surface (Van Vliet Lanoë, Reference Van Vliet-Lanoë2010), and its effect on soil structure depends on availability of water for ice formation and the texture of the soils. Sandy-loamy deposits, such as at Abrigo del Molino, are generally less prone to develop frost features. At Abrigo del Molino, well-expressed fine lenticular aggregates and platy structures are found in lithological layers G and M. The highest number of artifacts were found within layer G. It could be argued that trampling caused the apparent frost features, but the very regular degree of compaction and expression of aggregates argues against trampling, which would rather result in more spatially variable forms and degrees of compaction. In addition, thin sections from archeological level 2 (layers C and D) do not show lenticular or platy microstructures.
Reliability of radiocarbon and luminescence ages
The bone sample COL4020.1.1 extracted from level K gave a comparably young age of 36.4 to 34.8 cal ka BP, which most likely underestimates the true age, because the bone sample was collected from the surface of the profile near a root. The age was identified as an outlier using Baysian modelling, thus we exclude this sample from the chronological interpretation. We are confident in all other 14C dates from Abrigo del Molino, because of several lines of evidence: (1) most bone samples showed anthropogenic percussion marks, and there is very limited evidence for the presence of carnivores within the cave. (2) In addition, based on field evidence and micromorphological features, layers C, D, E, and G from which the bone samples were collected do not show any features of post-depositional reworking. These facts corroborate an anthropogenic origin of the bones and their reliable sedimentary context. (3) It may be anticipated that age underestimation may be a problem, because bone taphonomy is known to significantly affect radiocarbon ages for southern Iberian cave sites. The bone samples dated in this study were all relatively well-preserved and the quality of collagen fraction was also much better than in cases where ultrafiltration was used and produced higher ages (Wood et al. Reference Wood, Barroso, Caparrós, Jordá-Pardo, Galván Santos and Higham2013, Reference Wood, Bernaldo de Quirós, Maíllo-Fernández, Tejero, Neira and Higham2016; Higham et al., Reference Higham, Douka, Wood, Ramsey, Brock, Basell and Camps2014). As indicated by the C/N ratios of the collagen fraction, contamination with nitrogen-containing contaminants such as humic substances, which may partly be removed by removal of the <30 kDa (Brock et al., Reference Brock, Geoghegan, Thomas, Jurkschat and Higham2013), is low. Ultrafiltration of collagen applied on two bone samples yielded results the same as (COL2716) or similar to (COL2715) non-ultrafiltrated treatment. The age difference between ultrafiltrated and non-ultrafiltrated treatments of sample COL2715 is about 2 ka only, and when included in Baysian modeling this difference is negligible. Thus, an age underestimation by not using ultrafiltration on the other bones is highly unlikely. Moreover, sample C-L3895, which was collected from layer G, is in good agreement with the radiocarbon ages, which further supports the assumption that those are not underestimated. If we compare 14C and luminescence ages in a combined Bayesian model (Fig. 8), the results of both dating methods support each other. Luminescence samples were collected from underlying sediments of the overbank flood deposits (layers O and M) and slope debris. Age estimates of ~44 ka (Table 2) provide a terminus post quem for the occupation levels. This overlaps with the radiocarbon ages for archeological levels 2 and 3, stressing the short time span it took to fill the cavity with sediments and to use it for shelter. The luminescence samples were collected from fluvial or colluvial layers. We cannot draw a final conclusion about the bleaching conditions, because quartz signals were in saturation and could not be used to cross-check the feldspar results. Therefore, we can only compare the feldspar ages of samples C-L3896 and C-L3897 to the radiocarbon ages from layer G. In this context, the luminescence ages do not appear overestimated and support the assumption of a high sedimentation rate, which we have concluded from the micromorphological analysis and field evidence.
Álvarez-Alonso et al. (Reference Álvarez-Alonso, Andrés-Herrero, de, Díez-Herrero, Medialdea and Rojo2016) presented the first luminescence dating results for the sediment sequence at Abrigo del Molino. From bottom to top, the results were 56.0±4.5 ka for layer M, 57.4±3.3 ka for layer G, 64.4±2.7 ka for layer E, and 32.4±1.7 ka for layer D, as plotted in Figure 11. Direct comparison with the luminescence ages presented here is not possible, because we used different measurement protocols. While Álvarez-Alonso et al. (Reference Álvarez-Alonso, Andrés-Herrero, de, Díez-Herrero, Medialdea and Rojo2016) have used quartz as dosimeter for samples from layers M, G, and D and have applied pIRIR290 dating to feldspar samples from layer E, the quartz signals in our study were in saturation (Supplementary Figure 1). Moreover, the feldspar samples in our study did show a dependency on the prior IR stimulation temperature using the pIRIR290 protocol (Fig. 9; Thiel et al., Reference Thiel, Buylaert, Murray, Terhorst, Hofer, Tsukamoto and Frechen2011), which is why we chose a different measurement protocol for feldspar dating.
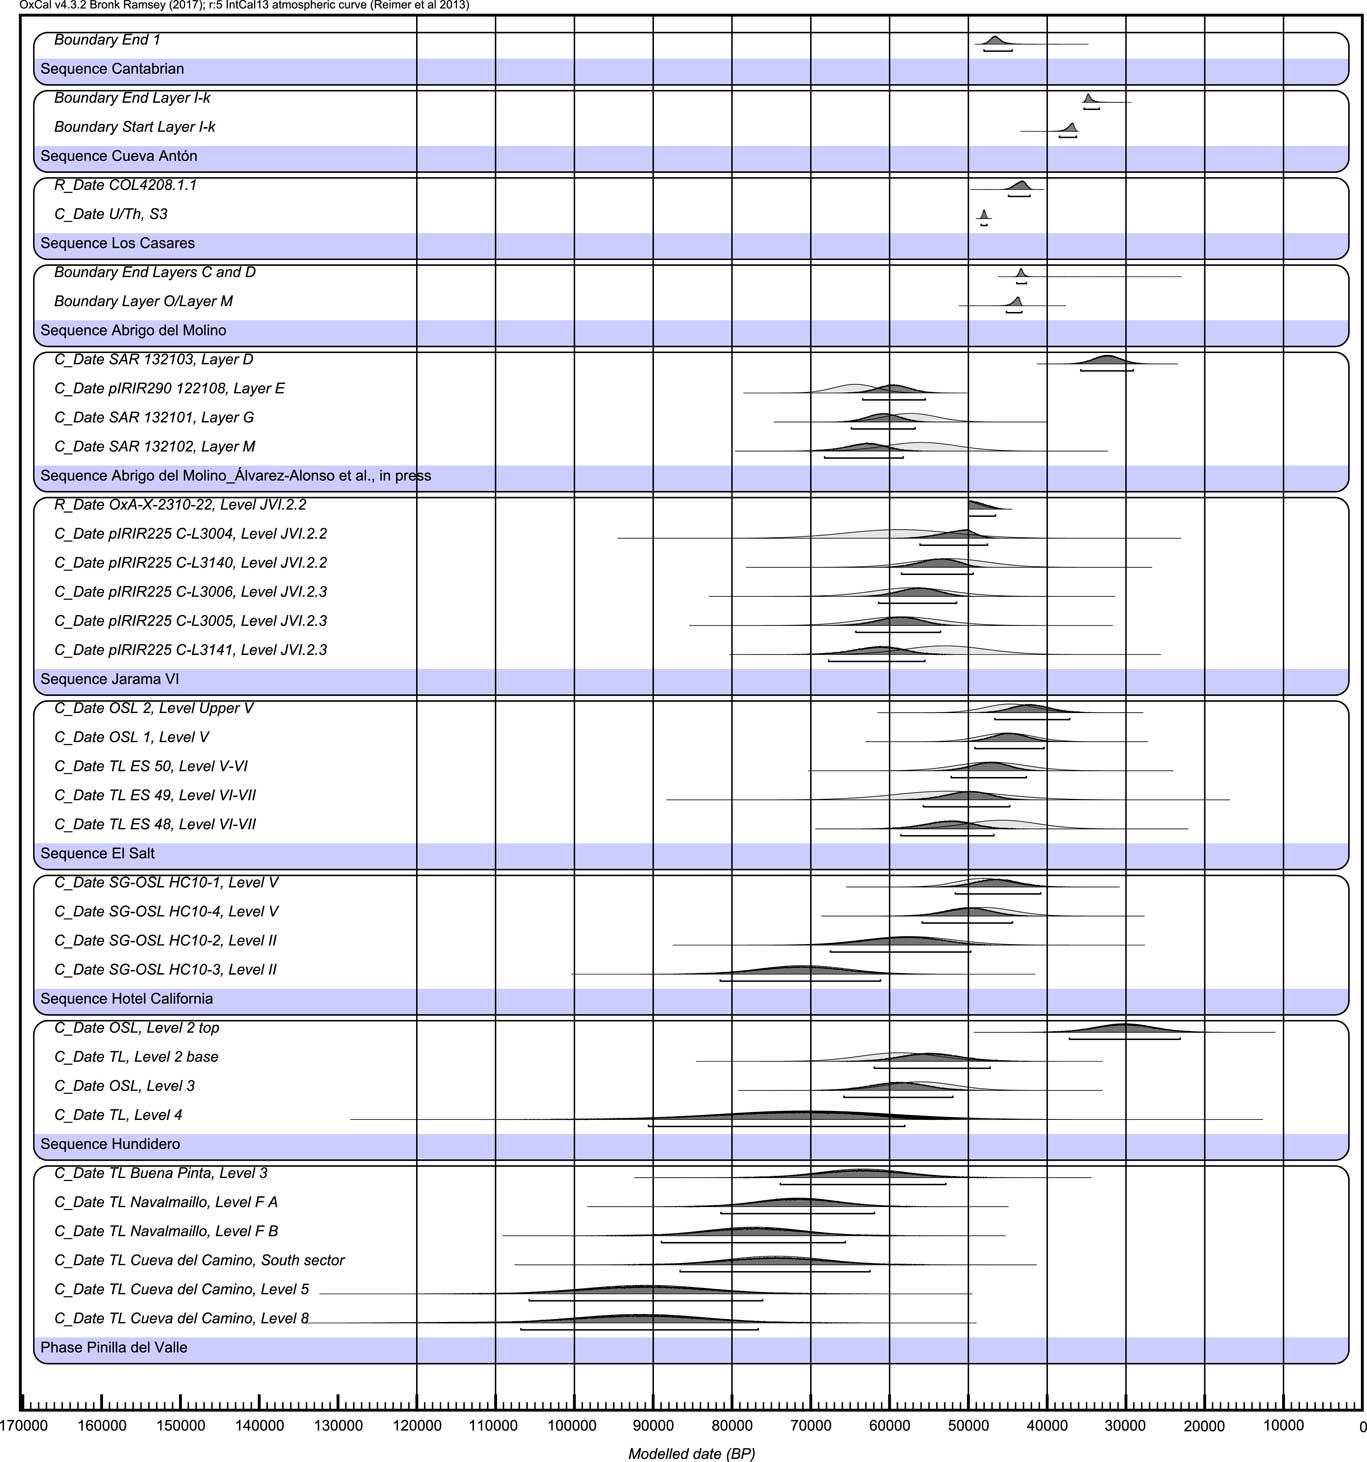
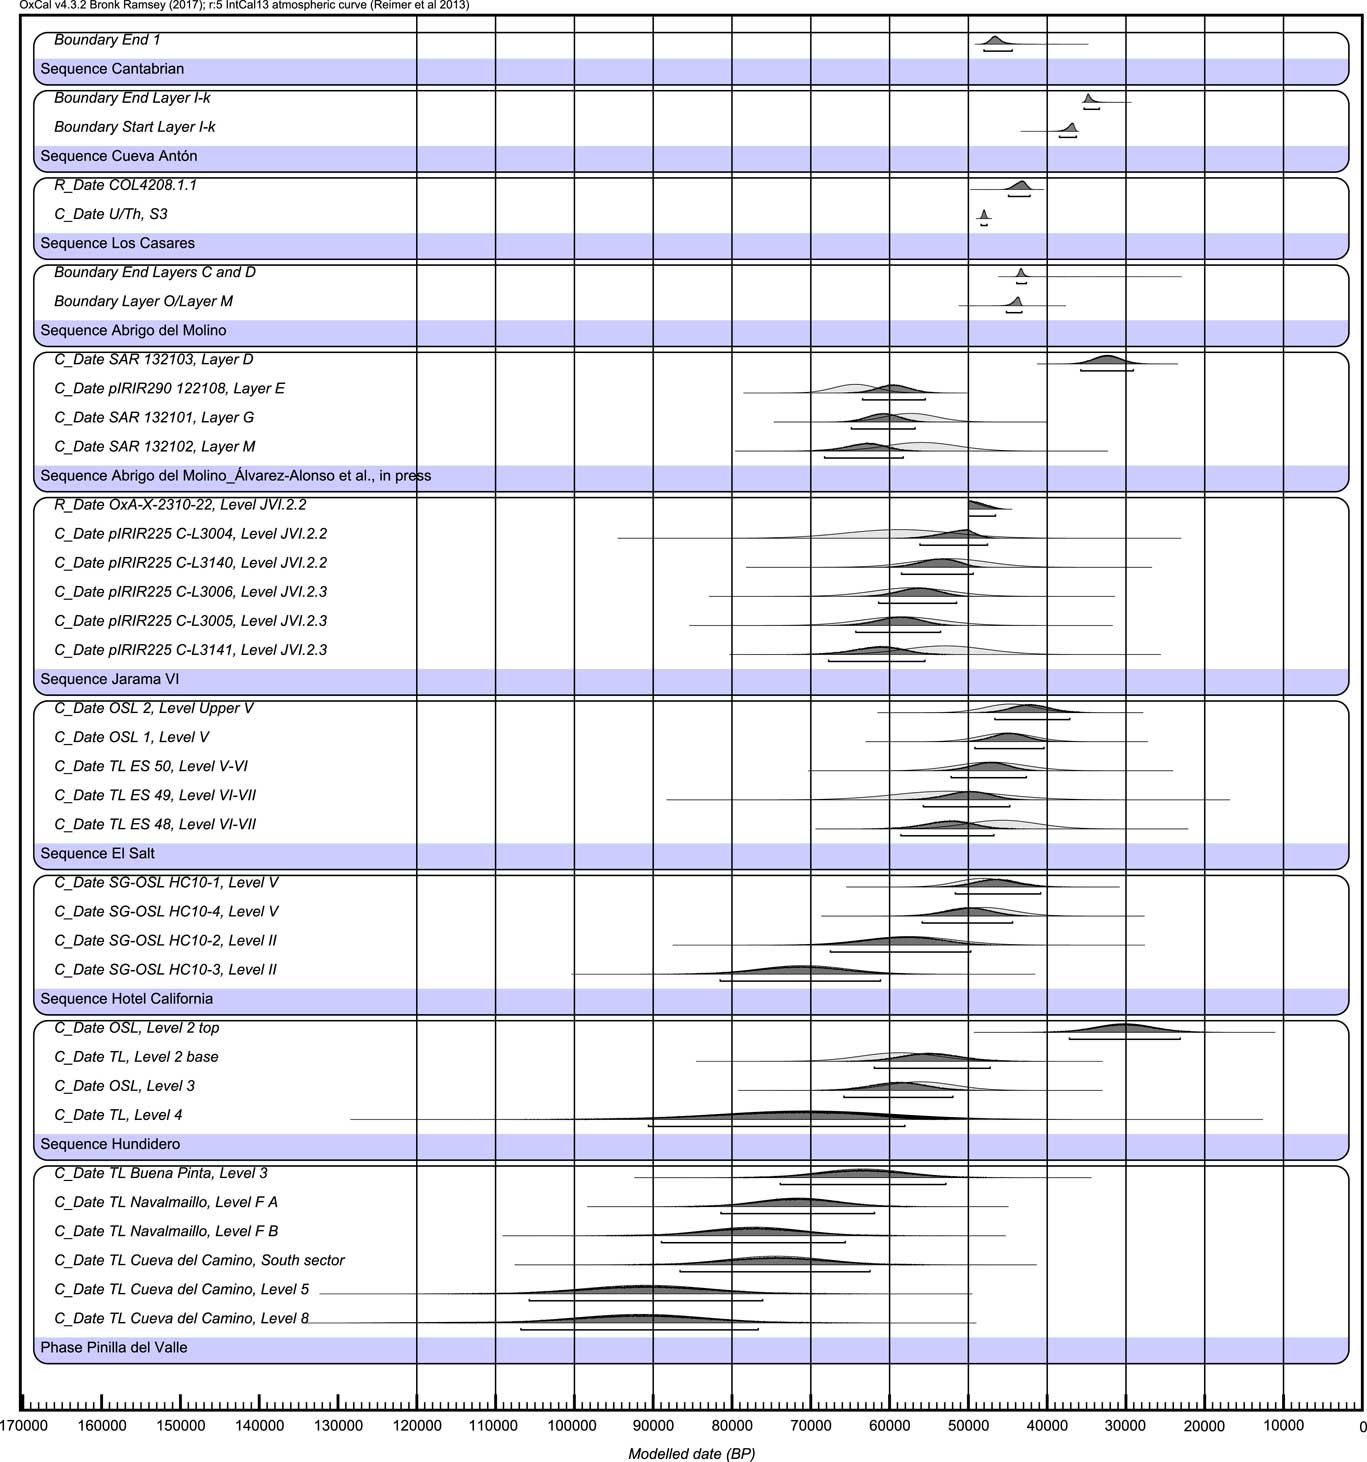
(color online) Results of recent dating studies for late Middle Paleolithic occupations in Central Spain and other areas of the Iberian Peninsula. The 14C data was calibrated with OxCal 4.3.2 using IntCal13 (Reimer et al., Reference Reimer, Bard, Bayliss, Beck, Blackwell, Bronk Ramsey and Buck2013). Modeling of luminescence (TL) or 14C dates was conducted using the sequence function of OxCal 4.3.2. From bottom to top the plots show the following: TL ages for the caves of Pinilla de Valle (Baquedano et al., Reference Baquedano, Márquez, Laplana, Arsuaga and Pérez González2014); optically stimulated luminescence (OSL) and TL ages for the open air site Hundidero (Carbonell et al., Reference Carbonell, Huguet, Cáceres, Lorenzo, Mosquera, Ollé and Rodríguez2014); OSL ages for the open air site Hotel California (Arnold et al., Reference Arnold, Demuro, Navazo, Benito-Calvo and Pérez-González2013); TL and OSL ages for El Salt (Galván et al., Reference Galván, Hernández, Mallol, Mercier, Sistiaga and Soler2014); prior-IR (pIRIR) and 14C results for Jarama VI (Kehl et al., Reference Kehl, Burow, Hilgers, Navazo, Pastoors, Weniger, Wood and Jordá-Pardo2013); OSL and pIRIR ages for Abrigo del Molino (Álvarez-Alonso et al., Reference Álvarez-Alonso, Andrés-Herrero, de, Díez-Herrero, Medialdea and Rojo2016); the probability density functions (pdf) for the start and end of LMP occupation at Abrigo del Molino from Fig. 8 (this paper); 14C dates for Cueva Antón (Zilhão et al., Reference Zilhão, Ajas, Badal, Burow, Kehl, López-Sáez and Pimenta2016); the pdf for the end of the Mousterian in the Cantabrian region suggested by Higham (Reference Higham, Douka, Wood, Ramsey, Brock, Basell and Camps2014) and Wood et al. (Reference Wood, Bernaldo de Quirós, Maíllo-Fernández, Tejero, Neira and Higham2016). This pdf is based on selected new datings on charcoal or bone from Late Mousterian levels at Cueva Morín, Esquilleu, Arrillor, and La Güelga, using ABox or ultrafiltration (for raw data see Supplementary Table 1). The oxygen isotope record of NGRIP was plotted as implemented in OxCal 4.3.2.
Chronological framework and correlation with other sites and climatic phases
All radiocarbon dating on bone from Abrigo del Molino places the Mousterian assemblages in archeological levels 2 and 3 to between 41 and 45 cal ka BP. Bayesian modeling of all dating results presented here suggests that the filling of the cave probably started around 48 ka, as based on the 95.4 probability range of the modeled age for sample CL-3897 (Fig. 8). For comparison with other recently dated LMP sites in Central Iberia, we use the probability density function (pdf) of the boundary between layers O and M as terminus post quem for the Mousterian occupation at Abrigo del Molino and the modelled pdf for the end of the occupation (Fig. 8 and 11). As recently reported by Alcaraz-Castaño et al. (2017) the Mousterian occupation at Los Casares cave (level c) took place at more or less the same time like at Abrigo del Molino. These two sites testify to Mousterian occupation in Central Iberia several thousand years later than recently reported from the cave sites Jarama VI and the three caves Cueva del Camino, Navalmaillo, and Buena Pinta in Pinilla de Valle, where human occupation probably took place before 50 ka (Kehl et al., Reference Kehl, Burow, Hilgers, Navazo, Pastoors, Weniger, Wood and Jordá-Pardo2013) or 60 ka (Baquedano et al., Reference Baquedano, Márquez, Laplana, Arsuaga and Pérez González2014), respectively. Similarly, Neanderthal presence at the open air sites of Hundidero and Hotel California likely dates back to before 50 ka (Carbonell et al., Reference Carbonell, Huguet, Cáceres, Lorenzo, Mosquera, Ollé and Rodríguez2014) and before 45 ka (Arnold et al., Reference Arnold, Demuro, Navazo, Benito-Calvo and Pérez-González2013), respectively (Fig. 11).
At Abrigo del Molino, radiocarbon ages are supported by luminescence ages and independent age control is also available for the sequences at Jarama VI and Los Casares (Supplementary Table 1) which backs the radiocarbon dating results. Many other Iberian sites with LMP occupations have been dated by radiocarbon or other dating methods only, hence lack independent age control. Methodological advancement in radiocarbon dating and application of new pretreatment techniques such as ABOx or ultrafiltration often yielded older age estimates for LMP occupations in Iberia than reported before, shifting the boundary of Neanderthal disappearance back in time (Maroto et al., Reference Maroto, Vaquero, Arrizabalaga, Baena, Baquedano, Jordá and Julià2012; Wood et al., Reference Wood, Barroso, Caparrós, Jordá-Pardo, Galván Santos and Higham2013; Higham et al., Reference Higham, Douka, Wood, Ramsey, Brock, Basell and Camps2014; Wood et al. Reference Wood, Arrizabalaga, Camps, Fallon, Iriarte-Chiapusso, Jones and Maroto2014; Wood et al., Reference Wood, Bernaldo de Quirós, Maíllo-Fernández, Tejero, Neira and Higham2016). Evaluation of the available radiocarbon dating evidence (Supplementary Table 1) and other dating results suggests that the Mousterian occupation at Abrigo del Molino has an intermediate age falling in between H5 and H4. In the south and south-east of Iberia, Mousterian occupation levels 1k at Cueva Antón (Wood et al., Reference Wood, Barroso, Caparrós, Jordá-Pardo, Galván Santos and Higham2013, Zilhão et al., Reference Zilhão, Ajas, Badal, Burow, Kehl, López-Sáez and Pimenta2016), level 8 at Gruta da Oliveira (Angelucci and Zilhão, Reference Angelucci and Zilhão2009; Hoffmann et al., Reference Hoffmann, Pike, Wainer and Zilhão2013) and the T5 alluvial terrace of Foz do Enxarrique (Cunha et al., Reference Cunha, Martins, Huot, Murray and Raposo2008) were dated to about 35 to 37 ka cal BP, hence after H4, whereas recent datings at Boquete de Zafarraya (Michel et al., Reference Michel, Delanghe-Sabatier, Bard and Barroso Ruiz2013; Wood et al., Reference Wood, Barroso, Caparrós, Jordá-Pardo, Galván Santos and Higham2013), Sima de las Palomas de Teba (Kehl et al., Reference Kehl, Burow, Cantalejo, Domínguez-Bella, Durán, Henselowsky and Klasen2016), Abrigo de la Boja (Zilhão et al., Reference Zilhão, Anesin, Aubry, Badal, Cabanes, Kehl and Klasen2017) or El Salt (Galván et al., Reference Galván, Hernández, Mallol, Mercier, Sistiaga and Soler2014) suggest an earlier end of the Mousterian, dating to before 40 ka, hence before H4 (or even H5). For the Cantabrian area, Higham et al. (Reference Higham, Douka, Wood, Ramsey, Brock, Basell and Camps2014) and Wood et al. (in press) propose a probability density function (pdf) for the end of the Mousterian as based on a compilation of radiocarbon ages from Cueva Morín, Esquilleu, Arrillor and La Güelga (Fig. 11; Supplementary Table 1). This pdf places the end of the final Mousterian to before 45 ka cal BP. Similarly, several new 14C dates obtained on shell carbonates place Mousterian levels X, XI and XII of the sequence of El Cuco to between 42.3 to 46.4 ka cal BP (Gutiérrez-Zugasti et al., Reference Gutiérrez-Zugasti, Rios-Garaizar, Marín-Arroyo, Rasines del Río, Maroto, Jones, Bailey and Richards2017).
For northeastern Spain, represented by new datings at L'Arbreda and Abric Romaní, a longer survival until about 41 ka cal BP was suggested (Wood et al., Reference Wood, Bernaldo de Quirós, Maíllo-Fernández, Tejero, Neira and Higham2016; Supplementary Table 1), but these dates overlap with those for the Early Aurignacian at the same sites. In addition, earlier radiocarbon dating on charcoal for L’Arbreda provided significantly older ages for the final Mousterian and basal Aurignacian (Bischoff et al., Reference Bischoff, Soler, Maroto and Julià1989). Overall, and as based on the comparison to current radiocarbon chronologies, the Mousterian occupation at Abrigo del Molino thus took place before the chronology suggested for the final Mousterian in Cueva Antón (Zilhão et al., Reference Zilhão, Ajas, Badal, Burow, Kehl, López-Sáez and Pimenta2016) and Gruta da Oliveira (Hoffmann et al., Reference Hoffmann, Pike, Wainer and Zilhão2013), but after the final Mousterian in Cantabrian Spain (Higham et al., Reference Higham, Douka, Wood, Ramsey, Brock, Basell and Camps2014; Wood et al., Reference Wood, Bernaldo de Quirós, Maíllo-Fernández, Tejero, Neira and Higham2016). Apparently, it shows temporal overlap with the transitional Aurignacian of unit 18B at El Castillo, dated to between 45 and 42 cal BP (see discussion in Wood et al., Reference Wood, Bernaldo de Quirós, Maíllo-Fernández, Tejero, Neira and Higham2016) and with the presumably Châtelperronian level 2 at La Güelga, where similar dating results were found (Menéndez et al., Reference Menéndez, Weniger, Álvarez-Alonso, Andrés-Herrero, García, Jordá, Kehl, Rojo, Quesada and Schmidt2014). This temporal overlap may relate to methodological problems in radiocarbon dating or cultural attribution of lithic assemblages, or it may indicate co-existence of these techno-complexes over large geographical distances. In Central Iberia itself, occupation layers with Aurignacian or Early Gravettian assemblages have not been found. This lack of early Upper Paleolithic assemblages suggests a prolonged gap in human occupation in Central Iberia after the LMP.
Overall, the new radiocarbon and luminescence dating results presented here place deposition of the lithological layers P to C of Abrigo del Molino in the time frame roughly between 48 and 41 ka based on radiocarbon and luminescence ages. Deposition thus probably started during H5, and continued during the period from Greenland Interstadials (GI) 12 to 10 including GS12 and 11. Lenticular and partly platy microstructures as indicators of frost are most pronounced in lithological layers M and G of Abrigo del Molino, whereas these features were not observed in layers O and E to A. This may indicate that comparatively warm climatic conditions existed during accumulation of the fluvial deposits of layer O, whereas accumulation of slope debris (layers N to G) occurred under colder conditions. More data on the lower part of the sequence is needed, however, to check this hypothesis. For now, the chronological model suggests rapid accumulation of the sequence up to layer C in less than 10 ka and occupation by Neanderthals during and in between GI12 to GI10.
Limited information is available on the paleoclimatic conditions in Central Iberia during the time of interest. The Fuentillejo Maar lacustrine record, situated on the southern Meseta 220 km south of Abrigo del Molino suggests that H5 was “warm and arid,” whereas H4 was “less cold and arid,” where “less cold” refers to comparison with H2, H1, and the Younger Dryas (Vegas et al., Reference Vegas, Ruiz-Zapata, Ortiz, Galán, Torres, García-Cortés, Gil-García, Pérez-González and Gallardo-Millán2010). Hence, the time in between H5 and H4 was relatively moist. The radiocarbon age model for the Fuentillejo Maar lacustrine record and Marine Isotope Stage 3, however, shows several age inversions and is quite coarse, the latter also holding for the different proxy records of the core. Sediment facies of the Villarquemado paleolake (Moreno et al., Reference Moreno, González-Sampériz, Morellón, Valero-Garcés and Fletcher2012), located in the Iberian range about 240 km east of Abrigo del Molino, reflect a change from a distal alluvial fan system (unit IV), interpreted as the most arid period of the sequence, towards alternation between shallow carbonatic and clastic lake systems (unit III). This change probably occurred before 43 ka, if the result of the lowermost radiocarbon sample from Villarquemado can be taken as terminus ante quem. The time of interest is also represented in well-dated marine records from the Alborán Sea and the Iberian margin, as well as in some terrestrial records in other areas of Europe. The recent compilation of Moreno et al. (Reference Moreno, Svensson, Brooks, Connor, Engels, Fletcher and Genty2014) shows that these records reflect dry and cold conditions during H5 and H4, with an intermittent phase of climate amelioration.
After recent studies pushed the time of Neanderthal occupation to pre-45 ka in several cases, a rather low number of archeological sites in the IP with secure age control remain to indicate Middle Paleolithic assemblages, hence Neanderthal presence, at after 45 ka. The number of lithics and other artifacts of post-45 ka sites including Cueva Antón, Gruta da Oliveira, Los Casares, and Abrigo del Molino is often rather small, pointing to an ephemeral use of these sites by Neanderthals. These observations suggest that “post-45 ka Neanderthals” were already reduced in number long before AMH arrived in the respective areas. This hypothesis is in agreement with results from genetic studies. Based on mitochondrial DNA, Neanderthals who lived in the Western Mediterranean after ~48 ka showed lower genetic variation than individuals who lived earlier or in eastern Europe (Dalén et al., Reference Dalén, Orlando, Shapiro, Brandström-Durling, Quam, Gilbert and Thomas2012). The diachronic decrease in genetic variation was interpreted as a sign of population fragmentation, which may have resulted in the low numbers of Neanderthals anticipated above.
CONCLUSIONS
The site of Abrigo del Molino consists of a rapidly accumulated sequence of fluvial, slope, and roof-fall deposits. Sediment properties derived from field description and micromorphology do not provide significant evidence for reworking, and suggest that the archeological levels are preserved in situ. Radiocarbon dating provides a chronologically well-constrained record of Late Neanderthal occupation at around 41–45 ka in Central Iberia. This chronology is backed by luminescence ages of sediment deposition placing accumulation of the whole sequence within a short time span, i.e., between 48 and 41 ka. The typology and number of archeological finds reflect rather ephemeral usage of the site. The sparsely populated central part of the IP probably did not provide suitable habitats during the last phases of Neanderthal occupation, and, given the lack of Aurignacian and Gravettian sites, obviously neither during the early times of modern humans. Climatic change during H5 and H4 may have played a role in this respect. The Mousterian assemblages at Abrigo del Molino reflect one of the latest occupations of Neanderthals in Central Iberia, which may have occurred under more favourable climatic conditions than during H5 and H4. According to current chronometrical evidence, Neanderthal abandonment took place later than in the Iberian north but earlier than in the coastal areas of the southeast (Cueva Antón) and southwest (Gruta da Oliveira). It is likely that Neanderthals left Central Iberia long before anatomically modern humans arrived.
ACKNOWLEDGMENTS
The micromorphological investigations and dating studies were part of the C1, F2, and F5 projects of the Collaborative Research Center 806 Our Way to Europe funded by the German Research Foundation (DFG). The archeological and geoarchaeological research is funded by the regional government (Junta de Castilla y León) and supported by other institutions (Segovia Town Council, Geological Survey of Spain, UNED) and companies (De Pablos, Radalki, Roble10, Tabuenca, and ‘La Trébede’). The constructive comments of two anonymous reviewers are gratefully acknowledged.
SUPPLEMENTARY MATERIAL
To view supplementary material for this article, please visit https://doi.org/10.1017/qua.2018.13