The ultimate goal of developmental psychopathology is to understand the whole trajectory of an individual's life, not just transitory outcomes at a particular point in life. Thus, research should strive to build a bridge that spans from childhood to adulthood (Rutter & Sroufe, Reference Rutter and Sroufe2000). Very few studies have measured change in externalizing problems across long spans of development in one piece, from childhood to adulthood. There are several reasons for the difficulties in measuring change across lengthy developmental spans: it is costly, it takes a long time, and most important, there are difficult conceptual and statistical issues that need to be addressed with respect to measurement. The difficulty is in comparing measurements in childhood with measurements in adulthood in a way that allows one to infer that differences in scores on a measure across time reflect true change rather than differences in the meaning of the measure. The present study considers externalizing behavior problems across childhood to adulthood. We describe forms of growth and we use early risk factors to predict who will be at greatest risk for problem trajectories. We also employ risk and protective factors from successive developmental periods to shed light on the mechanisms of externalizing behavior across development.
Predicting Externalizing Problems
Traditionally, research has been quite poor in predicting behavior (e.g., Sutton, Reference Sutton1998; Underwood, Reference Underwood1979). The issue of prediction of later behavior problems is crucial from a policy perspective because early identification of at-risk individuals may be crucial to prevention. Accurate prediction provides important tools for many aspects of public policy, including prison parole, personnel hiring, and security agency clearance. Prediction is generally made by judgments (by experts or laypeople) or by a formula that weighs various characteristics of the individual (Underwood, Reference Underwood1979). One type of formula employs an actuarial model that takes into account many different characteristics of the individual, including risk and protective factors. Because of the actuarial model's ability to weigh many risk and protective factors simultaneously, the actuarial approach has consistently been shown to be more accurate than judgment-based predictions (Dawes, Faust, & Meehl, Reference Dawes, Faust and Meehl1989). The present study uses an actuarial approach to predict the development of later externalizing problems.
Development and Heterotypic Continuity of Externalizing Problems
Externalizing behavior problems do not emerge suddenly. A high degree of age-to-age stability in externalizing problems appears to be the rule (Fergusson, Reference Fergusson1998; Olweus, Reference Olweus1979). Therefore, developmental psychopathology research often describes trajectories of externalizing problems across development. However, to do so across major developmental eras, one must deal with changes in how externalizing behavior is manifested from childhood to adolescence (Olson et al., Reference Olson, Sameroff, Davis-Kean, Lansford, Sexton and Bates2013). For example, young children exhibit more physical aggression (e.g., biting or kicking) and adolescents engage in different forms of externalizing (e.g., drug use, delinquency, or indirect aggression; Achenbach, Howell, McConaughy, & Stanger, Reference Achenbach, Howell, McConaughy and Stanger1995; Miller, Vaillancourt, & Boyle, Reference Miller, Vaillancourt and Boyle2009). A particular scale may not actually measure the same construct at different ages (Widaman, Ferrer, & Conger, Reference Widaman, Ferrer and Conger2010). Thus, changes in measurement may need to accompany changes in externalizing behavior in order for the measures to remain developmentally relevant. The different externalizing behavior manifestations over time do show heterotypic continuity or coherence (for excellent discussions of coherence, see Caspi, Reference Caspi and Damon1998; Miller et al., Reference Miller, Vaillancourt and Boyle2009).
McArdle, Grimm, Hamagami, Bowles, and Meredith (Reference McArdle, Grimm, Hamagami, Bowles and Meredith2009) have argued that it is not theoretically desirable or necessary for developmental studies to require the same measures over time. Many researchers have supported the use of changing, developmentally appropriate measures over time (e.g., Eddy, Dishion, & Stoolmiller, Reference Eddy, Dishion and Stoolmiller1998; Knight & Zerr, Reference Knight and Zerr2010; McArdle et al., Reference McArdle, Grimm, Hamagami, Bowles and Meredith2009; Owens & Shaw, Reference Owens and Shaw2003), and others have suggested that the measurement of heterotypic continuity should receive more attention (Schulenberg & Maslowsky, Reference Schulenberg and Maslowsky2009). Several previous studies have implemented growth curves with changing measures. For example, similar to the approach of the present study, Owens and Shaw (Reference Owens and Shaw2003) predicted growth curves of externalizing problems using different Achenbach scales across different time frames to maintain developmental relevance of the measures. Other studies have examined trajectories of externalizing problems with changing measures (Brame, Nagin, & Tremblay, Reference Brame, Nagin and Tremblay2001; Patterson, Reference Patterson1993) or trajectories of other phenotypes (e.g., Pettit, Keiley, Laird, Bates, & Dodge, Reference Pettit, Keiley, Laird, Bates and Dodge2007). However, to infer heterotypic continuity and changes in behavior problems over time with different measures, the measures must be comparable conceptually and empirically. Otherwise, apparent changes in behavior could be due to changes in the functioning of measures.
Ensuring statistical equivalence for comparing scores on different measures
Several statistical approaches have been used to increase comparability of measures. One approach is to standardize or age-norm measures across time (e.g., a T or z score), which places variables on a standard normal metric. Researchers are often cautioned against standardizing variables in longitudinal designs, however (Stoolmiller, Reference Stoolmiller and Gottman1995; Willett, Singer, & Martin, Reference Willett, Singer and Martin1998). This practice would actually prevent observing changes in means or variances across time because standardization holds them constant.
A more promising approach recommended by Little (Reference Little2013) for longitudinal designs may be a proportional scoring metric, such as proportion of maximum (POM) scoring. POM scoring divides each individual's score on a measure by the total possible score, rendering the individual's score a proportion of the maximum possible, with the assumption that similar proportions correspond to similar trait levels. Because all proportions have the same possible range (0–1), they have greater comparability than the raw metric and, unlike standardization, still allow growth over time. Another advantage of POM scoring over standardization in growth curve models is that it does not distort any of the fundamental statistics of the variable to provide a “reasonably comparable scale” (McArdle, Hamagami, Meredith, & Bradway, Reference McArdle, Hamagami, Meredith and Bradway2000, p. 60).
Ensuring conceptual equivalence for comparing scores on different measures
POM rescaling approaches do not ensure, however, that variables at different ages are on the same conceptual metric. In order to ensure this, construct validity invariance is also necessary (Knight & Zerr, Reference Knight and Zerr2010). In other words, although identical measures over time are unnecessary, the measures should have identical meaning across the time frame of the study (Owens & Shaw, Reference Owens and Shaw2003). There are many ways to develop construct validity of a set of measures for a given construct. First, the items selected for the measures should be based on theory: they should be judged to reflect the same construct and the items should adequately sample the different facets of the construct (content or face validity). Second, despite heterotypic continuity in the long term in the case of externalizing behavior, there should be short-term test–retest reliability of the measures across time. Third, the measures should show convergent validity with each other and discriminant validity with measures of distinct constructs. Fourth, the measures should demonstrate a similar factor structure across time, but they might not be expected to have an invariant structure because of qualitative changes in the factor structure with age. Fifth, the measures should have high internal consistency. In sum, in order to model externalizing trajectories, it is important for measures to have theoretical relevance to the construct at each age examined and to be on a comparable metric for measurement equivalence (as opposed to measurement invariance, which is unnecessary in cases of heterotypic continuity; Knight & Zerr, Reference Knight and Zerr2010).
Studies of Trajectories of Externalizing Problems
In the present study, we apply the preceding considerations to the study of trajectories of externalizing behavior problems across many years of development. Several studies have examined trajectories (defined here as 3 or more measurement occasions) of externalizing problems, including Odgers et al. (Reference Odgers, Moffitt, Broadbent, Dickson, Hancox and Harrington2008), which examined trajectories of antisocial conduct problems in individuals from New Zealand from ages 7 to 26 with 8 measurement occasions. A study using six longitudinal data sets examined trajectories of disruptive behaviors and delinquency, with the longest trajectory spanning ages 7–15 with 7 measurement occasions (Broidy et al., Reference Broidy, Nagin, Tremblay, Bates, Brame and Dodge2003). Another notable study examined trajectories of various externalizing problems in children from the Netherlands from ages 4 to 18 with 5 measurement occasions (Bongers, Koot, Ende, & Verhulst, Reference Bongers, Koot, Ende and Verhulst2004). Other studies have examined trajectories of other externalizing phenotypes, including aggression from ages 8 to 30 with 3 measurement occasions (Huesmann, Eron, Lefkowitz, & Walder, Reference Huesmann, Eron, Lefkowitz and Walder1984) and from ages 8 to 42 with 4 measurement occasions (Kokko, Pulkkinen, Huesmann, Dubow, & Boxer, Reference Kokko, Pulkkinen, Huesmann, Dubow and Boxer2009). Studies have also examined trajectories of delinquency from ages 7 to 19 with 13 measurement occasions (Keijsers, Loeber, Branje, & Meeus, Reference Keijsers, Loeber, Branje and Meeus2012) and from ages 8 to 46 with 9 measurement occasions (Farrington, Reference Farrington, Thornberry and Krohn2003). In general, previous studies have shown that, on average, externalizing problems decrease from early to middle childhood (Keiley, Bates, Dodge, & Pettit, Reference Keiley, Bates, Dodge and Pettit2000; Leve, Kim, & Pears, Reference Leve, Kim and Pears2005), increase during adolescence (Sampson & Laub, Reference Sampson and Laub2003), and decrease from adolescence to adulthood (Sampson & Laub, Reference Sampson and Laub2003). We seek to extend prior studies by examining externalizing problems of children from the United States annually from ages 5 to 27 (except ages 18, 25, and 26) with 20 measurement occasions, and to evaluate multiple risk factors as predictors of these trajectories. Similar to Odgers et al. (Reference Odgers, Moffitt, Broadbent, Dickson, Hancox and Harrington2008), we obtained measures from different, although developmentally appropriate, sources at different ages.
Choosing the Developmental Model of Growth
We modeled the trajectories with growth curve models. A limitation of growth curve models is that they assume that all individuals can be described by the same parameters of change (e.g., everyone shows a quadratic trajectory; Connell & Frye, Reference Connell and Frye2006). Growth curve models do not assume, however, that individuals' change is homogeneous. In the present study, the quadratic form was allowed to vary across all individuals, allowing each individual to have a different trajectory (with different intercepts, slopes, and curvatures). This form of describing trajectories is in contrast to previous studies that have examined trajectories of subgroups of people. For example, similar to the developmental taxonomy proposed by Moffitt (Reference Moffitt1993), Odgers et al. (Reference Odgers, Moffitt, Broadbent, Dickson, Hancox and Harrington2008) identified four different subgroups that followed different trajectories: life-course persistent, adolescent onset, childhood limited, and low. At the very least, subgroup modeling can be useful as a heuristic of some general patterns of externalizing trajectories and simplified characterizations of continuous trajectories. An assumption in modeling subgroups' trajectories, however, is that all individuals within a subgroup follow a similar (though not necessarily the same) trajectory, one that is qualitatively different from the trajectories of other subgroups (Bauer & Reyes, Reference Bauer and Reyes2010). Subgroup modeling has been known to identify illusory subgroups (Bauer & Curran, Reference Bauer and Curran2003).
We opted to model growth curves by treating individual differences in externalizing behavior trajectories as dimensional rather than categorical because we find the dimensional models richer. Moreover, there is evidence that externalizing problems are dimensional, not categorical (Coghill & Sonuga-Barke, Reference Coghill and Sonuga-Barke2012; Krueger, Markon, Patrick, & Iacono, Reference Krueger, Markon, Patrick and Iacono2005; Markon & Krueger, Reference Markon and Krueger2005; Walton, Ormel, & Krueger, Reference Walton, Ormel and Krueger2011). Researchers have argued that theory provides stronger support for modeling the heterogeneity of developmental trajectories by allowing trajectories to differ continuously rather than categorically in order to describe individual trajectories more parsimoniously and accurately, both conceptually and empirically (Bauer, Reference Bauer2007; Little, Card, Preacher, & McConnell, Reference Little, Card, Preacher, McConnell, Lerner and Steinberg2009). Three recent studies found that externalizing problem trajectories are more accurately modeled dimensionally than with Moffitt's (Reference Moffitt1993) subgroups (Walters, Reference Walters2011, Reference Walters2012; Walters & Ruscio, Reference Walters and Ruscio2013). Moreover, Burt, Donnellan, Iacono, and McGue (Reference Burt, Donnellan, Iacono and McGue2011) found that subdimensions of externalizing problems were more strongly predictive of later antisocial behavior than was the age of antisocial behavior onset, which has often been used in determining subtypes. These findings suggest that the identified subtypes differ quantitatively in degree of severity rather than qualitatively in kind.
Risk Factors in the Development of Externalizing Problems
In addition to modeling trajectories of externalizing problems, we also examined many risk factors as predictors of individuals' trajectories. Risk factors tend to co-occur, so considering them together may provide a more accurate estimate of the unique contributions of individual risk factors. It is also important to consider the timing of risk factors to clarify the developmental process. Some risk factors, such as child maltreatment, appear to have stronger effects on externalizing problems in later than early childhood (Keily, Howe, Dodge, Bates, & Pettit, 2001), whereas many other risk factors appear to have stronger effects earlier in childhood (Appleyard, Egeland, Van Dulmen, & Sroufe, Reference Appleyard, Egeland, Van Dulmen and Sroufe2005). In their review, Dodge, Coie, and Lynam (Reference Dodge, Coie, Lynam, Damon, Lerner and Eisenberg2006) highlighted the importance of genetics, child temperament, language ability, pregnancy complications, poverty, nonfamily childcare, family processes, and peer processes in the etiology of externalizing behavior problems. They also observed, however, that these risk factors may be markers of other causal processes or may mediate the effects of each other (e.g., poverty may influence externalizing behavior in part via its effect on parenting). To clarify the independent roles of these risk factors in the development of externalizing problems, we evaluated many of these domains of processes identified by Dodge et al. Risk domains evaluated in the present study include demographic characteristics, aspects of parenting, parental adjustment, peer influences, child characteristics, stress, pregnancy, family background, and child activities. We selected risk and protective factors on the basis of previous studies' findings. Even if their mechanisms in the development of externalizing problems are not fully explained, successful prediction promotes prevention, targeted intervention, better choice of intervention, and also aids, ultimately, in the development of process models (Sutton, Reference Sutton1998). Below we list risk factors selected for the present study, and the research supporting their selection.
Demographic characteristics selected as predictors included sex (Deater-Deckard, Dodge, Bates, & Pettit, Reference Deater-Deckard, Dodge, Bates and Pettit1998), ethnicity (Deater-Deckard et al., Reference Deater-Deckard, Dodge, Bates and Pettit1998), family socioeconomic status (SES; Dodge, Pettit, & Bates, Reference Dodge, Pettit and Bates1994; Odgers et al., Reference Odgers, Moffitt, Broadbent, Dickson, Hancox and Harrington2008), and other indicators of SES during adulthood, including educational attainment and length of unemployment.
Aspects of parenting received in childhood included parental values toward aggression (Deater-Deckard et al., Reference Deater-Deckard, Dodge, Bates and Pettit1998); positive parenting (Deater-Deckard et al., Reference Deater-Deckard, Dodge, Bates and Pettit1998); parental involvement (Beyers, Bates, Pettit, & Dodge, Reference Beyers, Bates, Pettit and Dodge2003); parental monitoring (Beyers et al., Reference Beyers, Bates, Pettit and Dodge2003); interparental conflict (Buehler et al., Reference Buehler, Anthony, Krishnakumar, Stone, Gerard and Pemberton1997; Odgers et al., Reference Odgers, Moffitt, Broadbent, Dickson, Hancox and Harrington2008); and exposure to violence (Dodge et al., Reference Dodge, Pettit and Bates1994), harsh discipline (Dodge et al., Reference Dodge, Pettit and Bates1994), spanking (Gershoff, Lansford, Sexton, Davis-Kean, & Sameroff, Reference Gershoff, Lansford, Sexton, Davis-Kean and Sameroff2012), and physical harm (Deater-Deckard et al., Reference Deater-Deckard, Dodge, Bates and Pettit1998; Odgers et al., Reference Odgers, Moffitt, Broadbent, Dickson, Hancox and Harrington2008).
Parental adjustment included mothers' and fathers' alcohol/drug use (Connell & Goodman, Reference Connell and Goodman2002) and arrests (Dallaire & Wilson, Reference Dallaire and Wilson2010; Odgers et al., Reference Odgers, Moffitt, Broadbent, Dickson, Hancox and Harrington2008). Peer influences included social preference with peers (Keiley, Lofthouse, Bates, Dodge, & Pettit, Reference Keiley, Lofthouse, Bates, Dodge and Pettit2003) and peer deviance (Goodnight, Bates, Newman, Dodge, & Pettit, Reference Goodnight, Bates, Newman, Dodge and Pettit2006; Odgers et al., Reference Odgers, Moffitt, Broadbent, Dickson, Hancox and Harrington2008).
Child characteristics included intelligence (Nigg & Huang-Pollock, Reference Nigg, Huang-Pollock, Lahey, Moffitt and Caspi2003), social information processing (Dodge, Pettit, Bates, & Valente, Reference Dodge, Pettit, Bates and Valente1995), reward sensitivity (Goodnight et al., Reference Goodnight, Bates, Newman, Dodge and Pettit2006), internalizing problems (Keiley et al., Reference Keiley, Bates, Dodge and Pettit2000), language ability (Petersen et al., Reference Petersen, Bates, D'Onofrio, Coyne, Lansford and Dodge2013; Petersen, Bates, & Staples, in press), and aspects of temperament (Keiley, Bates, Dodge, & Pettit, Reference Keiley, Bates, Dodge and Pettit2001). Stress included individual stress (Kim, Conger, Elder, & Lorenz, Reference Kim, Conger, Elder and Lorenz2003), family stress (Deater-Deckard et al., Reference Deater-Deckard, Dodge, Bates and Pettit1998), and sleep problems (Goodnight, Bates, Staples, Pettit, & Dodge, Reference Goodnight, Bates, Staples, Pettit and Dodge2007). Pregnancy risks for the target child included medical complications (Deater-Deckard et al., Reference Deater-Deckard, Dodge, Bates and Pettit1998) and having been born to a teenage mother (Wakschlag et al., Reference Wakschlag, Gordon, Lahey, Loeber, Green and Leventhal2000) or from an unplanned pregnancy (Hayatbakhsh et al., Reference Hayatbakhsh, Najman, Khatun, Al Mamun, Bor and Clavarino2011). Family background characteristics included the ratio of children to adults in the home (Deater-Deckard et al., Reference Deater-Deckard, Dodge, Bates and Pettit1998) and whether or not the mother was a single mother (Ackerman, D'Eramo, Umylny, Schultz, & Izard, Reference Ackerman, D'Eramo, Umylny, Schultz and Izard2001), the father was low in caregiving (Mott, Kowaleski-Jones, & Menaghan, Reference Mott, Kowaleski-Jones and Menaghan1997), the mother was cohabiting with a nonmarital partner (Ackerman et al., Reference Ackerman, D'Eramo, Umylny, Schultz and Izard2001), the parents divorced (Lansford et al., Reference Lansford, Malone, Castellino, Dodge, Pettit and Bates2006), or the individual himself or herself divorced his or her spouse. Other experiences of interest included the amount of television watched (Manganello & Taylor, Reference Manganello and Taylor2009) and the amount of nonmaternal childcare (Bates et al., Reference Bates, Marvinney, Kelly, Dodge, Bennett and Pettit1994; Deater-Deckard et al., Reference Deater-Deckard, Dodge, Bates and Pettit1998).
The Present Study
We sought to describe developmental profiles of externalizing problems and to predict them using an actuarial model of risk and protective factors. In other words, given inputs for each child (various child and environmental characteristics), we predicted his or her most likely output (i.e., trajectory of externalizing problems from childhood to adulthood). To do this, we combined different sources of ratings (mother, teacher, father, peer, and self-reports) and different scales of externalizing problems, capitalizing on all of the available information to create a more robust externalizing profile. To render the ratings from different sources and scales conceptually and empirically comparable while still retaining mean-level change to observe meaningful change over time, we used the POM proportional scoring metric along with additional theoretical and empirical considerations. Modeling the trajectories of externalizing problems from childhood to adulthood while taking into account the heterotypic continuity of externalizing behavior allowed us to better understand the patterns of developmental change in externalizing problems over a long span of development, the risk and protective factors that predict the development of externalizing problems, and the ways risk factors in different developmental periods contribute to the development of externalizing behavior. We examined the effects of 40 different risk or protective factors from nine domains across six time frames for a total of 66 risk or protective factors.
We expected that we would be able to model individual differences in trajectories across the long span of development based on findings from previous studies examining shorter spans. However, given the span of development covered and the few previous studies covering as much development, we could not be certain that our model would succeed. We also expected that some of the risk factors that have been associated with externalizing problems in prior studies would be associated with the trajectories of externalizing problems in the present study. Because risk factors may account for common variance in externalizing problems, we expected that some of the risk factors would not have unique effects when controlling for other risk factors. However, again studies with such large arrays of predictors over such lengths of development are few, and theoretical models cannot yet yield definitive hypotheses in such a set of variables, so we could not predict which variables would have the strongest links to externalizing behavior trajectories.
To further probe the meanings of the trajectories of externalizing behavior problems, we used individuals' predicted values of externalizing problems as predictors of several, particular, socially important illegal behavior outcomes. We also modeled the combinations of risk factors that were most predictive of one key outcome, having been arrested.
Method
Participants
Children (N = 585) were recruited for the Child Development Project (Dodge, Bates, & Pettit, Reference Dodge, Bates and Pettit1990) from two cohorts in 1987 and 1988 from three sites: Nashville, Tennessee; Knoxville, Tennessee; and Bloomington, Indiana. Children's parents were approached at random during kindergarten preregistration, on the first day of class, and by phone or mail. About 75% of parents approached agreed to participate. The schools and the composite sample reflected a broad range of SES groups that were representative of the populations at the respective sites. The Hollingshead index of SES (M = 39.53, SD = 14.01) ranged from 8 to 66 for the original sample (reflecting a broad range), which was 52% male, 81% European American, 17% African American, and 2% other ethnicity.
Measures
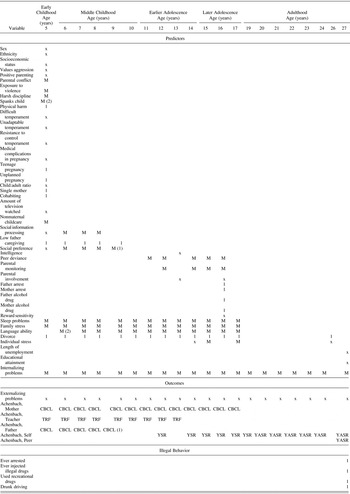
For a table of measures and at what ages they were collected, see Table 1. Rates of missingness for each variable are presented in Table 2.
Table of measures and when measured

Note: Times of measurement refers to when the data were collected, not necessarily the time frame to which the measure refers. No variables in the present study were collected at ages 18 or 25. x, Measured; M, mean across time (within time frame); 1, scored 1 if value is present at any measurement occasion within time frame, scored 0 if never present within time frame; (1), only in Cohort 1; (2), only in Cohort 2; CBCL, Child Behavior Checklist; TRF, Teacher Report Form; YSR, Youth Self-Report; YASR, Young Adult Self-Report.
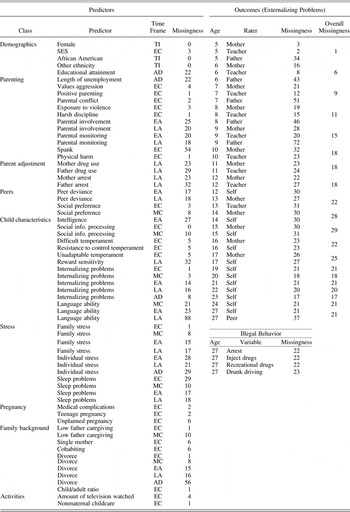
Rates of missingness (percentages) for all predictors (by time frame) and outcomes

Note: High rates of missingness were observed for spanking and father-reported externalizing problems at age 9 because data were only collected for one of the two cohorts. The overall missingness column reflects the rates of missingness for the externalizing score at each age after averaging externalizing scores across raters. TI, Time invariant; EC, early childhood; MC, middle childhood; EA, earlier adolescence; LA, later adolescence; AD, adulthood. Ethnicity was dummy coded into two variables (variable name in italic): African American = 1, European American = 0, other ethnicity = 0 and other ethnicity = 1, European American = 0, African American = 0.
Externalizing problems
Externalizing problems were measured by the externalizing subscales on the developmentally relevant Achenbach scales annually from ages 5 to 27 (except ages 18, 25, and 26): mothers' scores came from the relevant factor of the Child Behavior Checklist (CBCL; 33 items; Achenbach, Reference Achenbach1991a) from ages 5 to 17; teachers' scores from the Teacher Report Form (TRF; 34 items; Achenbach, Reference Achenbach1991b) from ages 5 to 13; fathers' from the CBCL from ages 5 to 9 (only for cohort 1 at age 9); self-reports from the Youth Self-Report (YSR; 30 items; Achenbach, Reference Achenbach1991c) at ages 12, 15–17, and 19, and the Young Adult Self-Report (YASR; 28 items; Achenbach, Reference Achenbach1997) from ages 20 to 24 and 27; peer reports from the YASR at age 27. In each of the scales, reporters rated whether a given behavior was not true, somewhat or sometimes true, or very or often true (scored 0, 1, and 2, respectively).
Although the different externalizing scales were obtained (from different raters at different ages) and the scales included different numbers of items, the externalizing subscales shared many overlapping items across the various Achenbach forms. As a result of the different numbers of items, the externalizing scores were adjusted across scale as a function of the number of items included in each version of the scale. We calculated a POM score for each participant at each age on the different scales available. For example, the CBCL externalizing subscale includes 33 items with a total possible score of 66. To calculate a POM on the CBCL, a participant's score was summed across items and then divided by the total possible score (66), and finally multiplied by 100 for interpretability. The resulting metric corresponds to a person's percentage out of the highest possible score on a 0–100 metric. The POM scores were then averaged within year across raters to form a composite score of externalizing problems at each age for the growth curve analysis. The percentage of participants with scores on externalizing problems at different numbers of time points can be found online in Supplementary Table S.1.
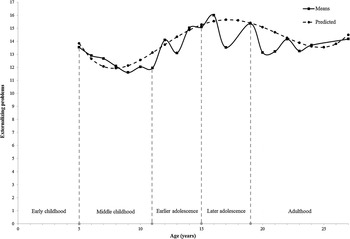
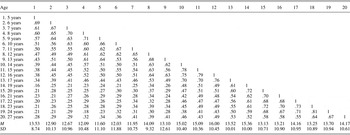
The Cronbach α values of externalizing problems ranged from 0.88 to 0.92 for mothers on the CBCL, 0.83 to 0.89 for fathers on the CBCL, 0.94 to 0.96 for the teachers on the TRF, 0.84 to 0.92 for self-reports on the YSR, and 0.83 to 0.91 for self-reports on the YASR, depending on the year; and 0.89 for peers on the YASR. Correlations across raters within year ranged from 0.24 to 0.71 (M = 0.40, ps < .001), depending on the year measured. Correlations within type of rater across years ranged from 0.34 to 0.77 for mothers (M = 0.61), 0.29 to 0.63 for teachers (M = 0.50), 0.58 to 0.079 for fathers (M = 0.68), and 0.28 to 0.81 for self-reports (M = 0.56; ps < .001), depending on the year. Correlations, means, and standard deviations of the POM-rescaled externalizing problems are in Table 3. Averages of externalizing problems over time by time frame are depicted in Figure 1.
Prototypical quartic trajectory of externalizing problems over time by time frame (overlaid with averages of externalizing problems over time).

Correlation matrix of externalizing problems and means and standard deviations

Note: All correlations are significant at p < .001.
In addition to the ratings of externalizing problems, illegal behavior was examined to verify the model predictions against particularly important and costly societal outcomes, including arrests, injecting illegal drugs, illegal drug use, and drunk driving. At age 27, adults reported whether they had ever been arrested, and 138 people (30%) reported that they had been arrested. At age 27, adults also reported whether they had ever injected an illegal drug (2%), used recreational drugs for nonmedical purposes in the past 6 months (excluding alcohol and nicotine; 26%), and driven after drinking 5 or more alcoholic drinks in a row in the past year (15%).
Predictors
Time frames
Some of the predictors were measured at only one time point, whereas other predictors were measured at multiple time points. In order to make inferences about the developmental timing of various risk factors, we split up predictors according to the following time frames: (a) time-invariant, (b) early childhood (0–5 years of age), (c) middle childhood (6–10), (d) earlier adolescence (11–14), (e) later adolescence (15–18), and (f) adulthood (19–27). Thus, if a predictor was measured at multiple time points, we either computed an average score for the predictor within the time frame for whichever time frames data were available (e.g., peer deviance in earlier adolescence versus later adolescence), or used a categorical index of whether the risk factor occurred during the time frame of interest (e.g., divorce in early childhood versus middle childhood). For predictors with multiple raters, the information was first combined across raters within year and then consolidated within time frame. A correlation matrix of the predictors and their means and standard deviations is provided online in Supplementary Table S.2.
Demographics
Child sex was measured at age 5 as male = 0, female = 1. Children's ethnicity was reported at age 5 as European American, African American, or other. Ethnicity was dummy coded into two variables (variable name in italics): African American = 1, European American = 0, other ethnicity = 0; and other ethnicity = 1, European American = 0, African American = 0. SES was measured by the Hollingshead Four Factor Index (Hollingshead, Reference Hollingshead1975) when the children were 5 years old, based on parents' education and occupational status. Because prior studies have shown that the effect of SES on externalizing problems is accounted for by more proximal aspects of socialization (Dodge et al., Reference Dodge, Pettit and Bates1994), we partialed out the variance of specific early childhood risk factors, for example, the child's exposure to violence, harsh discipline, and positive parenting, from SES in order to determine how (i.e., by which processes) SES affects risk for externalizing problems. SES was residualized for the collective risk models by regressing SES on the other risk factors at age 5 that were significant predictors of SES and saving the residuals to render the residualized SES term independent of the other early childhood risk factors.
Educational attainment was measured as the target individual's highest level of education attained as of age 27 on a scale of 1 to 10 (1 = 8th grade or lower, 10 = more than 4 years of school beyond high school). Length of unemployment was measured at age 27 as the total length of unemployment, in months, since high school (while not in school or at home having a baby). The length of unemployment also included time in jail or prison if he or she did not work.
Parenting
When the child was 5 years old, mothers rated their attitudes toward aggression on the Culture Questionnaire (Dodge et al., Reference Dodge, Pettit and Bates1994) on 15 items with a 7-point scale (1 = definitely disagree to 7 = definitely agree). Items included “If my child gets into a fight with another child, I won't try to stop it because my child has to show that she/he can defend herself/himself” and “I let my child watch adventure television shows that have killing and violence in them.” Five items were reverse-scored to reduce response bias. Internal consistency (α = 0.57) was low but acceptable for the present purpose.
Positive parenting was measured by maternal report in an interview of her discipline strategies in various hypothetical situations of child misbehavior (Concerns and Constraints Questionnaire; Pettit, Bates, & Dodge, Reference Pettit, Bates and Dodge1997). Five child misbehavior vignettes were presented (e.g., aggression, name-calling, and teasing others), and parents were asked how they could prevent their child from acting this way in the first place. Responses were coded on a 5-point scale (1 = do nothing, is unpreventable, 5 = preventive, anticipatory, situation specific). Internal consistency was 0.63.
At home when their child was 5 years old, interviewers asked parents about parental conflict, discipline practices, exposure to violence, and possible child abuse across two time frames: 1–4 and 4–5 years old. After discussing these issues, interviewers made ratings about physical harm, parental conflict, exposure to violence, and discipline (for information on interrater reliability, see Deater-Deckard et al., Reference Deater-Deckard, Dodge, Bates and Pettit1998). Interviewers rated the likelihood that the child had been physically harmed (with codes ranging from “definitely not” to “authorities involved”). Children were classified as physically harmed if the interviewer rated the likelihood of physical harm as probable or as having involved child welfare authorities in either time frame.
Interviewers rated the amount of parental conflict and violence during early childhood on a 5-point scale (1 = rarely even shout, 5 = physical, more than once). For both cohorts, interviewers rated the child's amount of exposure to violence on a 5-point scale (1 = none, 5 = physical, more than once). For Cohort 2 only, interviewers rated the child's level of exposure to violence inside and outside the home separately. For Cohort 2, the level of exposure was averaged across the ratings from within and outside the home. Exposure to violence was averaged across the two early-childhood time frames. Interviewers also rated the parents' use of harsh, punitive, and restrictive discipline on a 5-point scale (1 = nonrestrictive, mostly positive guidance, 5 = severe, strict, often physical discipline). Harsh discipline was averaged across the two early-childhood time frames.
On the Conflict Tactics Scale (Straus, Reference Straus1979) at age 5, mothers rated how often in the past year and in the first 4 years of the child's life they and their spouses threatened to spank their child, spanked their child, and spanked their child with something. Frequencies ranged from never (0) to almost every day (6). Spanking scores were averaged within parent then across parents, and then across time frames, and were only available for Cohort 2. Alphas ranged from 0.76 to 0.80, depending on the year. Correlations between parents' spanking ranged from .69 to .75 (p < .001).
At ages 12, 14, 15, and 16, youths rated how well their parents monitored them by how well their parents knew where they went after school, who their friends were, how they spent their money, where they went at night, and how they spent their free time. Ratings were 1 = the parents do not know, 2 = know a little, and 3 = know a lot. At ages 12, 14, and 15, parents' monitoring ratings were made for parents as a unit. At age 16 ratings were made for each parent separately, and then were averaged together. Internal consistency ranged from 0.74 to 0.99, depending on the year, except at age 12, in which it was 0.42. Parental monitoring was averaged within time frame.
At ages 13 and 16, we collected measures of the parents' involvement with the youth in terms of the average amount of time in hours over the course of a week that the parents sit around and talk with their teen and spend time with their teen doing things that the teen enjoys. Youths' ratings were made at age 16, and mothers' ratings were made at ages 13 and 16 (at age 16, mothers only reported on their involvement for Cohort 1). Correlations between the two items ranged from .36 to .41 (p < .001), depending on the year and reporter. The correlation between youths' and mothers' ratings at age 16 was .28 (p < .001).
Parent adjustment
Mothers' and fathers' drug problems were reported by each parent or, in cases where the child's mother or father was unavailable, by another primary caregiver who was knowledgeable about the parents' mental health. Drug problems were reported in the context of a Family History Epidemiologic Interview (Lish, Weissman, Adams, Hoven, & Bird, Reference Lish, Weissman, Adams, Hoven and Bird1995) at age 16. Each parent was scored as having an alcohol/drug problem if he or she had been reported by the self or other caregiver as having ever been hospitalized for drugs or alcohol, drunk a lot, had drinking problems, used illegal drugs, or had a drug problem. Parents' arrests were also reported by mothers and fathers, or in some cases, by another caregiver. The parent was considered as having been arrested if the mother, father, or other caregiver reported that he or she had ever been put in jail, arrested, or convicted of any crime (other than drunk driving or traffic violations).
Peers
Peer deviance was measured by the child's report of friends' deviant behavior on a questionnaire at ages 11, 12, 14, 15, and 16. We selected the common items assessed across ages to include in the peer deviance composite, which included asking the youth how often his or her friends steal things (from stores), get into fights with other kids, smoke cigarettes, lie to parents/teachers, get into trouble at school, suggest that he or she do something illegal, use bad language, and do things that make him or her scared or uncomfortable. At ages 12, 14, 15, and 16, ratings were made about the youth's friends in general. At age 11, the youth rated the deviance of the two children with whom they spent the most time. Ratings at age 11 were averaged across the two friends, and the scale of 1–3 at age 11 (1 = never, 2 = sometimes, 3 = very often) was rescored according to the corresponding levels of the 1–5 scale used at the other ages (1 = never, 2 = once in a while, 3 = sometimes, 4 = fairly often, 5 = very often; i.e., 1 = 1, 2 = 3, 3 = 5). Internal consistency ranged from 0.76 to 0.83. Peer deviance was averaged within time frame.
Social preference was measured by peer sociometric interviews from ages 5 to 9 (Keiley et al., Reference Keiley, Lofthouse, Bates, Dodge and Pettit2003). Children nominated up to three classmates they especially liked and up to three they especially disliked. The frequencies of liking and disliking were summed for the target child and standardized within their classroom. Social preference was calculated by subtracting the child's disliking score from his or her liking score, and scores were averaged within time frame. Social preference scores at age 9 were only available for Cohort 1.
Child characteristics
The child's intelligence was measured at age 13 by the average of his or her scaled scores (M = 10, SD = 3) on the block design and vocabulary subtests of the Wechsler Intelligence Scale—Revised (Wechsler, Reference Wechsler1974). The child's social information processing (SIP) was measured annually from ages 5 to 8 by responses to cartoon pictures and 24 video vignettes, which depicted child protagonists attempting unsuccessfully to enter peer groups and encountering provocation. After each video, children were instructed to pretend they were the protagonist, and responded to questions to assess their four steps of processing: encoding, attributions, response generation, and response evaluation, with higher values representing encoding deficits, hostile attributions, aggressive response generation, and aggressive response evaluation, respectively. The composite SIP variable for a given year represented the proportion of four SIP steps on which the child scored 1 SD above the mean or greater. Internal consistency for each of the four steps was strong at each age (Lansford, Malone, Dodge, Pettit, & Bates, Reference Lansford, Malone, Dodge, Pettit and Bates2010).
At age 5, mothers reported on their child's temperament retrospectively during infancy on the Retrospective Infant Characteristics Questionnaire (Bates & Bayles, Reference Bates and Bayles1984; Bates, Pettit, Dodge, & Ridge, Reference Bates, Pettit, Dodge and Ridge1998). Three dimensions of temperament were examined: difficultness, unadaptability, and resistance to control. Difficult temperament (α = 0.86) was measured by nine items related to the child's negative emotionality (e.g., how easily upset, how often fussing/crying). Unadaptable temperament (α = 0.72) was measured by four items related to negative reactions to novelty (new food, people, places, and adaptation in general). Resistance to control (α = 0.83) was measured by how often the child persists in playing with objects when told to leave them alone, continues to go someplace even when told to stop, and gets upset when removed from something he or she is interested in but should not be getting into. Ratings on each item ranged from 1 to 7, with higher values representing less optimal temperament traits (more difficultness, unadaptability, and resistance to control). Correlations between mothers' and fathers' ratings were .47, .34, and .37 (p < .001) for difficult, unadaptable, and resistance to control temperaments, respectively.
Reward sensitivity was measured at age 16 using a computerized card-playing task (Goodnight et al., Reference Goodnight, Bates, Newman, Dodge and Pettit2006), as adapted from Newman, Patterson, and Kosson (Reference Newman, Patterson and Kosson1987) and Siegel (Reference Siegel1978). In the task, participants played cards to win money (gaining $0.25 for turning over face cards but losing $0.25 when turning over number cards). Participants could stop playing at any point, up to 100 cards, and keep their winnings. The probabilities were structured to set the optimal number of cards played at 50 to maximize winnings. However, all winnings were lost after playing 100 cards. Reward sensitivity was measured as the number of cards played.
Internalizing problems were measured by the internalizing subscale of the Achenbach scales with the same raters and scales as were used for externalizing problems, and were POM rescaled. Cronbach α ranged from 0.81 to 0.90 for mothers, 0.82 to 0.84 for fathers, 0.85 to 0.91 for the teachers, 0.88 to 0.91 for self-reports on the YSR, and 0.89 to 0.92 for self-reports on the YASR, depending on the year; and 0.89 for peers on the YASR. Correlations within year across raters ranged from .06 to .51 (p = .144 to <.001), depending on the year. Correlations within rater across years ranged from .34 to .79 for mothers, .29 to .63 for teachers, .58 to .79 for fathers, and .28 to .81 for self-reports (p < .001), depending on the year. Internalizing problems were averaged within developmental time frames (as listed in Table 1).
Language ability was measured as the child's percentile score on the composite language section of a nationally normed standardized test, which was collected annually via official school records. A school records form with achievement test scores for the participants was completed by a school administrator. The school records were collected at the end of the school year in the summer, but the standardized tests were administered during the school year. School records from ages 7 to 10 were collected when the children were 10 years old, and school records from ages 11 to 13 were collected in the summer after each school year. The composite language ability score reflected two types of subtests, including language mechanics and language expression. Correlations between language mechanics and expression scores ranged from .59 to .71 (p < .001) depending on the year. Language ability was averaged within time frame.
Stress
Individual stress was reported by adolescents on the Changes and Adjustments Questionnaire (CAQ; Dodge et al., Reference Dodge, Pettit and Bates1994) at ages 14, 15, and 17. The adolescent reported whether they experienced each of 27 possible stressful life events in the prior year, including events such as “moved,” “serious illness or accident,” “close family member died,” and “money problems.” The number of stressful life events was summed within year. Individual stress was also reported by the target adult at age 26 on a list of 18 stressful life events in the past year. Individual stress was averaged within time frame.
Family stress was reported by mothers on the CAQ at ages 5–17. At age 5, mothers reported on the family stressors in the following time frames of the child's life: 0–1, 1–4, and 4–5 years old. At age 5, the mother reported whether the family experienced each of 15 possible stressful life events in the prior year, including events such as legal problems, job loss, and financial instability. At ages 6–17, the list included 18 possible stressors. The number of stressful life events was summed within year and then averaged within time frame.
The child's sleep problems were measured at ages 5–17 as the average of mothers' reports on 3 CBCL items: trouble sleeping, sleeps less than others, and overtired. Internal consistency was low (0.34 to 0.58, depending on the year) but acceptable for the present purpose. Sleep problems were averaged within time frame.
Pregnancy
Mothers reported whether there were medical complications during pregnancy, birth, and the first few months of the child's life, and interviewers coded the response (1 = healthy, 2 = minor problems, 3 = major problems). The mother's pregnancy was considered a teenage pregnancy if the mother gave birth to the target child when she was 18 years old or younger (coded as “1”). If the mother was 19 years old or older when she gave birth, it was coded as a “0.” When the child was 5 years old, mothers reported whether the target child was born to an unplanned pregnancy, and the interviewer coded the response as “0” if the pregnancy was planned, discussed, or accepted, and “1” if unplanned.
Family background
In the mother interview when the child was 5 years old, mothers were asked who the main caregivers of the child were and how much time per week the child spent with each in two different time frames: ages 1–4 and 4–5. Responses were then coded as to how much time per week was spent with the father in each of the time frames on a 5-point scale (1 = not in this type of care, 5 = major; more than 20 hr per week for more than 18 months). Low father caregiving was scored as a “1” if the child was considered not in the care of the father. If the father exhibited brief, moderate, frequent, or major care with the child, the father's caregiving was not considered low (scored as a “0”). From ages 6–9, father caregiving was reported by the mother. The number of hours per week that the father spent with the child in the prior year was rated on a 5-point scale (1 = occasionally or none, 5 = 30 or more). From ages 6 to 9, father caregiving was considered low if their caregiving was reported to be occasional or absent (i.e., less than 1 hr per week). Fathers' caregiving was considered low within the time frame if they met the criterion for low caregiving within any year of the given time frame.
The mother reported her marital status when the child was 5 years old. She was not considered a single mother (coded as “0”) if she reported that she was married, living with a partner, or living with another adult, whereas she was coded as “1” if she reported that she was single and living alone. She was not considered cohabiting (coded as “0”) if she reported that she was married or single and living alone, whereas she was coded as “1” if she reported that she was not married and was living with someone else.
Parents' divorce was rated as part of the CAQ. The mother reported whether she had divorced or separated from her partner in the prior year. At age 5, mothers reported whether a divorce occurred in the following time frames of the child's life: 0–1, 1–4, and 4–5 years old. From ages 5 to 17, mothers reported annually whether a divorce occurred in the prior year. At age 26, the target participant reported whether he or she had divorced from a spouse in the past year. If no new divorce or separation occurred within the time frame, it was scored as a “0,” whereas it was scored as a “1” if the participant (age 26) or the participant's mother (age 0–17) divorced or separated within the time frame. The child to adult ratio was calculated as the number of children in the household divided by the number of caregivers when the child was 5 years old.
Child activities
The child's amount of television watched at age 5 was calculated as the average number of hours of television watched alone per day during the week and on weekends on a 3-point scale (1 = 1 hr, 2 = 2–3 hr, 3 = 4 or more hr). The correlation between weekday and weekend was .46 (p < .001). Amount of nonparental childcare from birth to 1 year of age, 1–4, and 4–5 years of age was reported retrospectively by mothers in an interview when the child was 5 years old. Parents' responses concerning birth to 1 year of age were coded on a 7-point scale (0 = none, 6 = more than 30 hr per week for at least 7 months). From 1–4 and 4–5 years old, parents reported the amount of time that children spent in care outside the home in the following settings: a relative's residence, small group babysitter, group daycare, preschool, neighbors/friends, or other. Times were scored on a 5-point scale (0 = not in this type of care, 4 = major care, more than 20 hr per week. Childcare scores were summed across the types of care within age range. Childcare scores from the different ages were standardized with a z score before averaging across time frames. For coding reliability, see Bates et al. (Reference Bates, Marvinney, Kelly, Dodge, Bennett and Pettit1994).
Statistical analysis
To model growth curves of externalizing problems from ages 5 to 27, we used the lme function of the nlme package (Pinheiro, Bates, DebRoy, Sarkar, & the R Core Team, Reference Pinheiro, Bates, DebRoy and Sarkar2009) in R 3.0 (R Development Core Team, 2009) for hierarchical linear modeling (HLM). Because our aim was to predict risk for externalizing problems in adulthood, we set the intercept at age 27 rather than at age 5, consistent with other studies investigating externalizing trajectories (e.g., Owens & Shaw, Reference Owens and Shaw2003). Various curvilinear forms of growth were compared. After settling on a form of growth, we related the risk factors individually to the growth curves and then collectively (similar to the approach by Owens & Shaw, Reference Owens and Shaw2003), taking a best predictors approach.
After identifying all of the risk factors that were individually associated with the intercepts or slopes of externalizing trajectories, we combined the risk factors in one model. To avoid systematic bias in model parameter estimates and inferences, we used multiple imputation, which is preferable in developmental studies when there is missingness (Jeličić, Phelps, & Lerner, Reference Jeličić, Phelps and Lerner2009). We multiply imputed 20 data sets using Amelia II version 1.6.3 (Honaker, King, & Blackwell, Reference Honaker, King and Blackwell2011) in R to have adequate power (i.e., power falloff of about 1% with respect to full information maximum likelihood estimates) when missingness is between 10% and 50% (most of the variables in the present study; Graham, Olchowski, & Gilreath, Reference Graham, Olchowski and Gilreath2007). Amelia uses an expectation–maximization with bootstrapping algorithm, and is well suited for longitudinal data (Honaker & King, Reference Honaker and King2010). For accurate imputations, we imputed the data with a cubic polynomial to account for the effects of time over a long time span (23 years). We examined imputation diagnostics, including comparing the descriptives and distributions of observed and imputed data, overimputation (sequentially removing and imputing observed values as if they had actually been missing values), using overdispersed starting values (convergence in the imputations from different starting values), and examining time series to ensure the imputed data fell within the participants' general trends. Diagnostics suggested that the imputed data were acceptable. The conditional multilevel models were run on each imputed data set separately, and then the results were combined using the mitools (Lumley, Reference Lumley2010) and mix (Schafer, Reference Schafer1997) packages in R, which use Rubin's (Reference Rubin1987) rules for combining results of analyses on multiply imputed data sets.
The risk factors were examined collectively via forward selection in HLM growth curves. We used forward selection because it tends to be more accurate and conservative than backward elimination in selecting predictors (Derksen & Keselman, Reference Derksen and Keselman1992). The stepAIC function of the MASS (Venables & Ripley, Reference Venables and Ripley2002) package in R determined the best set of predictors by selecting iteratively only those predictors that incrementally improved model fit, as measured by the Akaike information criterion (AIC). The AIC balances the goodness of fit with the complexity of the model, by penalizing models with more predictors. The typical penalty for AIC is two times the number of parameters (Sheather, Reference Sheather2009), whereas we set the penalty to four times the number of parameters for a more conservative threshold for selecting predictors (Venables & Ripley, Reference Venables and Ripley2002). We kept a predictor if it was selected by forward selection in at least half of the imputed data sets (10/20). First, we selected predictors of the intercepts. Second, in a separate model, we selected predictors of the slopes. Third, we combined the predictors of the intercepts and slopes to select the best set of predictors. Fourth, nonsignificant predictors of the intercepts and slopes were removed to retain only significant predictors in the final model.
The predictions from the final model were then tested on illegal behavior, including arrests. Because the illegal behaviors were reported as binary (i.e., whether a behavior did or did not occur), we examined them in the context of receiver operating characteristic (ROC) curves, which examine the diagnostic utility of a given assessment tool by evaluating the trade-off between its sensitivity and specificity to predict the outcome. ROC curves were estimated using the ROCR package (Sing, Sander, Beerenwinkel, & Lengauer, Reference Sing, Sander, Beerenwinkel and Lengauer2005) in R. All of the descriptive statistics (means, standard deviations, and Pearson correlations) and the unconditional multilevel models are from the raw, nonimputed data set.
Analysis of missingness
The number of time points that participants had scores for externalizing problems was positively associated with SES, r (568) = .21, p < .001, two tailed. The number of time points that participants had scores for externalizing problems was not significantly related to their ending values of externalizing problems (B = –0.08, p = .112), but was related to their linear slopes of externalizing problems (B = 0.01, p = .006). Compared to participants with more time points of externalizing problems, participants with fewer time points had higher initial values of externalizing yet smaller increases in externalizing problems over time. In other words, participants who dropped out of the study had more externalizing problems at the earliest ages than nondropouts. The relation of missingness to SES and externalizing problems highlights the importance of conducting multiple imputation with these variables to help explain the pattern of missing data. The two cohorts did not significantly differ in terms of SES, t (558.82) = 1.60, p = .110, or in ending values (B = 1.25, p = .216) or linear slopes (B = 0.04, p = .535) of externalizing problems.
Results
Construct validity invariance
We examined whether externalizing problems showed construct validity invariance over time by examining the convergent validity of externalizing and its discriminant validity with respect to internalizing problems. Ratings of externalizing problems and internalizing problems were divided into 3 different blocks according to the primary raters within the era: Block 1 = ages 5–13 (parent and teacher report), Block 2 = ages 14–17 (parent and self-report), Block 3 = ages 19–27 (self- and peer report). POM-rescaled ratings were averaged across years within a given block. We tested whether externalizing problems predicted later externalizing problems more strongly than later internalizing problems.
Externalizing problems showed convergent validity across time from Block 1 to Block 2 (r = .65, p < .001) and from Block 2 to Block 3 (r = .62, p < .001). Although externalizing problems predicted later internalizing problems from Block 1 to Block 2 (r = .32, p < .001) and from Block 2 to Block 3 (r = .37, p < .001), the associations were stronger from externalizing problems to later externalizing problems than to later internalizing problems from Block 1 to Block 2 (Fisher r to z = 7.00, p < .001) and from Block 2 to Block 3 (z = 5.04, p < .001). Thus, there was cross-time convergent and discriminant validity for externalizing and internalizing problems across all three blocks.
Describing growth curves of externalizing
An unconditional means model with random intercepts was fit to the trajectories of externalizing problems and showed considerable within-person (σ2ε = 61.26, SD = 7.83) and between-person (σ20 = 56.33, SD = 7.51) variance, suggesting that the average person varies over time and that the cross-time means of externalizing problems differ between individuals.Footnote 1 Moreover, the intraclass correlation was ρ = 0.48, suggesting that about half of the variability in externalizing problems is between individuals, and that externalizing problems have a high residual autocorrelation over time.
To account for the change in externalizing problems over time, an unconditional growth model was fit with random intercepts and a linear random slope for time (a random intercepts and slopes model). The unconditional growth model was a better fitting model than the unconditional means model, χ2 (3) = 1382.63, p < .001, suggesting that externalizing problems change over time. Moreover, the model with a random effect of time fit better than a model with a fixed effect of time, χ2 (2) = 1300.16, p < .001, suggesting that trajectories of externalizing problems differed between individuals.
Curvilinear forms of change were examined. Quadratic forms of change were significantly better fitting than a linear model, χ2 (4) = 208.85, p < .001. Despite the modest variance in the quadratic curvature (σ22 = 0.002, SD = 0.05), the model that allowed the curvature to vary across individuals fit better than the model with a fixed quadratic curvature, χ2 (3) = 161.88, p < .001. There was not adequate variability across individuals in the cubic curves for cubic models to converge, so we examined subsequent polynomials with fixed effects. Models with a fixed cubic term fit better than models without the cubic term, χ2 (1) = 21.26, p < .001. Moreover, models with a fixed quartic term fit better than models without the quartic term, χ2 (10 = 120.22, p < .001. Models with a quintic term did not fit significantly better than models without a quintic term, χ2 (1) = 0.64, p = .423, so we chose the simpler quartic model for parsimony. To prevent overfitting, we split the sample into two random subsets of cases and examined the quartic model with each subset. The quartic model was the best fitting model for each subset. Thus, subsequent growth models examined trajectories of externalizing problems with random intercepts, linear slopes, and quadratic curvatures, along with fixed cubic and quartic effects.
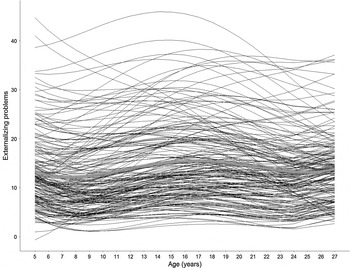
For a plot of the average quartic trajectory of externalizing problems overlaid with the means of externalizing problems over time, see Figure 1. The means of externalizing problems showed decreases from ages 5 to 11, followed by increases from 11 to 16, and decreases from 16 to 27. For a plot of individuals' quartic trajectories of externalizing problems, see Figure 2. Although the average trajectory is fairly flat, the individual trajectories show considerable variability, in intercepts, slopes, and curvatures, suggesting that the development of externalizing problems differs between people.
Random subsample of 250 individuals' predicted quartic trajectories of externalizing problems in black. Average trajectory in gray. The subsample is depicted rather than the whole sample for the sake of graphic clarity.

After the addition of the curvilinear effects of time, the proportional reduction in intercept variance (similar to ΔR 2; Peugh, Reference Peugh2010) was .49, suggesting that about half of the between-person differences in ending values of externalizing problems at age 27 was accounted for by the effects of time (i.e., linear, quadratic, cubic, and quartic slopes). Moreover, the positive correlations between the intercept and linear slope (r = .44) and the intercept and quadratic curvature (r = .09) suggest that the higher a person's slope and curvature, the higher his or her ending value of externalizing problems at age 27.
Predicting growth curves of externalizing
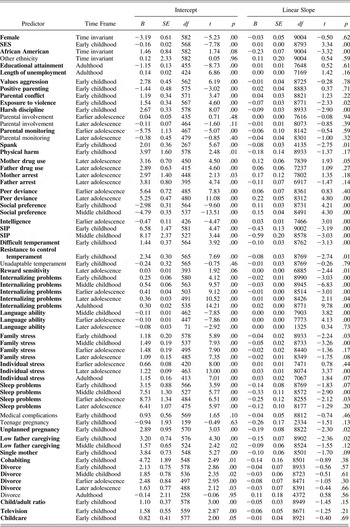
Although we fit a quartic model, for easier interpretability, we only examined whether risk factors predicted the intercepts and linear slopes of externalizing problems because the interpretation of predictors of polynomial terms is notoriously difficult (Grimm, Ram, & Hamagami, Reference Grimm, Ram and Hamagami2011). Each predictor was tested separately in two models: predicting the intercepts, and predicting the intercepts and slopes. Parameter estimates for the predictors of the intercepts in Model Set 1 and predictors of the slopes in Model Set 2 are in Table 4. Any variables that significantly predicted the intercepts or slopes were included in the multiple imputation. The significant terms were then examined collectively by forward selection.
Individual predictor models of risk factors predicting intercepts and linear slopes of externalizing problems

Note: Significant predictors are in bold. SIP, Social information processing. Ethnicity was dummy coded into two variables (variable name in italic): African American = 1, European American = 0, other ethnicity = 0 and other ethnicity = 1, European American = 0, African American = 0.
After imputation, SES was residualized by regressing SES on the other risk factors at age 5 that were significant predictors of SES, including positive parenting, single mother status, divorce, and child to adult ratio, and saving the residuals. In separate models, residualized SES did not significantly predict the intercepts (B = –0.18, p = .145) or slopes (B = 0.01, p = .875) of externalizing problems. Then we examined the significant predictors of the intercepts and slopes collectively by forward selection.
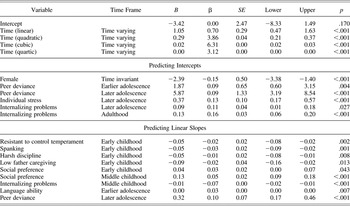
First, forward selection was used to select predictors of the intercepts. Second, in a separate model, forward selection was used to select predictors of the slopes. Third, the predictors of the intercepts and slopes were then combined, and forward selection was used to select the set of best predictors. After forward selection of the combined set of predictors, in the final model we included variables that were, in the separate analyses, significant predictors (p < .05) of the intercepts or slopes in the final model. The parameter estimates from the final model are in Table 5. We present the analyses with externalizing problems in their raw metric of POM scores. The POM scores were not very normally distributed, so we tested the model with square root transformed externalizing scores. The predictors remained essentially the same.
Final model

Note: Upper and lower represent the upper and lower bounds, respectively, of 95% confidence intervals. Some regression coefficients were too small to be visible with two decimal places, including time (quartic): B = 0.0005 (SE = 0.0001), and language ability (earlier adolescence): B = 0.0019 (SE = 0.0007). The standardized coefficients for the quadratic, cubic, and quartic effects of time were >1 because these predictors were perfectly correlated with the predictor representing linear time. Strong correlations among predictors make it likely for the predictors' standardized regression coefficients to exceed (−1, 1) (Deegan, Reference Deegan1978).
Six variables predicted individuals' intercepts of externalizing problems. The following groups/predictors were associated with higher ending values of externalizing problems at age 27: males, peer deviance (earlier and later adolescence), individual stress (later adolescence), and internalizing problems (later adolescence and adulthood).
Nine variables predicted individuals' slopes of externalizing problems over time. To understand how each of these nine risk factors was associated with changes in externalizing problems over time, we probed the effects with plots. We created separate plots to examine the effect of low (1 SD below the mean) and high (1 SD above the mean) values of each risk factor on the slopes of externalizing problems over time. Examining the plots showed that some predictors of the slopes were related to the initial values of externalizing problems. In these instances, the slopes converged over time for low and high levels of the risk factor. Because the slopes converged from different starting points, the effects of the risk factors on the slopes were detected as significant. The observation that the risk factors related to the initial values of externalizing problems was confirmed empirically by setting the intercepts to the initial rather than ending values in a separate model. The following predictors were characterized by higher initial values of externalizing, yet smaller increases or greater decreases in externalizing problems over time: resistant to control temperament (early childhood), spanking (early childhood), harsh discipline (early childhood), low father caregiving (early childhood), lower peer social preference (early and middle childhood), internalizing problems (middle childhood), and poorer language ability (earlier adolescence).
One interpretation for these effects on the slopes is that the risk factors did not have enduring effects. Alternatively, the slopes could reflect a self-righting characteristic of development (Kohlberg, LaCrosse, & Ricks, Reference Kohlberg, LaCrosse, Ricks and Wolman1972), which could be due to efforts families and individuals make to rein in uncomfortably high levels of behavior problems, whatever their source, as in the study concerning parental campaigns of increased involvement and control of the child (Goodnight, Bates, Pettit, & Dodge, Reference Goodnight, Bates, Pettit and Dodge2008). More simply it could reflect a statistical law, regression to the mean, where elevations resulting from risk factors eventually returned to typical levels. Another risk factor was associated with the slopes in different ways. Higher peer deviance in later adolescence was associated with greater increases in externalizing problems over time compared to lower peer deviance. Recentering the intercepts to different points in development (e.g., Muthén & Muthén, Reference Muthén and Muthén2000) showed that the effect of peer deviance in later adolescence on slopes of externalizing problems became significant in later adolescence (age 15) and remained significant in adulthood.
Several patterns are worth noting. First, although SES was individually associated with the intercepts and slopes of externalizing problems (see Table 4), residualized SES was not a significant predictor of the ending values or slopes of externalizing problems when controlling for more proximal risk factors (positive parenting, single mother status, divorce, and child to adult ratio). Second, males had higher ending values of externalizing problems than females, but males and females did not differ in their slopes (see Table 4). Third, in the individual models, African Americans tended to show greater increases in externalizing problems over time than European Americans, but African Americans no longer had greater increases than European Americans in externalizing problems over time when other risk factors, such as stress and peer deviance, were controlled.
A pseudo-R 2 of the final model was calculated by examining the squared correlation between the model's fitted and observed values (Singer & Willett, Reference Singer and Willett2003). The pseudo-R 2 for the final model was .70, suggesting that the model fit the data well and accounted for 70% of the variability in externalizing problems over time. Moreover, the proportional reduction in intercept variance with the addition of the risk and protective factors to the baseline quartic model was .06. Thus, the specific risk and protective factors accounted for an additional 6% of variability in the ending values above the effects of the linear, quadratic, cubic, and quartic terms.
Applying the model to predict illegal behavior
The model predictions were then used to predict illegal behavior including arrests. The fitted values of the final model were averaged across time and then across the multiple imputations. Therefore, the final fitted values represented the average level of predicted externalizing problems from ages 5 to 27. We only examined the predictions in relation to the observed values of the outcomes (the illegal behaviors were not imputed) to avoid overestimating the model's predictive ability. In ROC curves, the area under the curve (AUC) represents the probability that a randomly selected person meeting the diagnostic threshold (i.e., having been arrested) will have a higher test result (i.e., more externalizing problems) than a randomly selected person who does not meet the cutoff. The AUC represents the trade-off between a test's sensitivity and specificity. Sensitivity is the likelihood of correctly identifying individuals meeting the diagnostic threshold (true positive rate or hits). Specificity is the likelihood of correctly identifying individuals not meeting the diagnostic threshold (true negative rate or correct rejections). In general, a higher AUC, sensitivity, and specificity represent a better performing diagnostic test (range = 0–1, chance = 0.5).
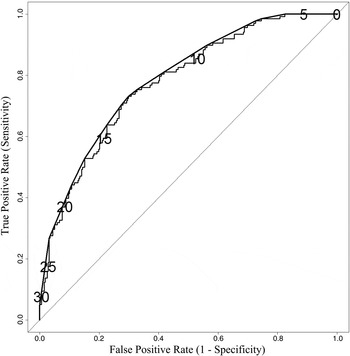
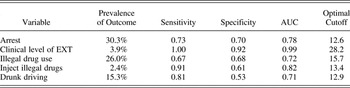
Predicting arrests, the predicted externalizing problems had an AUC of 0.78 (see Figure 3), indicating that the prediction was moderately accurate (Akobeng, Reference Akobeng2007). The optimal cutoff was defined as the number of externalizing problems that maximized the sum of the test's sensitivity and specificity. The optimal cutoff for arrests was 12.6 externalizing problems, at which point the sensitivity was 0.73 and the specificity was 0.70. A POM score of 12.6 corresponds approximately to a sum score of 9 externalizing problems on the CBCL and TRF, 8 problems on the YSR, and 7 problems on the YASR (where every rating of 1 counts as 1 problem and ratings of 2 count as 2 problems).
Empirical receiver operating characteristic curve of average predicted externalizing problems from the final model predicting arrests, overlaid with receiver operating characteristic convex hull and cutoff values for externalizing problems at various thresholds.

See Table 6 for the accuracy of the model's predictions for the other illegal behaviors. Predictions of whether a person had ever been arrested and had injected illegal drugs came from the average level of predicted externalizing problems from ages 5 to 27. Model predictions for the other outcomes (clinical level of externalizing, illegal drug use, and drunk driving) were from the model's predicted values of externalizing problems at age 27 because the outcomes occurred within the prior 6–12 months of reporting at age 27. The predictions had high accuracy for clinical levels of externalizing problems at age 27 (AUC = 0.99) and moderate accuracy for illegal drug use (AUC = 0.72), injecting illegal drugs (AUC = 0.82), and drunk driving (AUC = 0.71).
Sensitivity and specificity of model's predictions for clinical level of externalizing problems and illegal behavior

Note: The cutoff for clinical levels of externalizing problems (EXT) was selected as the number of externalizing problems at age 27 reflecting a score of 67 or above on the Young Adult Self-Report (i.e., 19 externalizing problems or a POM score of 33.9 for females and 22 externalizing problems or a POM score of 39.3 for males), as suggested by Achenbach (Reference Achenbach1997). Area under the curve (AUC) values above 0.9 indicate high accuracy, 0.7–0.9 indicates moderate accuracy, and 0.5–0.7 indicates low accuracy (Akobeng, Reference Akobeng2007). Prevalence of outcome refers to the percentage of the sample that exceeded the threshold for the clinical outcome.
Risk profiles associated with high risk of arrest
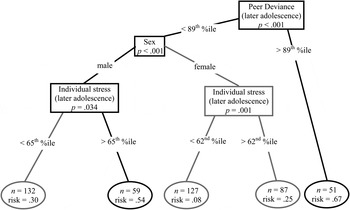
Because arrests were fairly prevalent in the sample (30%) and the final model's predictions were fairly sensitive and specific in predicting arrests, we examined the combination of risk factors that resulted in the greatest risk of arrest. We used a conditional inference tree with the ctree function of the party package (Hothorn, Hornik, & Zeileis, Reference Hothorn, Hornik and Zeileis2006) in R to determine the most common risk profiles among those who had been arrested. Using a conditional inference tree to identify the risk profiles associated with arrest may improve classification of those at greatest risk of arrest, which may lead to targeted, cost-effective interventions.
The conditional inference tree recursively estimated the association between risk factors from the final model and risk of arrest. First, the model selected the risk factor with the strongest association with arrest. Second, the model used a binary split on this risk factor at the cutpoint that maximized the discrepancy between the risk of arrest among the two subsamples (above and below the cutpoint). The model recursively repeated these steps with the next strongest predictor until the stop criterion, based on Bonferroni-adjusted p values, was met to prevent overfitting. The results of the conditional inference tree are depicted in Figure 4.
Conditional inference tree predicting arrest. Boxes represent binary splits at the cutpoint (corresponding levels or percentiles are specified) that maximized the discrepancy in the two subsamples' risk for arrest. Ovals represent subsamples with different combinations of values on the risk factors. Black lines, boxes, and ovals represent the high-krisk combinations of risk for arrest (risk of arrest ≥ 0.54). Gray lines, boxes, and ovals represent the low risk combinations of risk for arrest (risk of arrest ≤ 0.30).

The risk factor with the strongest association with arrest was peer deviance in later adolescence. The next strongest predictor of arrest was sex. Among females, their risk of arrest depended on individual stress in later adolescence. High individual stress, however, was not associated with particularly high risk of arrest among females who did not have high peer deviance (25% or less were arrested regardless of their levels of individual stress). Among males, in contrast, risk of arrest was strongly conditional on individual stress in later adolescence. Two risk profiles associated with particularly high risk of arrest were high peer deviance in later adolescence (above the 89th percentile) and males with high individual stress during later adolescence (above the 65th percentile). The first risk profile, high peer deviance, included 51 individuals of whom 67% were arrested. There were 59 males who had high individual stress in later adolescence, of whom 54% were arrested.
Discussion
The present study sought to describe and predict developmental profiles of externalizing problems longitudinally from childhood to adulthood using a developmentally informed actuarial approach. Findings suggested that, on average, externalizing problems decreased from early childhood to preadolescence (ages 5–11), increased during adolescence (11–16), and decreased again from late adolescence to adulthood (16–27). There was considerable variability in the developmental trajectories of externalizing problems. We were best able to account for individuals' trajectories with a quartic function. Further, many individual risk factors predicted the ending values at age 27 (intercepts) or the change over time (slopes) in externalizing problems. This affirms the theoretical and empirical basis for our selection of the risk variables. In a very broad sense, the findings replicate the prior research on factors in externalizing behavior problems. However, of course it would be expected that these risk factors have some degree of overlap. When we combined the predictors into one model to test collective risk, fewer predictors remained associated with the ending values or slopes of externalizing problems, suggesting that the risk and protective factors accounted for overlapping variance in externalizing problems.
Modeling the risk variables together allowed us to examine the unique contributions of individual risks when taking into account numerous other risk factors. The specific variables uniquely associated with higher ending values of externalizing problems at age 27 included male sex, peer deviance in early adolescence and later adolescence, individual stress in later adolescence, and internalizing problems in later adolescence and adulthood. Other variables were uniquely associated with the initial (age 5) levels of problems and with the slopes from ages 5 to 27. Temperamental resistance to control in early childhood, parents' spanking in early childhood, parents' harsh discipline in early childhood, low father caregiving in early childhood, lower peer social preference in early and middle childhood, internalizing problems in middle childhood, and lower language ability in earlier adolescence were characterized by higher initial values of externalizing yet smaller increases or greater decreases in externalizing problems over time, resulting in slopes for low and high levels of the risk factors that converged over time. Higher peer deviance in later adolescence was associated with greater increases in externalizing problems over time compared to lower peer deviance. Thus, the risk and protective factors provided incremental prediction across a wide range of ages and domains.
There were also notable nonpredictors of the development of externalizing problems. First, although males had higher ending values than did females, males and females did not differ in their slopes. Second, SES did not predict the ending values or slopes of externalizing problems when controlling for more proximal risk factors (positive parenting, single mother status, divorce, or child to adult ratio), suggesting that we were able to account for the commonly observed effect of SES with more proximal risk variables. This study thus provides new evidence of the operative mechanisms in the association between family SES and children's development of adjustment. Third, although African Americans showed greater average increases in externalizing problems over time compared to European Americans, African Americans did not have greater increases when controlling for other risk factors, suggesting that we were able to account for ethnic differences in trajectories with other risk factors.
We examined the associations between risk factors and externalizing problems in bivariate models that did not include other control variables and in multivariate models that controlled for other variables to identify the independent effects of the risk factors. There were three different patterns of associations and nonassociations of the risk factors with the intercepts and slopes of externalizing problems in the bivariate models and multivariate models. Of the 66 variables, 8 were not associated with the intercepts or slopes of externalizing problems in the bivariate or multivariate models: other ethnicity, parental involvement in earlier or later adolescence, parental monitoring in later adolescence, divorce in adulthood, and unadaptable temperament, medical complications, and teenage pregnancy in early childhood. These risk factors have been found to be related to externalizing problems in some prior studies. We did not observe an association, however, and we are not sure if these risk factors have had consistent associations with externalizing problems in all prior studies. Nevertheless, differences in findings may owe to methodological differences when examining growth curves from ages 5 to 27.
Of the remaining 58, there were also 44 variables that were associated with either the intercepts or slopes of externalizing problems in the bivariate models but not in the multivariate models. In these cases, the independent associations of the risk factors were too weak to be detected and their effects were statistically accounted for by other variables. Observing significant predictors in the bivariate but not multivariate models reflects collinearity among risk factors, and may reflect either mediation or cascade, where the effects of a risk factor can be explained by more proximal causes, or an artifact, where some variables had somewhat stronger associations with externalizing problems than others, and the stronger predictors were retained over weaker predictors. Whether for mediational or artifactual reasons, some variables likely could be grouped together to reduce collinearity. For example, some nonsignificant parenting predictors of externalizing problems (e.g., physical harm and positive parenting) could be subsumed under other parenting variables (e.g., spanking and harsh discipline). In other cases, some risk factors may be more salient to the individual (e.g., individual stress) than others (e.g., family stress). Another possibility is that some risk factors may have different effects at different developmental periods. For example, stress may be experienced particularly acutely in later adolescence because of the lagging development of the prefrontal cortex relative to the earlier developing limbic areas (Petersen et al., Reference Petersen, Bates, Goodnight, Dodge, Lansford and Pettit2012).
Fourteen variables, in contrast, were associated with the intercepts or the slopes of externalizing problems in both the bivariate and multivariate models, that is, had independent associations even after controlling for the other risk factors. Although the independent associations of these risk factors do not demonstrate causality, the robust associations of these risk factors with externalizing problems in this study and many prior studies point to candidate mechanisms for future research to examine. The incremental prediction of these risk factors may prove even more useful when specifying the developmental process linking them to the development of externalizing problems.
It is also encouraging that the predictions in the present study were somewhat accurate: The model accounted for more than two thirds of the variability in externalizing problems over time. The specific risk and protective factors accounted for approximately 6% of the variability in the ending values of externalizing problems at age 27 above the effects of time (linear, quadratic, etc.). The fact that considerable variance in externalizing problems appears to be explained by continuity (i.e., the effects of time) is consistent with the notion that past behavior is the best predictor of future behavior. However, continuity does not necessarily indicate stability of individuals' levels of externalizing problems over time: there were heterogeneous patterns of change within individuals across time. Moreover, even the continuity of externalizing behavior followed a nonlinear pattern of change across time. In general, the model was somewhat accurate in predicting within-individual changes in externalizing problems from ages 5 to 27. Nevertheless, we were able to augment our predictions using specific risk factors that explained variance in externalizing problems above and beyond the strong continuity of externalizing behavior over more than 20 years. In other words, taking into account family process, peer process, stress, and child characteristics like temperament and language ability can improve our predictive accuracy of the development of externalizing problems.
The model's predictions were tested on illegal behavior in an attempt to validate the actuarial model's predictive utility. The model's predicted values were a fairly good predictor of the person having been arrested, used or injected illegal drugs, and driven while drunk. Moreover, the risk factors for externalizing identified two risk profiles associated with high risk of arrest: high peer deviance in later adolescence (predicting a 67% risk), and males with high individual stress during later adolescence (predicting a 54% risk). These findings could reflect two possibilities. First, the risk profiles could reflect causal pathways involving deviant peers and, particularly for males, high stress. Second, the risk profiles could reflect markers of other, unmeasured causal processes. Even if the risk profiles represent markers rather than causal processes per se, they may still be useful in prediction, as was the case in the present study in which the risk profiles were fairly discriminating in terms of risk for arrest. Thus, evidence suggests that the externalizing profiles and their associated risk factors were meaningful for predicting important and costly societal outcomes. The risk profiles for arrest may lead to targeted, cost-effective interventions that take into account both risks and developmental stage (i.e., peer deviance and individual stress during later adolescence). For example, preventive interventions might target adolescents with deviant peers or adolescent males who are at risk of experiencing high levels of stress.
Given that we used changing measures of externalizing problems over time, it was necessary to consider whether the measures showed construct validity invariance. Earlier, we described five necessary conditions for construct validity invariance. The measures were chosen from subscales that were theoretically and developmentally meaningful; they were derived empirically (Achenbach & Rescorla, Reference Achenbach and Rescorla2001) with a similar factor structure across time (Reitz, Deković, & Meijer, Reference Reitz, Deković and Meijer2005); the externalizing problems in our study showed strong cross-time consistency; they showed strong convergent and discriminant validity over time with respect to internalizing problems; and the items showed high internal consistency at each age. Finally, the patterns of trajectories showed construct validity. Consistent with our findings, previous studies have shown decreases in externalizing problems from early childhood to preadolescence (Leve et al., Reference Leve, Kim and Pears2005), and we had found the same in the present sample (Keiley et al., Reference Keiley, Bates, Dodge and Pettit2000). In addition, studies show that rates of mental disorder increase from late childhood to adolescence, consistent with our findings of increasing rates of externalizing problems during the same time frame (Newman et al., Reference Newman, Moffitt, Caspi, Magdol, Silva and Stanton1996). Moreover, studies examining the age–crime curve show increases during adolescence and decreases during adulthood (Sampson & Laub, Reference Sampson and Laub2003), also consistent with our findings. Thus, we feel that there is theoretical and empirical support for the construct validity invariance of our measures of externalizing problems on a common metric, which permits examining the changes in externalizing problems over time.
Given changing measurement across time, we are unable to be completely certain that differences across time were reflective of actual change, and we therefore present our descriptions of the trajectories with caution. Nevertheless, we feel the externalizing profiles in the present study reflected meaningful individual differences in the development of externalizing problems, and the predictors of these problems were meaningful, as well. Heterotypic continuity is a developmental complexity that arises in many different domains, and we feel that seeking to understand and predict changes across important developmental periods is better than ignoring the phenotypic complexities associated with meaningful developmental change.
The individual components of the approach in the present study are not new. There are precedents in the literature of modeling actuarial predictions from growth curves (Deater-Deckard et al., Reference Deater-Deckard, Dodge, Bates and Pettit1998; Lussier & Davies, Reference Lussier and Davies2011), of modeling growth curve trajectories derived from different raters (Odgers et al., Reference Odgers, Moffitt, Broadbent, Dickson, Hancox and Harrington2008) and different measures/scales (Owens & Shaw, Reference Owens and Shaw2003; Pettit et al., Reference Pettit, Keiley, Laird, Bates and Dodge2007) from childhood to adulthood (Curran et al., Reference Curran, Hussong, Cai, Huang, Chassin and Sher2008), and of rendering measures more equivalent with proportional scoring metrics in the context of growth curves (McArdle et al., Reference McArdle, Hamagami, Meredith and Bradway2000). What is novel in the present study is the assembling of these approaches to predict risk for developing externalizing problems from childhood to adulthood. We believe this is a methodological and conceptual advance toward understanding development, because using different measures over time is necessary for describing development across long spans characterized by changes in how the same construct is manifested over time, or heterotypic continuity. Following Rutter and Sroufe's (Reference Rutter and Sroufe2000) argument that developmental psychopathology research should strive to understand development over the lifespan, we were able to chart the development of externalizing behavior over years in one piece by using developmentally appropriate, changing measures over time. An alternative approach for future studies might be to examine change over time in subdimensions of externalizing problems (e.g., physical aggression) in an attempt to focus on more homotypic patterns of change (e.g., Olson et al., Reference Olson, Sameroff, Davis-Kean, Lansford, Sexton and Bates2013). Nevertheless, we feel there is utility in examining the construct of general externalizing behavior because it is an efficient summary of many cases of psychopathology, the subdimensions tend to co-occur, and similar developmental processes appear to be involved with the different subdimensions (Olson, Bates, Sandy, & Lanthier, Reference Olson, Bates, Sandy and Lanthier2000).
Strengths and limitations
The present study had several strengths. First, the measurement of externalizing problems was theoretically and empirically based on developmentally relevant constructs. Second, it incorporated measurement of externalizing problems from multiple sources to reduce source bias. Third, it described and predicted developmental profiles from childhood to adulthood with numerous measurement occasions. Fourth, it considered many different domains of risk and developmental time frames. Fifth, it applied its predictions to illegal behavior in order to demonstrate the robustness of the model's predictive utility.
The present study also had several limitations. The use of changing measures in externalizing problems may limit our ability to draw conclusive inferences regarding developmental change. POM scores across different measures may not be comparable if their items have different severity. For instance, if items on one scale reflect a more severe level of psychopathology (e.g., uses drugs and sets fires) than items on another scale (e.g., argues and brags), the proportion scores may not be equivalent across the two scales. This may not be as much of an issue for the externalizing problem questionnaires in the present study because their items overlap substantially. For other research using more disparate scales, item response theory models or other advanced measurement models may be necessary for calculating trait or scale scores by linking items (e.g., Curran et al., Reference Curran, Hussong, Cai, Huang, Chassin and Sher2008). Even the same items could have different severities for different informants (e.g., self vs. mother), however, so the importance of ensuring that measures are conceptually and empirically equivalent is not specific to studies using changing measures. In any case, keeping the measures identical over time would not resolve the issue of measuring developmental change, because a static measure would likely not have construct validity invariance across the time frame in the present study due to the heterotypic continuity of externalizing problems. Changes in constructs over time require changes in measurement (Eddy et al., Reference Eddy, Dishion and Stoolmiller1998); failure to accommodate changes in the form of externalizing problems over time may make differences across age meaningless. Achenbach (Reference Achenbach2005) emphasized the need for measures to reflect the changing nature of externalizing problems, forming the theoretical foundation for the changes in items across development in the Achenbach scales according to developmentally relevant forms of externalizing behavior. Because of the developmental relevance of the scales, Owens and Shaw (Reference Owens and Shaw2003) also modeled externalizing trajectories with different Achenbach scales over time. In any case, we have attempted to show that the trajectories are meaningful insofar as they map onto other important externalizing problems. Moreover, we have shown evidence for the construct validity invariance of the externalizing problems over time, and there is prior support for the trajectories we identified.
Another limitation is that, because of the correlational nature of the present study, we cannot determine causality from any of the risk or protective factors that we examined. Nevertheless, the risk factors were chosen because of their theoretical importance for the development of behavior problems. In addition, there is an elevated likelihood of Type II error because of shared variance between the risk factors. In other words, we may have failed to detect meaningful associations because of overlapping variance and conservative cutoffs. There is an increase in power to detect associations in studies with repeated measures, providing further confidence in our findings (Muthén & Curran, Reference Muthén and Curran1997). Finally, we did not consider how risk factors may interact to influence externalizing problems. Emerging findings suggest, for example, that Temperament × Parenting interactions augment the prediction of children's externalizing behavior (Bates & Pettit, in press; Bates, Schermerhorn, & Petersen, Reference Bates, Schermerhorn, Petersen, Zentner and Shiner2012). Thus, future studies could extend these findings by testing the interactions among risk factors. Future studies might also consider the effects that risk factors may have on each other in successive developmental periods, such as models of developmental cascades (e.g., Cox, Mills-Koonce, Propper, & Gariépy, Reference Cox, Mills-Koonce, Propper and Gariépy2010; Dodge, Greenberg, Malone, & the Conduct Problems Prevention Research Group, Reference Dodge, Greenberg and Malone2008; Dodge et al., Reference Dodge, Malone, Lansford, Miller, Bates and Pettit2009; Lansford et al., Reference Lansford, Malone, Dodge, Pettit and Bates2010; Masten et al., Reference Masten, Roisman, Long, Burt, Obradović and Riley2005; Sitnick, Shaw, & Hyde, Reference Sitnick, Shaw and Hyde2014).
Conclusion
In summary, the present study considered the development of externalizing problems as a function of early risk factors along with successive risk and protective factors from early childhood to adulthood. The development of externalizing problems can be described in terms of multiple domains of risk, both from their momentum of adjustment (i.e., continuity) and from other risk across multiple developmental eras. The specific risk factors explained variance in the development of externalizing problems above and beyond the strong continuity of externalizing problems. Moreover, the continuity of externalizing problems was nonlinear across time. The findings support a model that simultaneously takes into account numerous characteristics of children and their living situations, and predicts trajectories of externalizing problems with a moderately high degree of accuracy. The study also suggests that the modeled trajectories and their predictions are also meaningful for important societal outcomes, including arrests, illegal drug use, and drunk driving. Nevertheless, there remains much room for improvement in terms of predictive precision. We expect to see improvements from further specification of the causal mechanisms, the consideration of additional risk factors from other domains (e.g., genetics), and modeling interactions among risk factors.
Supplementary Materials
The Supplementary Materials referred to in this article can be found online at http://journals.cambridge.org/dpp.