


Overweight and obesity are acknowledged as significant risk factors for the development of a number of diseases including type 2 diabetes, CHD, ischaemic stroke, hypertensive disease, breast cancer, colon/rectum cancer, corpus uteri cancer and osteoarthritis(1). The disease burden associated with overweight and obesity is considerable; the cost to the National Health Service in the UK has been estimated to be £3·2 billion per year(Reference Allender and Rayner2). Among developed countries, overweight and obesity is responsible for between 8 % and 15 % of disability adjusted life years lost(1, 3).
Globally, the prevalence of overweight and obesity is increasing. The prevalence of obesity (measured by self-report) increased in every state of the USA between 1995 and 2005, resulting in a nationwide increase from 15 to 24 % over this period(4). Current estimates suggest that 67 % of men and 69 % of women in England are overweight or obese(5). It is generally accepted that the prevalence of overweight and obesity in England has been rising for the last 15 years, for both men and women in all age groups(6) and that UK rates are amongst the highest in Europe.
Geographic inequalities in health in England are strong; rates of chronic disease tend to be worse in the North of England than in the South. For example, the rate of CHD in men in the North East of England has been at least 30 % higher than in the South East since the late 1970s and at least 60 % higher in women(Reference Allender, Peto, Scarborough, Boxer and Rayner7). Current regional differences in overweight and obesity prevalence in England mirror those of CVD, with higher levels in the North than in the South, particularly for women(8). It is unclear whether the difference in obesity prevalence between regions has been consistent over time or whether these geographical differences are widening or narrowing. It is also unclear whether these differences are a result of differing socio-economic conditions in the North and South of the country.
Information on temporal trends in overweight and obesity within regions is important in tracking the progression of the obesity epidemic and drawing inference about the best places to target public health intervention for greatest effect. This paper aims to examine the temporal trends in overweight and obesity within England and hypothesises that there is a difference in the trends over time between the Northern and Southern regions of England. It further aims to explore whether the difference between the regions is due to differing socio-economic conditions.
Methods
Data
BMI data from each of the Health Surveys for England (HSfE) conducted between 1993 and 2004 were analysed. The HSfE is an annual population-based survey conducted in England, which covers adults aged 16 years and above and has been running continuously since 1991/92. The annual surveys have collected data from national and regional representative samples of private households in England using a clustered random sampling frame with postcode sectors as the primary sampling unit(9). The same sampling frame was used in each survey to ensure comparability of results.
In each of the surveys, participants undertook computer-assisted interviews with a trained interviewer, who also gathered anthropometric measurements (height and weight) in a systematic manner. In 2004, 56 % of eligible adults (from an estimated sample size of 10 214) had anthropometric measurements taken. Response rates were lower for men than for women, and for younger (under 24 years) respondents(9). Between 1993 and 2003, the annual surveys achieved a participation rate between 60 % and 73 % for anthropometric measurement with similar differential response rates by age and sex as the 2004 survey. Fully cooperating household response by region is shown in Table 1. Response rates by geographical region at the individual level, or by social class or ethnicity, are not generally reported in the HSfE series.
Fully cooperating household response rate by survey year and North/South classification†
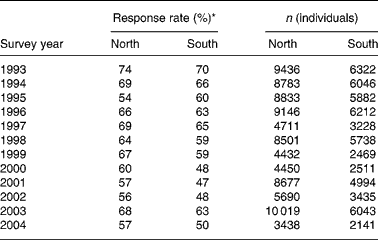
* Definition of North/South by survey year is shown in Fig. 1. Response rates for 1993, 1994 and 1997 are based on individual-level responses.
† For details of subjects and procedures, see Methods.
Data on all individuals aged 16 years and over with a valid BMI measurement were included in the current analysis. The prevalence rates that are presented here have been age-standardised to address the differing population structures in different regions of England. In addition to the annual core sample, a boost sample of a particular population (young people (18 years and under), elder people (65 years and over) and ethnic minority groups) was included in three of every four surveys. The boost samples for the young and elder populations were included in the analyses reported here, since the age-standardisation that has been applied to the prevalence estimates will address the resulting non-representative sample. The boost samples for the ethnic minority groups have not been included in the analyses, ensuring that the proportion of non-white respondents included for each survey year was reasonably stable (varying from 5 % in 1993 to 8 % in 2004) and reasonably consistent with the demographic structure of England – 9 % non-white residents at 2001 census(10).
Variables
The WHO criteria for defining overweight and obesity is based on BMI (kg/m2)(1). Overweight is defined as a BMI of at least 25 kg/m2 and obesity as a BMI of at least 30 kg/m2. Respondents with BMI ≥ 25 were considered to be overweight and those with BMI ≥ 30 were considered to be obese.
The HSfE datasets include information on the region of residence of each survey participant defined by governmental administrative boundaries. Different administrative structures were used throughout the study period and it has not been possible to use one consistent structure throughout. For survey years 1993 to 1998, National Health Service Regional Authorities (RA) have been used as a geographical variable. For survey years 1998 to 2004, Government Office Regions (GOR) have been used. A comparison between the two structures is possible by considering the results of the 1998 survey, as both RA and GOR were used.
The regional authority structure splits England into eight regions: Northern and Yorkshire; North West; Trent; West Midlands; Anglia and Oxford; North Thames; South Thames; South and West. The population of these regions ranged from 5 to 7 million people. The GOR structure splits England into nine regions: North East; North West; Yorkshire and the Humber; West Midlands; East Midlands; East of England; London; South East; South West. The population of these regions ranges between 2·5 and 8 million people.
A North–South variable was constructed by combining regions under each schema. Under RA, South was defined as the combination of the North Thames, South Thames and South and West. Under GOR, South was defined as London, the South East and the South West. North was defined as the remaining RA/GOR. Table 2 shows the size of the sample for those aged 16 years and above with valid BMI from the 1998 HSFE, split by both RA and GOR, and shows that of the 19 511 participants in 1998 there was broad agreement between the categorisation of North and South using the RA and GOR definitions. Only 1033 (5·3 %) participants were classified as North by the GOR definition and South by the RA definition; 778 (4·0 %) participants were classified as South by the GOR definition and North by the RA definition. The agreement between the two different definitions achieves a κ score of 0·81 (defined as ‘very good agreement’ by Altman(Reference Altman, Machin, Bryant and Gardner11)).
Number of over 16 year old respondents with valid BMI for the 1998 Health Survey for England, by Regional Authority (RA) and Government Office Region (GOR)*
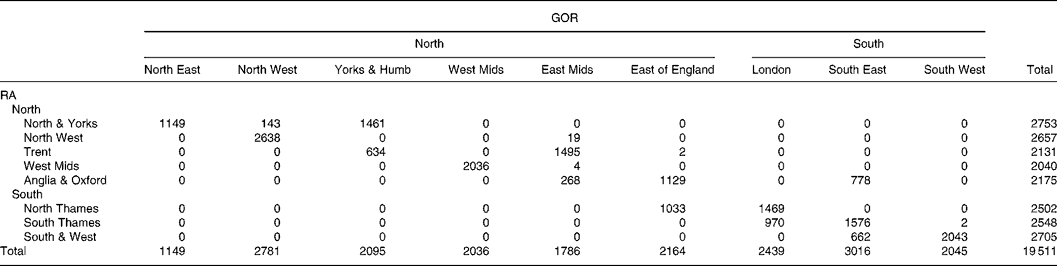
Yorks, Yorkshire; Humb, Humberside; Mids, Midlands.
* For details of subjects and procedures, see Methods.
The geographical boundaries between North and South using the two different definitions are displayed in Fig. 1.
Geographical boundaries between North and South: (a) using Regional Authorities (1993–98); (b) using Government Office Regions (1998–2004).

Occupational social class was recorded in each of the survey years and was used in the analysis as a measure of socio-econo- mic status. From 1993 to 1999 the social class measurement was based on the occupation of the head of the household, and from 2000 to 2004 was based on the occupation of the household representative person. For the purpose of this analysis, social class was defined as either non-manual (social groups I, II or IIINM) or manual (social groups IIIM, IV or V). Education was also considered as an alternative measure of socio-economic status. The highest qualification of each respondent was recorded in a similar manner for all surveys. For the purpose of this analysis, the respondents were categorised as either having higher qualifications than GCSE (national exams taken by schoolchildren in the UK at the end of year 11) or equivalent or otherwise.
Data analysis – prevalence rate trends
For men and women separately, age-stratified (in 10 year age bands from 16–24 to 75 years and above) estimates of the prevalence of overweight and obesity were made for each region of England. These estimates were combined to produce age-standardised estimates (directly standardised to the European Standard Population). Moving averages (3 year) for the regions were then developed to smooth variation in trends. The regions were then combined into the North and South variables and age-stratified and age-standardised prevalence estimates were made as before.
The 3-year age-standardised prevalence estimates for individual regions had an average sample of 2315 and an average within-age group sample of 584. The smallest sample size for the regional estimates was 748 and the smallest within-age group sample was 36. For the North/South prevalence estimates, the average sample for the age-standardised estimates was 2932 (minimum 926) and the average within-age group sample was 419 (minimum 63).
Data analysis – logistic regressions
For each survey year, and for the years 1993–98 and 1998–2004 (grouped by definition of North/South), the OR for overweight and obesity of residence in the North of England as compared with the South was calculated using logistic regression. Age-stratified and social class-stratified logistic regressions by grouped calendar year and over the entire study period were then performed to examine the evidence of effect modification by age or social class, before conducting further logistic regression analyses that adjusted for these two potentially confounding factors. The analysis was then repeated, replacing the social class variable with education level. These variables were not included in the analysis together as they were highly collinear.
Results
Demographic breakdown of sample
Table 3 provides a breakdown by sex, age, social class, education and ethnicity of the study dataset, separately for 1993–98 and 1998–2004.
Demographic breakdown of respondents to Health Surveys for England 1993 to 2004*

* For details of subjects and procedures, see Methods.
The sample from the South of England is significantly younger than the North of England and is less likely to be manual social class, have GCSE as a top qualification and be white. The sample taken from the later survey years (1999 to 2004) is significantly older than the earlier survey samples (in both the South and the North) and is less likely to be manual social class, have GCSE as a top qualification and be white.
Trends in the prevalence of overweight
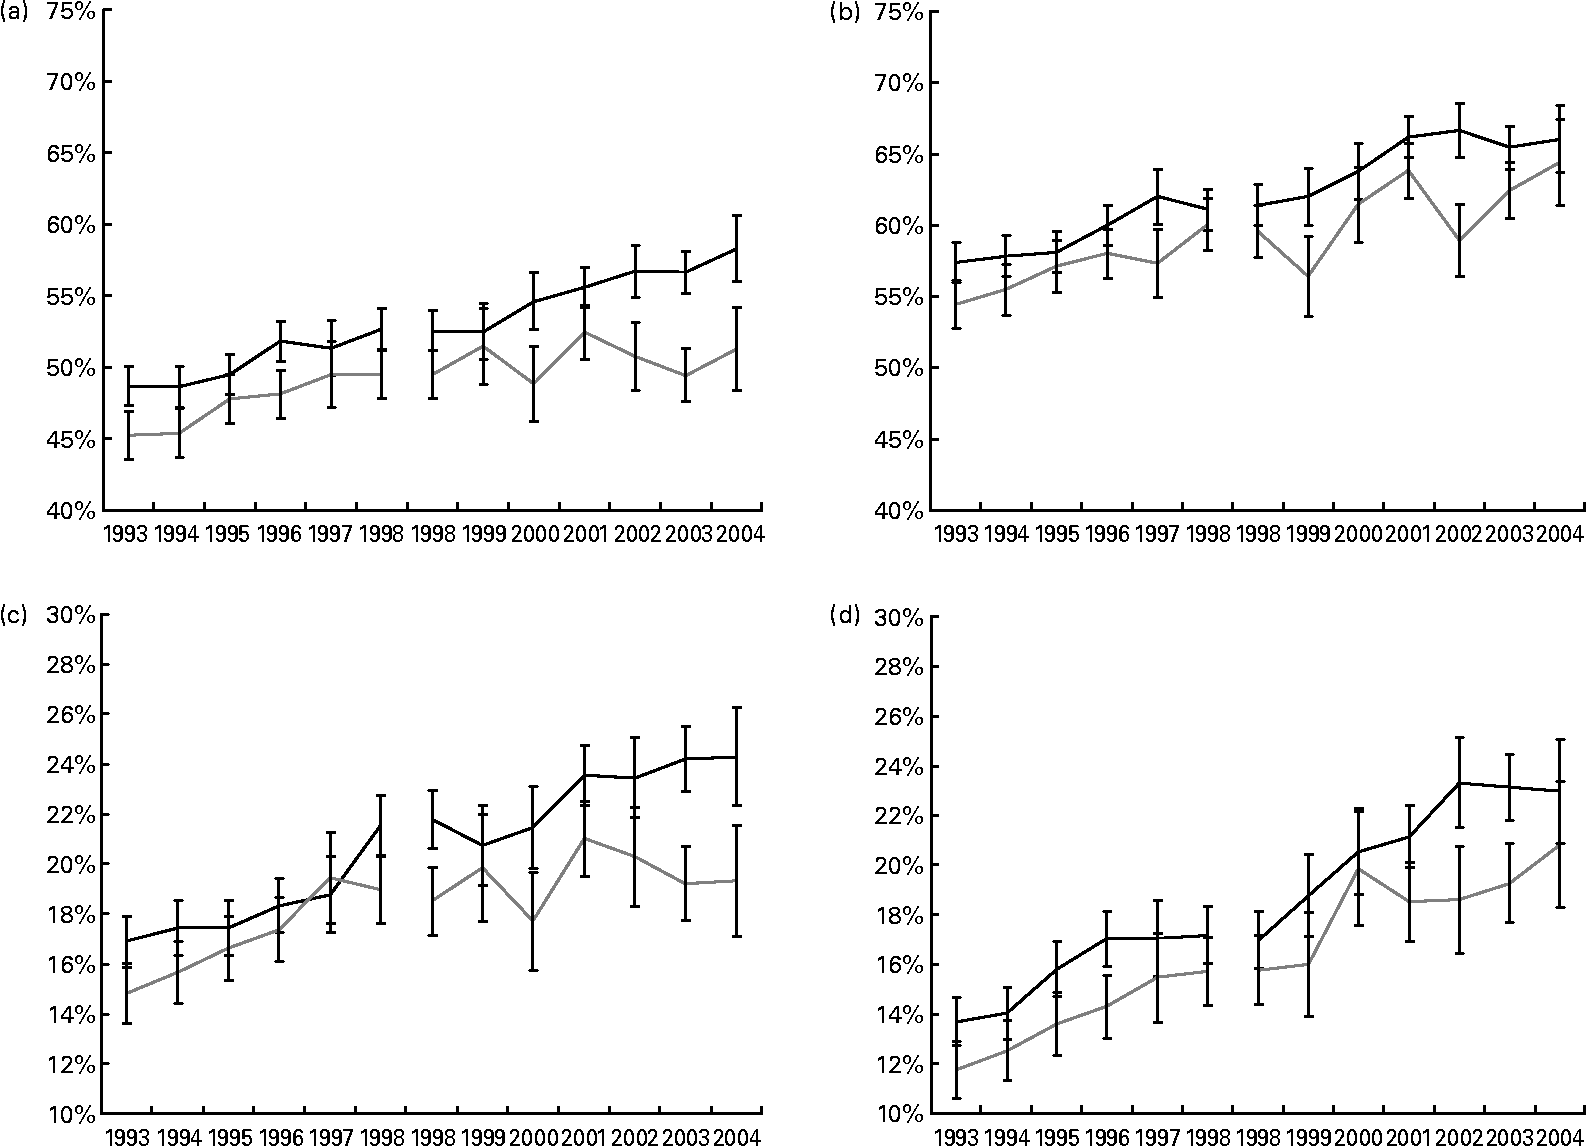
For women, the range of age-standardised prevalence of overweight in the regions of England has risen from 45–51 % to 49–59 % between 1993–95 and 2002–04. During this period, the difference in the prevalence of overweight between the North and South of England has increased from 4 % (49 % North; 45 % South) to 7 % (58 % North; 51 % South). The prevalence of overweight in women in the South has not substantially changed since 1997, whereas in the North the prevalence rate has continued to increase over the entire study period.
For men, the range of age-standardised prevalence of overweight in the regions of England has risen from 54–59 % to 58–67 % between 1993–95 and 2002–04. During this period, the prevalence rates of overweight in men in the North and South of England have mostly risen in parallel, with the prevalence in the South consistently lower than in the North.
Trends in the prevalence of obesity
The range of age-standardised prevalence of obesity in the regions of England has risen from 15–19 % to 19–26 % between 1993–95 and 2002–04 for women. During this period, the prevalence gap between the North and South of England has increased from 2 % (17 % North; 15 % South) to 5 % (24 % North; 19 % South).
For men, the range of age-standardised prevalence of obesity in the regions of England has risen from 11–17 % to 17–25 % between 1993–95 and 2002–04. During this period, the prevalence rates of obesity in men in the North and South of England have followed the same pattern as the prevalence rates of overweight, with the prevalence in the South consistently lower than in the North but the prevalence in both regions rising steadily.
Logistic regression analysis
The results of the age-stratified and social class-stratified logistic regression analyses suggest that for both men and women the effect of residence in the North/South may be stronger for younger, manual classes (see Table 4, which uses data from all survey years). However, in most cases the evidence supporting this is not strong. The results of the logistic regressions, after adjustment for age and social class are displayed in Table 5 and have been stratified by sex and broad age group to account for the possible effect modification.
Results of age-stratified and social class-stratified logistic regression analysis of the effect of residence in North/South on overweight (BMI≥25 kg/m2) and obesity (BMI≥30 kg/m2)*

* For details of subjects and procedures, see Methods.
Results of adjusted logistic regression analyses of the effect of residence in North/South on overweight (BMI≥25 kg/m2) and obesity (BMI≥30 kg/m2)*

* For details of subjects and procedures, see Methods.
A significant increase in odds of overweight or obesity for residence in the North is seen for men of all ages and for younger women. This increase in odds is independent of both age (within the broad age stratification) and social class and is in the region of 10 to 20 %. For younger men, the OR for North v. South is greater than that for manual v. non-manual social class, for both overweight and obesity.
The difference in odds between the North and South for both overweight and obesity has remained stable between 1993–98 and 1998–2004 for men (mirroring the parallel rise in overweight and obesity rates shown in Fig. 2). The OR for younger women have been increasing: the adjusted ratio for obesity jumped from 1·07 to 1·21 between the two timeframes, although the difference between these did not quite achieve statistical significance (Figs. 3 and 4).
Age-standardised prevalence of: (a) overweight (BMI ≥ 25 kg/m2) women; (b) overweight (BMI ≥ 25 kg/m2) men; (c) obesity (BMI ≥ 30 kg/m2) in women; (d) obesity (BMI ≥ 30 kg/m2) in men with 95 % CI by sex, North of England (—) and South of England ( ) 1993 to 2004.
Age-standardised prevalence (□, under 16·0 %;  , 16·0–19·9 %;
 , 20·0–23·9 %; ■, 24·0–27·9 %) of obesity in women: (a) 1993–95; (b) 1995–97; (c) 1998–2000; (d) 2000–02; (e) 2002–04.

Age-standardised prevalence (□, under 16·0 %; , 16·0–19·9 %; , 20·0–23·9 %; ■, 24·0–27·9 %) of obesity in men: (a) 1993–95; (b) 1995–97; (c) 1998–2000; (d) 2000–02; (e) 2002–04.

The data were re-analysed using the education variable in place of the social class variable with no substantial differences in the results.
Discussion
Statement of principal findings
The increase in the prevalence of overweight and obesity amongst adults in England between 1993 and 2004 was dramatic. The trend in the prevalence of both overweight and obesity shows early signs of a plateau for women in the South of England, whereas the prevalence for all men and for women in the North continues to increase.
The effect of residence in the North of England on overweight and obesity is substantial (an increase in odds in the region of 10–20 %) and is independent of individual social class and education level for all men and for women under the age of 55 years. The size of the effect appears to be growing for overweight and obesity for both men and women, although the increase is particularly large for younger women.
Strengths and weaknesses of the study
The HSfE series is ideal for studying trends in overweight and obesity in England, since the sampling frame and measurement techniques have remained constant since the early 1990s. The trends displayed here are unlikely to be a result of systematic bias caused by differences between the surveys. Additionally, it is unlikely that the data collection (height and weight measured by standard method by specially trained interviewer) should introduce measurement bias that could affect annual prevalence estimates or logistic regression analyses.
The response rates for valid BMI measurements were reasonably low and could lead to selection bias. In order to address this potential bias, the prevalence estimates for the regions were age standardised and logistic regression analyses were conducted, both age- and social class-stratified and adjusted for age and social class. No weighting or adjusting was introduced to allow for differences in response for other social variables (e.g. marital status, ethnicity). Bias introduced as a result of under-response by particular social groups should be small, since the HSfE sampling frame ensures a reasonably representative sample. The response rate in the North of England was generally higher than in the South (see Table 1), although the differences were not substantial. It should be expected that overweight or obese individuals were less likely to comply with anthropometric measurements, which would lead to an underestimate in the prevalence of these conditions and would bias the results of the logistic regressions towards the null hypothesis.
The two separate definitions of the South of England used in the present paper both draw around 30 % of respondents from London (see Table 2). It is likely, therefore, that the proportion of residents living in urban areas is higher in the South than in the North. This has not been accounted for in the analyses reported in this paper. Separate analyses that excluded residents from the North Thames and South Thames RA and the London GOR (not reported here) showed that the odds of being overweight or obese were higher in the North compared with the South after adjustment for age and social class, but the OR were generally lower than those reported in Table 5 (and in many case were not statistically significant due in part to reduced sample sizes). This suggests that the definitions of North and South used in this paper incorporate an element of urban v. non-urban, which may partially (but not entirely) explain the results shown in Table 5.
As the HSfE data are cross-sectional, the sample in each year is for different individuals from previous years. While this can be used to compare prevalence between years, it should not be used to infer temporal trends within individuals.
Strengths and weaknesses in relation to other studies
Although overweight and obesity trends in English adults have been tracked(6, 12) and regional disparities in overweight and obesity in England have been studied in cross-sectional studies(6, 13), to our knowledge this is the first attempt to look at the trends in the regional disparities of overweight and obesity in England. The present results concur with the findings of the HSfE in 2003, that the prevalence of overweight and obesity in both sexes is higher in the North of England, but adds that the highest rates of both conditions tend to be found in the Midlands. Our work concurs with the results of the National Diet and Nutrition Survey, the data of which are from 2000/01, in that a higher mean BMI was found in the North of England for both men and women. However, the categorisation of the North of England by the National Diet and Nutrition Survey differs to our categorisation, as it did not include the Midlands. The present results also concur with the estimate that over 25 % of adults in England will be obese by the year 2010(12). If the trends shown here continue, it is likely that at least 25 % of women in the North and men from the North and the South will be obese, but only around 18–20 % of women from the South will be obese.
Other studies have reported area effects on overweight and obesity that are independent of individual socio-economic status and have done so using smaller areas of interest than studied here. The Renfrew and Paisley study showed that mean BMI was positively associated with neighbourhood deprivation after adjustment for age and social class for women, but not for men in a cohort from the West of Scotland(Reference Davey Smith, Hart, Watt, Hole and Hawthorne14); similarly, the mean BMI of four neighbourhoods in Glasgow were shown to be positively associated with deprivation after adjustment for age, sex and social class(Reference Ellaway, Anderson and Macintyre15). The area effect reported here is likely to be an underestimate of the effect of area-level deprivation on overweight and obesity in England, since the areas chosen for study were large and consist of heterogeneous cities, towns and neighbourhoods. In contrast to the results of the Renfrew and Paisley study (based in the West of Scotland rather than England), the present results suggest that both men and women experience an independent area-level effect on overweight and obesity but this effect diminishes with age, particularly for women.
Meaning of the study
The implication of the present results is that the geographical inequality in overweight and obesity is increasing for women. As this increase seems to be due to younger women, we can expect the inequality to continue to grow as the cohort of young women ages. This could exacerbate inequalities in other health outcomes, such as diabetes and CVD.
Unanswered questions and future research
The reasons for the geographical differences in overweight and obesity need to be properly understood. The current study has shown that the geographical differences are not due to differences in social class or education between the populations. Further work should be aimed at addressing what socio-cultural factors are driving the inequality and should also include an exploration of environmental factors, including access to services and deprivation.
The geographical difference in the trends in prevalence rates for women should also be further examined: the prevalence of overweight women in the South has remained stable at approximately 50 % since 1997, whilst in the North this rate has increased from 51 to 58 %. Similarly, the prevalence of obese women in the South has remained at approximately 19 % since 1997, whilst the prevalence in the North has increased from 19 to 24 %. Understanding why the prevalence of overweight and obese women in the South has stabilised could provide us with tools for addressing increasing prevalence rates for other social groups, including children.
Conclusion
There are clear geographical differences in the prevalence of overweight and obesity in England. In the last 10 years the gap between women in the South of England and the North of England has increased. If the trend in widening geographical inequalities in overweight and obesity rates in women continues, then the North–South gap in CVD rates in women could be exacerbated.
Acknowledgements
P. S. and S. A. are supported by the British Heart Foundation. There are no conflicts of interest. This research was based on the HSfE series, produced by the National Centre for Social Research and University College London, sponsored by the Department of Health and supplied by the UK Data Archive. The data are Crown copyright.



