The role of task has received an increasing amount of attention in the SLA literature over the past three decades. One particularly fruitful area of research has explored the relationship between task-related variables and second language (L2) task performance. Although most definitions of pedagogic task include—either implicitly or explicitly—activities involving any of the four skills (i.e., reading, writing, speaking, and listening) (e.g., Ellis, Reference Ellis2003; Samuda & Bygate, Reference Rupp, Garcia and Jamieson2008), most past research has been directed at the skills of writing and speaking. To date, comparatively little research has addressed the issue of how task-related factors may influence learner performances involving receptive skills, and, particularly, scant attention has been paid to the investigation of listening task characteristics. Nonetheless, the studies that do exist have identified some task features that may influence the quality of listening task performance, including characteristics associated with the nature of the task input, the task procedures, the task outcome, and their interactions (Bloomfield et al., Reference Bloomfield, Wayland, Rhoades, Blodgett, Linck and Ross2011; Rubin, Reference Rost1994; Vandergrift, Reference Tettamanti, Manenti, Della Rosa, Falini, Perani, Cappa and Moro2007).
The present study intends to build and expand on this line of research by exploring the contribution of a group of task factors to advanced L2 learners’ success in completing an English as a second language (ESL) listening comprehension task. In particular, we examine the extent to which the speed, the linguistic complexity, and the explicitness (i.e., the extent to which the ideas are explicitly expressed) of the input text, along with characteristics of the textual information needed for task completion, influence L2 listening comprehension. In addition to considering how features of the listening text relate to task responses or the product of listening, we attempt to gain information about L2 listeners’ own perspectives about this link by the means of perception questionnaires and stimulated recall methodology. We also extend the scope of inquiry to some new text characteristics in the area of linguistic complexity, and, when appropriate and feasible, we use improved measures to capture the effects of previously explored factors.
BACKGROUND
According to Rost (Reference Rost and Hinkel2011), L2 listening is a complex cognitive process that can be defined in terms of four overlapping mechanisms: neurological, linguistic, semantic, and pragmatic processing. Neurological processing involves the physical and neurological processes associated with hearing and listening, such as converting external sound waves to auditory perceptions and the processes of arousal, attention, and focus, which form the basis of attention. Linguistic decoding or bottom-up processes include perceiving sounds and intonation units in the input, recognizing words and phrases, activating lexical knowledge associated with the identified words and phrases, and finally, translating the incoming speech into syntactic representations through syntactic processing or parsing. Semantic or top-down processing covers those aspects of the listening process that allow the listener to link the linguistic information to his or her world knowledge and personal experience. In particular, semantic processing involves isolating salient information (e.g., distinguishing new information from old information), activating relevant schemata or mental knowledge networks against which the input is compared, making inferences on the basis of what is explicitly stated in the text, and updating memory representations guided by the previous semantic processes. Pragmatic processing encompasses the evaluation of the speaker’s meaning against the listener’s expectations, the activation of the social frame (i.e., the roles and statuses participants have in the interaction), and the integration of contextual information. As a result of these pragmatic processes, the listener becomes equipped with the ability to provide interactive responses while listening and to supply substantive responses in reaction to the speaker’s message (Rost, Reference Rosenhouse, Haik and Kishon-Rabin2005, Reference Rost and Hinkel2011).
These four kinds of processes and their subprocesses act in a simultaneous- and parallel-distributed fashion, drawing on various types of knowledge sources such as linguistic (i.e., phonological, lexical, morphosyntactic, and pragmatic) knowledge, world knowledge, and knowledge about the specific communicative context (Buck, Reference Buck2001; Hulstijn, Reference Hulstijn2003; Vandergrift, Reference Tettamanti, Manenti, Della Rosa, Falini, Perani, Cappa and Moro2007). A major factor in effective listening, then, is the ability to integrate information in real time on the basis of the complex web of interactions among the various levels of knowledge representations (Rost, Reference Rosenhouse, Haik and Kishon-Rabin2005). Although proficient listeners engage in this process automatically with the involvement of little or no conscious attention, less competent listeners may need to rely more extensively on controlled, conscious processing, as they have limited L2 knowledge and less efficient processing skills (Segalowitz, Reference Sanders, Spooren and Noordman2003). Given that controlled and conscious listening processes are more taxing for the limited capacity of working memory (Baddeley, Reference Baddeley2003) than automatic processes, less proficient L2 listeners often have difficulty in processing aural input (Buck, Reference Buck2001; Vandergrift, Reference Tettamanti, Manenti, Della Rosa, Falini, Perani, Cappa and Moro2007; Vandergrift & Goh, Reference Vandergrift2009), resulting in partial comprehension or miscomprehension of what has been heard. Research suggests, however, that the nature and extent of the difficulty that L2 listeners experience appears to vary depending on a broad number of factors, including several task-related characteristics.
Among the task characteristics explored to date are factors associated with the task input (i.e., linguistic or nonlinguistic information presented in the task), task procedures (i.e., how the task is implemented), task output or task response, and interactions between task input and output characteristics (see Bloomfield et al., Reference Bloomfield, Wayland, Rhoades, Blodgett, Linck and Ross2011; Vandergrift, Reference Tettamanti, Manenti, Della Rosa, Falini, Perani, Cappa and Moro2007, for extensive reviews). In this study we further explore the extent to which listening task performance is affected by a group of task input factors (i.e., speed, linguistic complexity, and explicitness of the listening text) and their combinations with task response characteristics (i.e., lexical features of the text containing the information needed to respond). A detailed review of previous research investigating these factors is presented in the next sections.
Speed of Delivery
Speed of delivery has been proposed as a key factor influencing L2 listening comprehension. Given that faster speech allows listeners shorter access to the incoming input, it is reasonable to assume that a faster speed will increase less proficient L2 users’ listening difficulty, as their processing skills are less automatic and, hence, slower. Several experimental studies have confirmed that faster speed tends to negatively affect the processing of L2 spoken language. For example, Griffiths (Reference Griffiths1990, Reference Griffiths1992) provided evidence in two experimental studies that increasing speech rate leads to lower comprehension scores for Japanese learners of English at the low-intermediate level. Rosenhouse, Haik, and Kishon-Rabin (Reference Rasch2006) presented similar findings for advanced L2 users of Hebrew in an experiment examining the impact of speech rate and noise on speech perception. As hypothesized, increased rate of delivery was associated with weaker performances in both the participants’ first language (L1; i.e., Arabic) and their L2, but greater effects were observed for performances that involved listening in the L2. Unlike in Griffiths’s and Rosenhouse and colleagues’ respective work, in which speech rate was preset by the researchers, Zhao (Reference Ying-hui1997) allowed L2 learners to adjust speech rate for themselves during an experiment. Zhao found that the majority of the learners took advantage of the opportunity to slow down the speed of delivery, which, in turn, had a positive influence on their listening performance. It is also worth noting, however, that although L2 listening comprehension appears to be affected by increased speech rate, there is research suggesting that slowed rates are not always preferred by L2 listeners. Derwing and Munro (Reference Derwing and Munro2001), for example, reported on an experiment in which ESL learners favored narratives at unmodified speed over slowed versions.
Findings from nonexperimental research also point to a link between speech rate and listening performance. Buck and Tatsuoka (Reference Buck and Tatsuoka1998) explored the extent to which listening test difficulty may be predicted by a set of listening text and response characteristics that included speech rate. Although faster speech rate alone was not identified as a significant predictor, it seemed to increase listening difficulty in combination with features such as textual redundancy and whether the information necessary to respond correctly was part of longer idea units. Brindley and Slatyer (Reference Brindley and Slatyer2002) examined the effects of several task-related factors on the difficulty of listening test items. Their findings, overall, suggest that faster speech rate is likely to have a negative effect on listening performance. According to the researchers, however, the complexity of the interactions among the various task factors made it challenging to separate the impact of specific variables.
Another methodological issue, as also noted by Brindley and Slatyer, concerns what index should be used to assess speed of delivery. The two most common measures that have been employed in listening research are words per minute (WPM; e.g., Brindley & Slatyer, Reference Brindley and Slatyer2002; Griffiths, Reference Griffiths1990, Reference Griffiths1992; Zhao, Reference Ying-hui1997) and syllables per second (e.g., Derwing & Munro, Reference Derwing and Munro2001). Words per minute—albeit the most widely used measure to date—has the disadvantage of not controlling for word length; that is, texts delivered at a similar speed could yield different WPM values if the proportions of monosyllabic versus multisyllabic words vary across listening texts (Bloomfield et al., Reference Bloomfield, Wayland, Rhoades, Blodgett, Linck and Ross2011; Griffiths, Reference Griffiths1990, Reference Griffiths1992). Although syllables per second takes account of variation in the number of syllables per word, measures at the syllable level often discount silent intervals beyond a certain threshold (i.e., length of the silent interval). Thus, they are likely to capture articulatory rate but supply little information about pausing behavior (Bloomfield et al., Reference Bloomfield, Wayland, Rhoades, Blodgett, Linck and Ross2011). Because previous research has shown that pauses at natural boundaries facilitate comprehension (e.g., Blau, Reference Blau1990), probably due to the increased processing time available (e.g., Buck, Reference Buck2001), Bloomfield and colleagues have called for research that employs articulatory rate as well as measures of pause phenomena in future studies.
Linguistic Complexity
A number of linguistic cues, including phonological, lexical, syntactic, and discourse features, have been shown to play a role in decoding L2 auditory information. In this section, we describe and discuss previous research that is directly relevant to the variables examined in this investigation.
Phonological Complexity.
For measures of phonological complexity, we focused on four variables in this study: phonotactic probability, frequency of elisions, rhythm, and pitch.
Phonotactic probability.
Phonotactic probability refers to “the frequency with which phonological segments and sequences of phonological segments occur in words in a given language” (Vitevitch & Luce, Reference Vandergrift, Goh, Doughty and Long2004, p. 481). More specifically, positional segment frequency captures how often a certain sound occurs in a particular position in a word, whereas biphone frequency indicates the probability of two segments co-occurring adjacently within a word. For example, the consonant /s/ and the semivowel /j/ can both be found word initially in English, but the segment /s/ occurs more frequently in word-initial position than the segment /j/. Thus, /s/ appearing word initially has a greater phonotactic probability or positional segment frequency than /j/. Likewise, the word-initial biphone sequence /sʌ/ carries higher phonotactic probability or biphone frequency than /ji/ because /sʌ/ is a more frequent word-initial sequence in British English (Vitevitch & Luce, Reference Vandergrift, Goh, Doughty and Long2004).
There is growing evidence that phonotactic probability influences spoken language comprehension by infants (Mattys & Jusczyk, Reference Mattys and Jusczyk2001) and adults (Pitt & McQueen, Reference Pitt and McQueen1998) in their L1, such that words that include high-probability segments and sequences of segments are easier to process than words comprising low-probability segments and sequences of segments. There is also a small amount of research that demonstrates that L2 listeners recognize more frequent L2 segment sequences more accurately than less common ones (e.g., Bradlow & Pisoni, Reference Bradlow and Pisoni1999). So far, however, researchers have focused on the effects of phonotactic probability in isolated words, and little attention has been paid to how it may affect the comprehension of listening passages.
Frequency of elisions.
Elision, a common feature of spoken input, involves the omission of a phoneme in speech. It has been argued that the presence of elision—and other types of sandhi variation or use of reduced forms such as assimilation, contraction, and linking—makes the decoding process more demanding for L2 listeners, given that the phonemic information missing from the input may make the recognition of words and syntactic patterns more difficult (e.g., Rubin, Reference Rost1994). Indeed, Henrichsen (Reference Henrichsen1984), in an experimental study comparing L1 and L2 listeners, found that sandhi variation made listening comprehension significantly more challenging for ESL learners as compared to native listeners. On the other hand, Kostin (Reference Kostin2004) detected no effects of the presence of reduced forms in investigating the difficulty of TOEFL dialogue items. However, as acknowledged by Kostin herself, this result needs to be treated with caution due to the fact that coding for sandhi variation was based on scripts rather than the actual recording of the dialogues, which may have jeopardized reliability.
Rhythm.
Rhythm is responsible for arranging speech into a pattern of recurrent temporal units or events. Rhythmic variability can be expressed in terms of a measure called the pairwise variability index (PVI), which captures the degree of variation in the durations of subsequent intervals. A greater amount of rhythmic variability is associated with a higher PVI. Speech rhythm has been shown to be a significant cue in L1 listening comprehension because it allows listeners to predict when semantically important information will occur in speech (Allen & Hawkins, Reference Allen, Hawkins, Yeni-Komshian, Kavanagh and Ferguson1980). Some research suggests that the efficiency of L2 listening comprehension may also be affected by rhythmic patterns. For example, L2 speech processing has been found to suffer due to differences in rhythmic structure between the L1 and the L2 (e.g., Cutler & Otake, Reference Cutler and Otake1994). It is also possible that listening difficulty is influenced by within-target language variation in rhythmic patterns, although this idea has been little explored to date.
Pitch.
Pitch is the acoustic equivalent of intonation and refers to the degree of highness or lowness of speech. The pitch of a sound signal is primarily determined by the frequency of sound waves generated by the vibrations of its source: the vocal cords, in the case of human speech. Pitch can be quantified as the rate of vocal cord vibrations per second or fundamental frequency (F0). Pitch perceived as higher is associated with higher F0 values. Previous research indicates that L1 speech processing by adults is not affected by variability in F0 (e.g., Sommers & Barcroft, Reference Singh, White and Morgan2006). However, changes in pitch were demonstrated to influence infants’ lexical processing (Singh, White, & Morgan, Reference Segalowitz and Long2008). To date, little is known about the effects of pitch on L2 listening comprehension.
Lexical Complexity.
To investigate the effects of lexical complexity on the difficulty of L2 listening texts, we explored four subconstructs associated with this domain: lexical frequency, lexical density, lexical diversity, and concreteness of content words.
Lexical frequency.
The relationship between frequency of lexis and the difficulty of L2 listening texts has been the subject of several studies. Given that the ability to recognize words is essential for successful listening comprehension (e.g., Goh, Reference Goh2000) and that L2 listeners are more likely to recognize high- rather than low-frequency lexical items (e.g., Muljani, Koda, & Moates, Reference Muljani, Koda and Moates1998), it is logical to assume that listening texts with a less frequent lexis will pose a greater processing challenge. Previous research on lexical frequency and L2 listening comprehension, however, appears to have yielded mixed results. Nissan, DeVincenzi, and Tang (Reference Nissan, DeVincenzi and Tang1996), in examining TOEFL dialogue items, found that test takers had greater difficulty comprehending listening texts that contained an infrequent word (i.e., a word not included in Berger’s list of 100,000 common words) than they did comprehending texts that contained frequent words. Kostin (Reference Kostin2004) reported no effects for the same measure, but her results showed that dialogues tended to be more difficult when comprehension of the infrequent word was required to respond correctly. In contrast to Nissan and colleagues’ and Kostin’s respective work, Yanagawa and Green (Reference West2008) and Ying-hui (Reference Yanagawa and Green2006) revealed no link between the presence of infrequent words and listening test difficulty. However, as Yanagawa and Green suggested, their result might have been an artifact of using the JACET 2000 word list (i.e., a list generated on the basis of Japanese learner English) for determining frequency, due to the fact that some words on the list may have been less familiar to the test takers than words outside the 2,000 frequency level. Besides issues related to selecting appropriate word lists, a limitation of previous research is that the presence of an infrequent lexis has generally been treated as a dichotomous rather than a continuous variable. That is, existing studies on listening text difficulty have failed to account for any differences that may exist in the proportions and nature of infrequent words across listening texts.
In addition to word frequency, the difficulty of L2 listening texts is likely to depend on the amount and corpus-based frequency of formulaic language in the spoken input. Formulaic sequences (i.e., multiword units with a meaning distinct from their individual parts) make up a substantial part of any discourse, and their presence—along with corpus frequency—has been shown to facilitate L1 processing (e.g., Conklin & Schmitt, Reference Conklin and Schmitt2008). It is conceivable, therefore, that there may also be a link between L2 listening comprehension and the amount of formulaic language in the input. Kostin (Reference Kostin2004) provided evidence that L2 listening difficulty increased when texts contained an idiom, the understanding of which is essential for responding correctly. However, this text characteristic did not emerge as a significant predictor of task difficulty in Ying-hui (Reference Yanagawa and Green2006). It is worth noting that neither of these studies considered the corpus-based frequency or the proportion of formulaic sequences contained in the listening passages.
Lexical density.
Lexical density can be defined as the proportion of content words to the total number of words in a passage. Lexical density is generally regarded as a measure of information density; that is, texts including a high proportion of content words are expected to carry more information than texts including a high proportion of function words. It has been argued that greater information density exerts a higher processing load on L2 listeners (Bloomfield et al., Reference Bloomfield, Wayland, Rhoades, Blodgett, Linck and Ross2011). Although little research has looked at lexical density in relation to L2 listening, Buck and Tatsuoka (Reference Buck and Tatsuoka1998) provided some empirical support for this hypothesis. They found a positive association between task difficulty and the proportion of content words surrounding task-relevant information.
Lexical diversity.
Lexical diversity refers to the range and variety of words in a text, with higher diversity being associated with more varied use of vocabulary. Texts that contain a wider variety of words are presumably more difficult to process because they require the decoding of a larger number of unique words in the same amount of time. In line with this, Rupp, Garcia, and Jamieson (Reference Rubin2001) identified lexical diversity as a significant predictor of L2 listening difficulty, employing a type-token ratio (i.e., the number of unique words in a text divided by the total number of words). Note, however, that the validity of the type-token ratio as a measure of diversity has recently been questioned (e.g., Malvern, Richards, Chipere, & Durán, Reference Malvern, Richards, Chipere and Durán2004). On the basis of a careful validation study, McCarthy and Jarvis (Reference McCarthy and Jarvis2010) recommend using a combination of indices, including the measure of textual lexical diversity and the D-formula (Malvern & Richards, Reference Malvern, Richards, Ryan and Wray1997), to adequately capture this construct. So far, few studies of listening texts seem to have employed measures other than type-token ratios.
Concreteness of content words.
Concreteness of content words refers to the extent to which words in a text are concrete (i.e., they refer to specific objects or events) or abstract (i.e., they refer to more general concepts or ideas). There is a large body of psycholinguistic evidence indicating that the processing of concrete words affords many cognitive advantages over that of abstract words. In general, concrete words are associated with faster and more complete encoding and retrieval than abstract words (e.g., Paivio, Walsh, & Bons, Reference Paivio, Walsh and Bons1994). Freedle and Kostin (Reference Freedle and Kostin1999) yielded similar findings in one of the few studies that have considered this variable in relation to listening. They found that TOEFL minitalks that were judged to be more abstract by human raters tended to be more difficult for test takers.
Syntactic Complexity.
Given the role attributed to syntactic processing in the decoding process (Rost, Reference Rost and Hinkel2011), it is reasonable to assume that texts with greater syntactic complexity are associated with increased listening difficulty. As such, this potential link between the effects of structural complexity and the incidence of negatives on listening comprehension was examined.
Structural complexity.
Structural complexity as a multidimensional construct includes at least three subcomponents: complexity by subordination, phrasal complexity, and overall complexity (Norris & Ortega, Reference Norris and Ortega2009). As far as subordination indices are concerned, the results so far are mixed. Although Cervantes and Gainer (Reference Cervantes and Gainer1992) discovered a positive link between lower-degree subordination and comprehension of short lectures in two experimental studies, Blau’s (Reference Blau1990) experiment revealed no effects for manipulating the extent of subordination in short listening passages. Neither Kostin (Reference Kostin2004) nor Ying-hui (Reference Yanagawa and Green2006) detected a significant difference in difficulty between passages with more versus fewer subordinate clauses. Both Kostin and Ying-hui also examined whether a metric of overall complexity (i.e., length of longest T-unit, where T-unit refers to an independent clause with its subordinate clauses) might predict listening performances. Neither of the studies yielded a significant link between comprehension and length of longest T-unit. To date, little research, if any, included an index of phrasal complexity. In sum, although the overall findings of existing research suggest that decreased structural complexity is not likely to facilitate listening comprehension, further research is needed, and studies incorporating measures of phrasal and overall complexity to capture the construct more fully warrant special attention.
Incidence of negative expressions.
The number of negative expressions in listening tasks has also been investigated as a factor affecting the difficulty of L2 listening comprehension. In studies of both L1 and L2 sentence processing, the presence of negation has been shown to have adverse effects on comprehension (e.g., Carpenter & Just, Reference Carpenter and Just1975). These findings have been taken to suggest that negative constructions may result in reduced access to the mental representations of negated information (e.g., Tettamanti et al., Reference Taguchi2008). Some evidence for the role of negation has also been obtained in the context of L2 listening research. Three TOEFL studies made the same observation that task difficulty was increased when listening texts contained more negatives (Freedle & Kostin, Reference Freedle and Kostin1999; Kostin, Reference Kostin2004; Nissan et al., Reference Nissan, DeVincenzi and Tang1996). However, limited or no effects were found for the presence of negative constructions in two more recent studies of listening test passages (Yanagawa & Green, Reference West2008; Ying-hui, Reference Yanagawa and Green2006). Clearly, more research is warranted in this area.
Discourse Complexity.
Among the various discourse-level features, our research examined whether cohesion was a good predictor of L2 listening comprehension difficulty. Cohesion can be defined as the explicit characteristics of the text that assist in connecting ideas within the text (Graesser, McNamara, & Louwerse, Reference Graesser, McNamara, Louwerse, Sweet and Snow2003). It is expected that listening passages with stronger cohesion enable the listener to comprehend the meaning of a passage with greater ease. To date, only a few studies have investigated L2 listening difficulty as a function of cohesion, and they have yielded contradictory findings. Ying-hui (Reference Yanagawa and Green2006) obtained expert judgments regarding the extent to which the elements of the opening sentence were represented in the remainder of a passage. As predicted, easier listening items received higher cohesion ratings. Nissan and colleagues (1996), however, found no effects for cohesion in exploring the relationship between item difficulty and whether minidialogues contained explicit lexical links (e.g., repetition) or structural links (e.g., anaphora) between the speakers’ utterances. Given the small number of studies exploring the impact of cohesion on listening comprehension, more research is warranted in this area, preferably employing more refined analytical tools to characterize cohesion than the ones used in existing studies.
Explicitness
Explicitness is another characteristic that is expected to determine listening difficulty. Comprehending passages that include more implied meaning is likely to be more taxing for L2 listeners, as more implicit texts exert a greater load on semantic and pragmatic processes like inferencing and evaluation of the speaker’s meaning against expectations (Rost, Reference Rost and Hinkel2011). There is a small amount of empirical research that supports this prediction. Garcia (Reference Garcia2004) reported superior comprehension of conversational implicatures (i.e., understanding the unstated, intended meaning of a speaker) among higher as opposed to lower proficiency learners. Taguchi’s (Reference Sommers and Barcroft2005) experimental study also revealed that more proficient Japanese learners of English were more accurate—but not faster—in interpreting conversational implicatures. Similarly, several nonexperimental studies (Kostin, Reference Kostin2004; Nissan et al., Reference Nissan, DeVincenzi and Tang1996; Ying-hui, Reference Yanagawa and Green2006) found that texts that required listeners to make more inferences were associated with greater difficulty. In sum, albeit small in number, existing studies suggest that L2 listening comprehension is facilitated when ideas are explicitly presented in a passage.
RESEARCH QUESTIONS
This study was guided by four research questions:
1. Do the characteristics of the listening text predict task difficulty?
2. Is task difficulty affected by the relationship between the listening text characteristics and the expected task outcome?
3. Is there a relationship between learner perceptions of text and task difficulty, as measured by perception questionnaires, and actual task difficulty?
4. What aspects of the listening text do the learners find difficult while processing the text, as reflected in stimulated recall comments?
In the present study, task difficulty was estimated on the basis of learner responses to different versions of an ESL listening task. Listening text characteristics were operationalized as the speech rate, linguistic complexity (i.e., phonological, syntactic, lexical, and discourse complexity), and explicitness of each listening text. The relationship between text characteristics and expected task outcome was operationalized as the lexical complexity of those parts of the text that were necessary for task completion. Learner perceptions of text and task difficulty were tapped by means of a questionnaire and stimulated recall methodology.
METHODOLOGY
Design
Altogether, 77 ESL students participated in the study. Of these, 68 performed 18 versions of the same L2 listening task. The students were randomly assigned to four groups and were presented with the listening passages in a split-block design to avoid sequence effects. Immediately after completing a version of the task, all four groups were asked to complete a brief perception questionnaire. Nine native speakers (NSs) also completed the listening tasks and the questionnaire; these served as baseline data. The remaining nine ESL students carried out only six to nine versions of the task and were asked, through a process of stimulated recall, to describe their thought processes during task performance.
Participants
All 77 participants were students from an English for academic purposes (EAP) summer program at a UK university. For 78% of the ESL participants, IELTS scores were available. The majority (85%) of these students had overall scores in bands 6.0–7.0 (M = 6.4, SD = 0.49). Similarly, most (67%) of the participants’ listening IELTS scores were in the 6.0–7.0 band range, but the mean for listening was slightly higher (M = 6.7, SD = 0.73). The large majority of the students were Chinese (77%), and a smaller percentage of students had other language backgrounds (French: 4%, Indonesian: 1%, Japanese: 4%, Spanish: 3%, Thai: 9%, Tibetan: 1%, and Vietnamese: 1%). The students’ ages ranged from 17 to 35 (M = 22.49, SD = 3.46). There were 58 female and 19 male students all together. One-way ANOVAs run on the variables IELTS overall score, IELTS listening score, and age confirmed that there were no significant differences among the five groups (i.e., four main study groups and one stimulated recall group) with regard to these variables; F(4, 55) = 0.290, p = .883; F(4, 55) = 0.613, p = .655; and F(4, 72) = 0.788, p = .537, respectively. The stimulated recall participants were selected randomly and showed similar profiles to the main study participants in terms of sex (female, n = 7; male, n = 2) and L1 (Chinese, n = 7; French, n = 1; Spanish, n = 1). The nine NSs all worked as teachers or coordinators at the EAP summer program.
Instruments and Procedures
Listening Task.
The listening task was adopted from Trinity College London’s Graded Examinations in Spoken English. According to the test specifications, the task was designed for Level C1 in the Common European Framework of Reference. The 18 versions of the task used in the current study were intended for inclusion in an item bank. Each listening passage comprised a brief narrative of approximately 50 words, and the expected task outcome was a word or a phrase of up to five words, as in the following example (note that this publicly released task was not part of the current study):
Passage:Maria couldn’t understand why her laptop computer wasn’t working. At first she thought she might have forgotten to switch it off the night before. Then she wondered if her little brother might have been playing with it. But then she happened to look down at the electric socket and realised that…
Possible response: …it wasn’t plugged in.
Half of the task versions asked participants to write their responses not only in the target language but also in their L1. In this way, a potential confounding effect of the response format of the original test was controlled for, given the possibility that learners could comprehend the text but had problems with providing an adequate response in the L2. The listening passages were recorded by the same male NS of standard British English, and the four versions of the tape were prepared by using audio editing software. Each passage lasted about 21 s (Min = 18.65 s, Max = 25 s). Learners were given 30 s to provide a response in the target language, and an additional 30 s were allowed when a response was also required in their L1.
Perception Questionnaire.
The perception questionnaire included eight statements that participants needed to judge on a 5-point Likert scale. These assessed participants’ perceptions of (a) overall task difficulty, (b) their ability to perform the task, (c) the linguistic complexity of the listening passage, (d) the speed of the passage, and (e) the explicitness of ideas. The questionnaire was administered to the participants in English, but care was taken to word the items in simple language (e.g., “The passage was fast”). The questionnaire was purposely kept short to minimize the disruption between performances of the different task versions. Participants had 1 min to complete the questionnaire.Footnote 1
Stimulated Recall Procedure.
The stimulated recall procedure was aimed at eliciting learners’ initial perceptions about the listening texts. The stimulated recall protocol included three stages. First, students listened to a version of the task and were asked to provide a written response in the target language. Next, they listened to the same passage again. During this second listening, they could pause the tape at any time they wished to describe their thoughts at any particular point during the original listening. The data collected from this stage are not discussed here. Finally, they listened to the same passage for a third time. In this last step, each passage was broken down into two shorter subsections. After each subsection, participants were asked to respond to a few predetermined questions. Out of these questions, only one is relevant to and discussed in the present article: “Were there any things which made understanding the passage difficult?” First, participants were familiarized with this three-step procedure through an example passage. Next, the procedure was repeated for six to nine passages for each participant, depending on how many passages could be fit into the 90 min available for the stimulated recall sessions. The order of the passages was the same for each learner. The sessions were conducted in English by a trained research assistant. Participants did not appear to experience difficulty in verbalizing their thoughts in English.
Data Collection
Except in the case of the stimulated recall participants—who took part in individual sessions—the 18 listening tasks were administered to participants during the same time slot. Each group was allocated to a different room. The recorded passages were played through computers installed in the seminar rooms. Each room was equipped with ceiling- and surface-mounted speakers.
Data Analysis
Scoring of Listening Responses.
All learner responses were blind double-marked by one of the researchers and an experienced rater, using an answer key developed and validated by the exam board. Participants were allocated 2 points for responses that matched exactly or very closely the answer provided in the key. One point was awarded for responses that lacked the appropriate focus but approximated the meaning of the answer in the key. Participants received 0 points if their answers did not approximate the answer in the key. Spelling mistakes were not taken into account, and grammatical errors were disregarded unless they interfered with the comprehensibility of the response. Interrater reliability between the researcher and rater was high (r = .91, p < .01).
Analysis of Listening Texts.
The 18 listening passages were analyzed in terms of speed, linguistic complexity (i.e., phonological, lexical, syntactic, and discourse complexity), and explicitness of the text.
Speed.
As measures of speed, articulation rate, speech rate, and number of silent pauses per second were obtained for each of the 18 passages using the computer software Praat v5.0.25 (Boersma & Weenink, Reference Boersma and Weenink2008). Articulation rate was expressed as number of syllables per second excluding pause time, whereas speech rate was operationalized as number of syllables per second including pauses. Pauses were defined as silent periods exceeding .25 s.
Phonological complexity.
To assess the phonological complexity of the 18 listening texts, indices were computed for phonotactic probability, frequency of elisions, rhythm, and pitch. Phonotactic probability was gauged for each transcribed passage in terms of mean positional segment frequency and mean biphone frequency using the web-based interface of the Phonotactic Probability Calculator (Vitevitch & Luce, Reference Vandergrift, Goh, Doughty and Long2004). Mean positional segment frequency was calculated by dividing the sum of all positional segment frequency values in a passage by the total number of segments in the passage. Similarly, mean biphone frequency was obtained by determining all biphone frequency values for a passage and then averaging these values. Frequency of elisions was expressed as the number of elisions per word, where elisions were identified on the basis of phonetic transcriptions of the listening texts. Praat v5.0.25 (Boersma & Weenink, Reference Boersma and Weenink2008) was employed to compute the indices for rhythm and pitch. Rhythm was assessed in terms of the vocalic PVI, which measures the extent to which one vocalic interval is different from its neighbor in duration. As a measure of pitch, F0—that is, vocal cord vibrations per second—was calculated.
Lexical complexity.
The lexical complexity of the passages was gauged using measures of lexical frequency, lexical density, lexical diversity, and concreteness of content words. The frequency of words in the listening texts was assessed with the help of Web VocabProfiler v3 (Cobb, n.d.). Utilizing A General Service List of English Words by West (Reference Vitevitch and Luce1953), this program identified the percentage of words, function words, and content words belonging to the 1,000 most frequent English word families (K1 words, K1 function words, and K1 content words), the percentage of words among the 1,000–2,000 most frequently used word families (K2 words), and the percentage of words included in the 2,000 frequency band (K1 + K2 words). The program also identified the percentage of words contained in “The new academic word list” by Coxhead (Reference Coxhead2000), and the percentage of words that were not found in any of the lists.
Besides word frequency, the proportion of words that were part of formulaic expressions in the passages was determined. In particular, formulaic sequences in the 1,000, 2,000, 3,000, 4,000, and 5,000 lexical frequency bands (K1–K5) were identified using Martinez and Schmitt’s (Reference Martinez and Schmitt2012) list of the 505 most frequent nontransparent formulaic expressions based on the British National Corpus. However, only the index for overall incidence of formulas was included in further analyses, due to the very small number of formulaic expressions found for the individual lexical frequency bands. Frequency of formulas was expressed as the ratio of the number of words contained in formulaic expressions to the total number of words in a passage.
Lexical density was assessed using the program Web VocabProfiler v3 (Cobb, n.d.). The program computed the proportion of content words to the total number of words in the passages. Lexical diversity was measured by Malvern and Richards’s (Reference Malvern, Richards, Ryan and Wray1997) D-formula. The estimation of D is performed on the basis of a probabilistic mathematical model that utilizes a series of randomly sampled tokens to create a type-token ratio curve against increasing token size for the text under investigation. D-values were computed for each passage, employing the computer program vocd of the CHILDES system (MacWhinney, Reference MacWhinney2000). Although some researchers recommend using a D-value in combination with other lexical diversity indices such as the measure of textual lexical diversity (MTLD; McCarthy & Jarvis, Reference McCarthy and Jarvis2010), MTLD values could not be calculated for the listening passages here because the tool used to produce this index requires a minimum of 100 tokens to operate. The vocd program, on the other hand, can be used for texts as short as 50 tokens.
The Coh-Metrix 2.0 (McNamara, Louwerse, Cai, & Graesser, Reference McNamara, Louwerse, Cai and Graesser2005) program was employed to analyze the concreteness of content words in the passages. Coh-Metrix determines concreteness values using the MRC Psycholinguistics Database (Coltheart, Reference Coltheart1981), which contains a large collection of concreteness ratings obtained from psycholinguistic experiments. Coh-Metrix generates concreteness values between 100 and 700, where high values are associated with a high frequency of concrete words and low values with a high frequency of abstract words in a text.
These lexical complexity indices were calculated not only for the overall text but also for those parts of the texts that were considered necessary for providing a correct response. The only exception is lexical diversity, for which no index was computed, given that the necessary information in the texts comprised a very low number of tokens and varied considerably in token size across the passages (M = 13.72, SD = 6.07). Thus, any values obtained would not have been meaningful. It is also important to note that no academic words were identified in the necessary information. Hence, the results for this variable are not reported here and were not considered in further analyses. The necessary information in the texts was identified based on the judgments of three experts. Each expert had a strong background in researching L2 receptive skills. For all 18 passages, the information considered necessary by all three experts was used in further analyses.
Syntactic complexity.
The syntactic complexity of the listening texts was assessed in terms of four types of indices: complexity by subordination, phrasal complexity, overall complexity (Norris & Ortega, Reference Norris and Ortega2009), and incidence of negative expressions. Complexity by subordination was operationalized as the proportion of clauses in relation to analysis of speech units (AS-units; Foster, Tonkyn, & Wigglesworth, 2000). To measure phrasal complexity, the number of words was divided by the total number of clauses for each passage. As an additional measure of phrasal complexity, the mean number of modifiers per noun phrase was calculated by the Coh-Metrix 2.0 program (McNamara et al., Reference McNamara, Louwerse, Cai and Graesser2005). Overall complexity was expressed as the ratio of words to AS-units. Coh-Metrix was also utilized to obtain an incidence score for negation, which reflected the number of negative expressions appearing in the texts. The texts were double-coded for clauses and AS-units by one of the researchers, and intrarater reliability was high for both units, r = 0.97, p < .001; r = 1.00, p < .001, respectively.
Discourse complexity.
To gauge the discourse complexity of the 18 listening texts, a number of cohesion indices were obtained using the Coh-Metrix 2.0 program (McNamara et al., Reference McNamara, Louwerse, Cai and Graesser2005). In particular, the passages were analyzed in terms of various types of connectives and measures of causal, intentional, temporal, and spatial cohesion. Connectives facilitate cohesion by offering cues about the types of relationships between ideas in a text (Halliday & Hasan, Reference Halliday and Hasan1976). Connectives can be classified as positive when they extend the ideas described in the text and as negative if they do not elaborate and expand on the information (Louwerse, Reference Louwerse2002; Sanders, Spooren, & Noordman, Reference Samuda and Bygate1992). Connectives can also be distinguished by the type of cohesion they create: additive, causal, logical, or temporal (Halliday & Hasan, Reference Halliday and Hasan1976). Using these categories, we employed Coh-Metrix to generate an incidence score for all connectives; positive and negative additives (e.g., also, moreover, but); and temporal (e.g., when, after, until), causal (e.g., because, so, although), and logical (e.g., if, or, unless) connectives. We obtained a value of 0 for negative temporal and causal connectives for almost all passages; thus, these indices were not considered in further analyses and are not reported.
The cohesion of a text can also be assessed in terms of its situational dimensions—in other words, aspects of the text that facilitate the construction of a situation model or the referential content of the text. According to Zwaan and Radvansky (Reference Zhao1998), there are five situational dimensions of cohesion: causation, intentionality, time, space, and protagonist. These dimensions can be signaled by connectives, particles, nouns, and verbs. Using the Coh-Metrix 2.0 program (McNamara et al., Reference McNamara, Louwerse, Cai and Graesser2005), we calculated indices for causal content and cohesion, intentional content and cohesion, temporal cohesion, and spatial cohesion.
Causal content and cohesion capture the extent to which causal relations are explicitly indicated in a text. Causal content refers to the frequency of causal verbs and particles, whereas causal cohesion expresses the ratio of causal particles to causal verbs. Intentional content and cohesion is a measure of the degree of intentional links, which is especially relevant for narratives because they include animate agents performing actions to achieve goals. Intentional content indicates how frequently intentional actions, events, and particles appear in a text and is computed as the proportion of intentional particles to intentional content. Given that Coh-Metrix yielded an intentional cohesion value of 0 for each passage, this index was not further considered in the study.
Temporal cohesion determines the extent to which different verb tenses and aspects contribute to text cohesion and is calculated by averaging the repetition score for tense and aspect. Spatial cohesion is an index of explicit spatial links that can be conveyed by the use of spatial particles, location nouns, and motion verbs. It is expressed as the mean of location and motion ratio scores, which are based on incidence scores for location and motion prepositions, location nouns, and motion verbs.
Explicitness.
The explicitness of the texts was determined on the basis of two NSs’ judgments on a 5-point Likert scale. The NSs listened to each passage and—immediately after listening—had 20 s to evaluate how explicitly the ideas were expressed in the text. They agreed on 10 of the passages, differed in one degree of explicitness on five passages, and in more than one degree on three passages. For each passage, the mean of the two raters’ judgments was used in further analyses.
Analysis of Stimulated Recall Data.
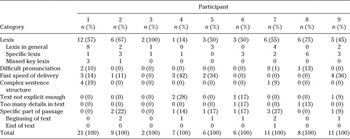
The analysis of the stimulated recall protocols involved four phases. First, one of the researchers reviewed the learners’ comments on factors that affected ease of passage comprehension and identified emergent factor categories by annotating the data. Second, the resulting annotations were grouped into more general categories (see Table 3). Third, the researcher double-checked all of the annotations and categories that emerged from the content analysis. Finally, the comments falling into a specific category were added up to form a frequency count for each participant. The same four steps were repeated a month later to check the consistency of coding. The Cohen’s kappa value demonstrated a high level of intracoder agreement (κ = .92).
Statistical Analyses.
To examine the difficulty of the 18 listening passages in relation to the participants’ ability, the simple Rasch (Reference Pollitt and Hutchinson1960) model was used. This procedure transformed the raw data into their natural logarithm or log-odds (logits) and produced measures for the two facets—participant ability and passage difficulty—on a true interval scale, known as the logit scale. Because the computer program FACETS 3.68 (Linacre, Reference Linacre2011) indicated that the original 3-point rating scale used for the listening responses did not function properly, it was recoded into a dichotomous scale by collapsing the partial scores 0 and 1 into one category. The interrater reliability for the reduced scale was high, r = .87, p < .01.
To address the first three research questions, a series of simple regression analyses were conducted, using SPSS 18. Standard diagnostic procedures were used to ensure the appropriateness of the models. An alpha level of p < .05 was set for all tests. Cohen’s f 2 values were used to measure the effect sizes of the independent variables.
RESULTS
Native Baseline Data
The native baseline data, collected from nine English NSs, suggested that the 18 task versions operated in a satisfactory manner. Seven NSs achieved perfect scores, and two NSs responded to one task version incorrectly (M = 35.78, SD = 0.65).
First Language Responses
For half of the task versions, participants provided their responses both in their L2 and in their L1. A comparison of the L2 and L1 answers revealed that in 99.2% of the cases the two responses were the same. Thus, providing the response in the L2 did not seem to pose difficulty for the participants.
Participant Ability and Task Difficulty: Results from Rasch Analysis
The results of the Rasch analysis, which was used to obtain estimates for participant ability and task difficulty, showed that there was considerable variation in participant abilities and task difficulty. The mean ability estimate for the participants was .07 and ranged from −4.09 to 4.51 logits (SD = 1.42). The overall difference between participants’ abilities was significant, χ2(67) = 211.4, p < .01. The separation reliability, analogous to Cronbach’s alpha, for the ability estimates was .77. The value of .77 indicates acceptable reliability. In short, these statistics suggest that the participants’ abilities were spread out on the logit scale with acceptable consistency. As per the infit statistics, which isolate irregular response behavior (e.g., correctly answering a greater number of difficult than easy items on a test), the infit mean-square mean was 1.00 for the facet, with a standard deviation of .26. Hence, following Pollitt and Hutchinson’s (Reference Zwaan and Radvansky1987) criterion (i.e., mean ± two standard deviations), only four participants were identified as slightly misfitting.
Moving on to the results for the difficulty of the listening passages, the mean difficulty was −.56 logits, indicating that, on average, the passages were relatively easy for the participants. The analysis yielded a standard deviation of 1.46 logits, and the difficulty estimates ranged from −2.66 to 2.63 logits. The overall difference between the task difficulty estimates was significant, χ2(17) = 264.6, p < .01, with a separation reliability of .95. These indices demonstrate that the 18 passages reliably differed from one another. The infit mean square values for the facet were all in the acceptable range of .68–1.32 (i.e., mean ± two standard deviations), except for one passage that had a slightly misfitting value of 1.39.
Listening Text Characteristics
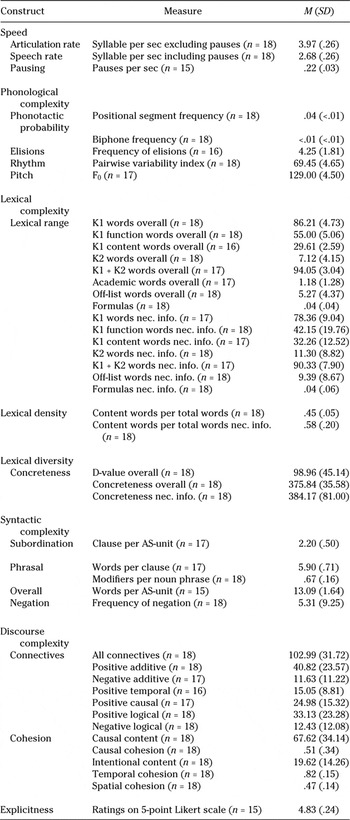
In examining the text characteristics of the 18 listening passages, first the data for all measures of speed, linguistic complexity, and explicitness were inspected for outliers. Outliers were identified using boxplots and were defined as values below the 25th percentile or above the 75th percentile by at least 1.5 times the interquartile range. Table 1 provides the descriptive statistics for the text characteristics of the passages after outliers were removed.
Summary of listening text measures

Listening Text Characteristics and Task Difficulty
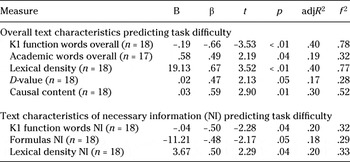
The first research question asked whether the characteristics of the listening passages predicted task difficulty—that is, the extent to which learners were able to successfully complete the task. We investigated this question by performing a series of simple regression analyses. The task difficulty estimates from the Rasch analysis were set as the dependent variable in each analysis, with one of the listening text characteristics serving as the independent variable. The regression analyses identified five text characteristics as significant predictors of task difficulty—namely, incidence of K1 function words, incidence of academic words, lexical diversity, lexical density, and causal content. As shown in Table 2, the proportion of K1 function words and lexical density had a strong effect on task difficulty, accounting for 40% of the variability as individual factors (K1 function words: adjR 2 = .40, p < .01, f 2 = .78; lexical density: adjR 2 = .40, p < .01, f 2 = .77). Passages with larger proportions of K1 function words (e.g., and, with, have, he, she) were significantly less demanding for the participants than those with smaller proportions of K1 function words. In contrast, greater task difficulty was experienced when lexical density was higher—that is, when passages contained a higher proportion of content words to the total number of words. Causal content also proved a strong predictor of task difficulty. As an individual factor, it explained 30% of the variability, adjR 2 = .30, p = .01, f 2 = .52. Passages that contained more causal verbs and particles (e.g., cause, enable, so that, hence) posed significantly more difficulty than passages with less causal content. The regression analyses yielded moderate effects for the incidence of academic words (e.g., analyze, distinct, outcome) and lexical diversity, both variables predicting approximately 20% of the variability as individual factors (i.e., academic words overall: adjR 2 = .19, p = .04, f 2 = .32; D-value: adjR 2 = .17, p = .05, f 2= .28). The more academic words and the more varied lexis that occurred in a text, the more challenging the task was likely to be. Importantly, no significant effects were detected for the remaining listening text characteristics examined.
Summary of simple regression analyses

Listening Text Characteristics, Expected Task Outcome, and Task Difficulty
The second research question asked whether task difficulty was affected by the relationship between the listening text characteristics and the expected task outcome. Therefore, we examined whether the difficulty of the task versions was influenced by the lexical complexity of those parts of the listening text that the listener needed to understand to provide a correct answer. In a series of simple regression analyses, the lexical characteristics of the necessary information in the texts (one in each analysis) were regressed on the task difficulty estimates obtained from the Rasch analysis. The regression analyses found that task difficulty was significantly predicted by the frequency of K1 function words, frequency of formulaic expressions, and lexical density (see Table 2). All three variables had a moderate effect on task difficulty, explaining approximately 20% of the variability as an individual factor (i.e., K1 function words necessary information: adjR 2 = .20, p = .04, f 2 = .32; formulas necessary information: adjR 2 = .18, p = .05, f 2 = .29; lexical density necessary information: adjR 2 = .20, p = .04, f 2 = .33). Passages appeared significantly less demanding for learners when the necessary information contained a greater number of K1 function words (e.g., and, with, have, he, she) or formulaic expressions (e.g., go ahead, in the first place). On the other hand, task difficulty was greater if a passage had higher lexical density. Our analyses yielded no significant effects for the rest of the necessary information characteristics.
Task Difficulty and Perceptions of Text and Task Difficulty
The third research question addressed the question of whether learners’ perceptions of text and task difficulty related to the actual difficulty of the task versions. This was investigated by means of correlations between the mean value of learners’ judgments on one of the eight items of the perception questionnaire and task difficulty as measured by the Rasch task difficulty estimates. It was found that, overall, actual task difficulty correlated strongly with learner perceptions of task and text difficulty. More specifically, there was a very strong correlation between actual task difficulty and learner perceptions of overall task difficulty, r = −.90, p < .01, n = 18; the quality of learners’ performance on the task versions, r = −.90, p < .01, n = 18; and how explicitly ideas were expressed in the texts, r = −.88, p < .01, n = 18. More difficult tasks were perceived as such, and the learners judged their own performance to be less successful on these tasks. Additionally, more difficult tasks were likely to be perceived as less explicit. Task difficulty also correlated slightly less—but still very strongly—with the extent to which learners perceived the pronunciation and organization of the passages as clear, r = −.79, p < .01, n = 18; r = −.82, p < .01, n = 18, respectively, and the words and grammar in the texts as difficult, r = −.77, p < .001, n = 18; r = −.79, p < .01, n = 18, respectively. Finally, more difficult tasks were perceived as being delivered at a higher speed. Although this association was also strong, it was weaker than the rest of the correlations, r = .70, p < .01, n = 18.
Stimulated Recall Comments: Sources of Difficulty in Listening Text Comprehension
The fourth research question asked which aspects of the listening text the learners found difficult while they were processing the texts. As summarized in Table 3, seven major categories emerged from the stimulated recall comments. All nine participants reported lexis as a source of difficulty. It is also worth noting that, except for one learner, this category was the most frequently mentioned by the participants. A subset of the learners identified specific lexical items as resulting in comprehension problems or reported processing difficulty because of not comprehending what they perceived to be the key lexis. Six out of the nine students referred to particular sections of the passages—either the beginning or the end—when describing sources of listening difficulty. Five students felt that fast speed of delivery posed a challenge, and three students reported encountering problems due to lack of clarity of pronunciation or lack of explicitness. Two students also thought that structural complexity made understanding the texts demanding, and, interestingly, two students perceived too much unnecessary detail in the text as causing difficulty.
Summary of stimulated recall comments: Sources of difficulty in text comprehension

Note
N = the raw number of comments provided by participant, % = the number of comments per total number of comments made by a participant.
DISCUSSION
In the first research question, we asked whether the characteristics of the listening text predicted task difficulty—that is, the extent to which participants succeeded in completing a L2 listening task. In particular, we investigated the relationship of task difficulty to the speed, the linguistic complexity, and the explicitness of listening texts. As regards the speed of delivery, contrary to the patterns observed in previous research, our study yielded no effects for any of the speed indices, including speech rate, articulation rate, and frequency of pausing. One possible explanation for this finding is that the variation detected in speed was at a level too slow to make a difference. The mean speech rate for the 18 listening texts was 2.68 syllables per second (SD = .26, Min = 2.26, Max = 3.04). Any differences in this range were probably below the threshold that would have caused considerable processing difficulty for the participants here, given that the majority had overall IELTS scores and IELTS listening scores in the 6.0–7.0 band range, which suggests an advanced level of general and listening proficiency. This reasoning is in line with the results of Griffiths (Reference Griffiths1990), who found no significant effects for a difference of 1.93–2.85 syllables per second, even when investigating the impact of speech rate on the listening comprehension of low-intermediate rather than advanced learners. It is also worth noting that although speed of delivery did not appear to be a significant predictor of task difficulty as an individual factor, it might have influenced listening difficulty in combination with other text characteristics, as was also found in Buck and Tatsuoka (Reference Buck and Tatsuoka1998). However, due to the relatively small sample of listening passages available for the present study, we were not able to examine any interactions between the text characteristics in focus.
Our results regarding the effects of linguistic complexity on task difficulty are mixed. Although none of the phonological and syntactic complexity measures proved significant predictors of successful task performance, several of the lexical complexity indices along with a discourse measure explained a significant amount of variance in the difficulty of the listening passages. The lack of impact for the phonological factors (i.e., phonotactic probability, frequency of elisions, rhythm, and pitch) might have been due partly to the fact that the listening texts were recorded by the same NS, who spoke standard British English and read from scripted texts. If the narratives had been unscripted or delivered by various speakers who differed, for example, as to their accent, age, and sex, a higher variation in phonotactic features, frequency of elisions, rhythmic patterns, and pitch might have resulted, thereby causing greater differences in task difficulty. Although the distributions for the text variables were found to be normal in this study, the standard deviations for the phonological complexity variables were relatively low (see Table 1), which inevitably decreased the probability that any effects were detected. Clearly, future research is warranted in this area, as very few studies so far have investigated phonological features in relation to L2 listening comprehension.
The findings for lexical complexity, overall, are in accord with our expectation that greater lexical complexity would be associated with increased task demands. Four indicators of lexical complexity—proportion of K1 function words, frequency of academic words, lexical density, and lexical diversity—were identified as having moderate to strong effects on task difficulty. Lexical density and K1 function words accounted for approximately 40% of the variance as individual factors, whereas about 20% of the variability in listening comprehension was explained, separately, by incidence of academic words and lexical diversity. Passages appeared significantly less challenging for the participants if they contained more function or fewer academic words, were less dense in terms of information content, or included a more varied lexis. However, the difficulty of the passages was not significantly influenced by the rest of the lexical frequency measures (i.e., K1 words overall, K1 content words overall, K1 + K2 words overall, off-list words, formulaic expressions, and concreteness). It is not surprising that a higher frequency of academic words was associated with greater listening difficulty. Academic words typically constitute a lower-frequency lexis than K1 and K2 words; it is thus possible that some of the academic words in the texts were unknown to the learners or were not readily recognized by them. It is worth noting that Nissan and colleagues (1996) also observed that listening texts with less frequent lexical items posed greater processing challenges. In a similar vein, one reason why K1 function words might have predicted listening difficulty, whereas K1 words, K1 content words, and K1 + K2 words did not, might be that the K1 function words in the texts tended to have higher corpus-based frequency than did the K1 content words. Therefore, there was probably a stronger likelihood that participants automatically recognized K1 function words.
An alternative explanation for the significant results for K1 function words is possible if we consider the relationship of the index of K1 function words to the construct of lexical density in the current research. The more function words there are in a listening passage, the lower the proportion of content words in the same passage. In other words, texts with a high incidence of function words have lower lexical density (i.e., content words per total number of words). Lower lexical density, in turn, is associated with carrying a decreased amount of information content, which is expected to result in less processing effort needed to comprehend a listening text. Indeed, lexical density was found to be as strong a predictor of task difficulty as K1 function words in this study. It should be noted, however, that there is not necessarily an overlap between the constructs represented by these indicators because not all function words in a passage may rank among the 1,000 most frequently used English words. A simple correlational analysis, nevertheless, confirmed that the correspondence between the constructs tapped by K1 function words and lexical density was very high in the present study, r = −.998, p < .001, n = 18.
The fact that lexical diversity had a significant impact on task difficulty was also anticipated. Listening texts that contain a wider variety of lexis are likely to impose more demands on decoding processes because they require the recognition of a larger quantity of distinct words. These findings for lexical diversity are also consistent with those of Rupp and colleagues (2001), which revealed a significant link between lexical diversity, as measured by a type-token ratio, and the difficulty of L2 listening.
The lack of effects for concreteness, however, was contrary to our expectations. Concreteness of texts was found to be a significant predictor of task difficulty in Freedle and Kostin’s (Reference Freedle and Kostin1999) study on TOEFL minitalk items as well as in a number of studies investigating L1 text processing. The absence of an effect in the present study may be attributed to the fact that there was a relatively small variation in the number of abstract words the passages contained (M = 375.84, SD = 35.58). Additionally, the concreteness values were generally midrange on a scale from 0 to 700, which was probably below the level at which differences would substantially affect the processing difficulty experienced by advanced learners. Further studies are needed to explore this link.
As far as syntactic complexity is concerned, our findings, for the most part, reflect the patterns generated in previous studies. Task difficulty did not appear to be affected by any of the syntactic complexity measures we employed, neither the indices for overall, subordination, and phrasal complexity nor the index for the incidence of negative expressions. Even if our study was among the first to examine phrasal complexity in relation to listening task demands, the results for subordination and overall complexity corroborate the general findings of existing empirical research (Blau, Reference Blau1990; Kostin, Reference Kostin2004; Ying-hui, Reference Yanagawa and Green2006; see, however, Cervantes & Gainer, Reference Cervantes and Gainer1992) and suggest no significant link between structural complexity and L2 listening difficulty. The fact that this investigation yielded no effects for frequency of negative expressions substantiates the outcome of some (Yanagawa & Green, Reference West2008; Ying-hui, Reference Yanagawa and Green2006), but not all (Freedle & Kostin, Reference Freedle and Kostin1999; Kostin, Reference Kostin2004; Nissan et al., Reference Nissan, DeVincenzi and Tang1996), previous research. Additional studies are needed to disentangle during what types of listening tasks, at what proficiency levels, and in combination with what variables incidence of negatives contributes to variability in listening task difficulty.
Out of the 15 discourse complexity measures examined here, only causal content was found to have a significant impact on the extent of difficulty exerted by the task versions. Causal content accounted for 30% of the variance observed in task difficulty, with passages that contain a greater number of causal verbs and particles resulting in less successful task performance. A tentative explanation for why causal content—but not the rest of the cohesion indices—predicted task difficulty may be that discerning the causal relations in the texts was more relevant to task completion than the understanding of intentional, temporal, or spatial connections. That is, to provide a correct ending to the passages, it was probably more critical to be able to comprehend the events described in the narratives and how they were related, as compared to grasping the goals and beliefs of the protagonists or noticing any shifts in time and location in the stories. Although we need to be careful in comparing our results to those of previous research due to the different analytical tools employed, it is worth noting that our findings for cohesive devices, apart from those for causal content, are in harmony with the results of Nissan and colleagues (1996), who discovered no association between text cohesion and listening difficulty.
Contrary to expectations, the current study provided no evidence for an association between task difficulty and the explicitness of the listening texts. As mentioned previously, although only a few studies have examined the relationship between listening comprehension difficulty and how explicitly ideas are presented in a text, explicitness has generally been found to promote success in task completion. Arguably, the discrepancy between the results of this study and those reported in earlier work can be ascribed to a ceiling effect on the explicitness ratings obtained here. The large majority of the two NSs’ explicitness judgments were at or near the maximum possible rating of 5.00 (M = 4.84).
The second research question explored whether the difficulty of a L2 listening task depends on the relationship of text characteristics to the expected task outcome. The extent to which the lexical complexity of those parts of the text that were essential for task completion influenced task difficulty was therefore examined. The frequency of K1 function words, frequency of formulaic expressions, and lexical density emerged as significant predictors of listening task difficulty, each accounting for approximately 20% of the variance individually. The task versions were likely to pose less difficulty for the learners if the necessary information contained more K1 function words, more formulaic expressions, or had higher lexical density. The results for lexical density and K1 function words are consistent with the patterns observed for overall text characteristics. As was previously argued, a larger percentage of K1 function words and lower lexical density might have eased the demands on word recognition processes or have resulted in a decreased amount of information to deal with, which, in turn, would have probably facilitated a higher chance of successful task completion. It is important to add that, similar to what was found for the overall text, the two measures appeared to tap the same or closely related constructs, as indicated by the perfect correlation between the two indices, r = –1.00, p < .01, n = 18. As regards previous research on necessary information and lexical density, Buck and Tatsuoka (Reference Buck and Tatsuoka1998) also identified a positive correlation between task difficulty and the proportion of content words surrounding task-relevant information in their study.
Unlike lexical density and K1 function words, the presence of formulaic sequences only proved a significant predictor when applied to the necessary information in the passages. This confirms the insight derived from extant research that the textual characteristics of the necessary information may, at times, prove to be more sensitive predictors of task difficulty than overall text characteristics (e.g., Buck & Tatsuoka, Reference Buck and Tatsuoka1998; Kostin, Reference Kostin2004). The negative correlation detected between formulas and task difficulty is not surprising given the high proficiency level of our participants. It replicates the general pattern in L1 processing research that the presence of formulas alleviates processing load (e.g., Conklin & Schmitt, Reference Conklin and Schmitt2008). Note, however, that our findings for formulaic expressions run counter to those of Kostin (Reference Kostin2004), in which the presence of an idiom in the necessary information appeared to increase listening task demands. One reason for the disparity between our and Kostin’s results could be that the corpus-based frequency of the formulaic expressions in our study was lower (i.e., most formulas were in the K2 + K3 generic bands) than in Kostin’s work.
The third research question concerned the relationship between task difficulty and learner perceptions of task and text difficulty. To address this question, we investigated whether the actual difficulty of the tasks, as estimated by the Rasch analysis, correlated with learner responses on the short perception questionnaires that were administered immediately after each version of the task. As anticipated, a very strong relationship was found between task difficulty and both learner perceptions of overall task difficulty and the extent to which learners felt they completed the task successfully. Given that we found strong links between a number of lexical complexity measures and the task difficulty estimates, it was not unexpected that task difficulty correlated very strongly with how difficult participants perceived the words to be in the texts. However, our results for the rest of the perception questionnaire items are somewhat puzzling. Although more difficult tasks were associated with (a) perceptions of higher speed of delivery; (b) less explicit ideas; and (c) more difficult pronunciation, organization of ideas, and grammar, none of the corresponding characteristics of the actual text proved to be significantly related to task difficulty. This finding is especially striking for explicitness, which, in its perceived form, emerged as very strongly correlated with task difficulty but, as judged by NSs, was found to have no significant impact on actual task difficulty. This could be interpreted as suggesting that actual text difficulty and learner perceptions of such difficulty do not necessarily overlap. Alternatively, it could be argued that participants in the present study, perhaps due to processing constraints, were simply unable to make fine-grained decisions about sources of textual difficulty on the basis of a single listening of a relatively short text. Finally, we may consider that sources of perceived difficulty were not as well reflected in test scores because learners might have allocated more processing effort to those textual aspects that they experienced as demanding (e.g., vocabulary) during a particular task version, leaving fewer resources available for allocating attention to other aspects (e.g., organization of ideas).
Our last research question examined what aspects of the text the learners experienced as causing difficulty while they were processing the listening passages through qualitative analysis of the stimulated recall data. Interestingly, the students’ stimulated recall comments were more in harmony with the listening performance results than with the data obtained from the perception questionnaires. Lexical complexity surfaced as the most critical determinant of processing difficulty in the stimulated recalls, just as in the regression analyses, which were conducted to explore the links between the actual text characteristics and task difficulty estimates. It is worth noting, however, that like the perception questionnaire data but contrary to the results of the regressions, speed of delivery, lack of clear pronunciation, lack of explicitness, and structural complexity were reported to contribute to comprehension problems by the stimulated recall participants as well. However, it is also important to point out that these textual aspects were considerably less frequently mentioned than difficulty with lexis: a trend that is more congruent with the regression results. One reason for the discrepancy between the questionnaire and stimulated recall findings could be that during the stimulated recall sessions participants were exposed to shorter subsections of the passages, probably allowing them to provide more fine-tuned accounts of what factors they perceived as triggering processing difficulty. The nature of the instruments might have also affected learner responses in the sense that, although the questionnaires assessed perceptions in terms of predetermined categories, the stimulated recall comments were learner generated, not derived from researcher-imposed categories.
CONCLUSION
In this study we examined whether the difficulty of a L2 listening task is affected by the speed of delivery, linguistic complexity, and explicitness of the input text, and by the characteristics of the textual information necessary for task completion. Reflecting previous research findings, lexical complexity appeared to be a key predictor of task difficulty, and syntactic complexity did not have a significant impact on learner performance. Our findings, however, run counter to the trends observed in previous research in that no significant effects were identified for speed of delivery or explicitness. The differential effects could be attributed to a number of factors, including differences in task types; task conditions; the overall learning context; students’ background characteristics, such as proficiency level, age, and L1; and the analytical tools employed in different studies. Further research is needed to disentangle the possible interactions among these variables.
Our research was innovative in several aspects. First, besides investigating actual task difficulty in relation to listening text characteristics, we explored learner perceptions about this link, employing introspective methodology. In an interesting manner, the data obtained from stimulated recall protocols showed trends similar to those we observed for actual task difficulty, but perception questionnaires generated more divergent—albeit still partly overlapping—findings. Second, we examined a number of textual features that have not been the object of previous research, and, among them, we found significant effects for causal content, a discourse feature. Finally, several of our analytical tools were more refined than those utilized in existing research (e.g., the D-measure for lexical diversity, formulaic expressions in addition to single-word measures for lexical frequency, and speech rate measures accounting for pausing behavior), which inevitably increased the validity of our findings.
Even if the carefully selected textual measures clearly lend weight to our results, there are several limitations to this study that need to be acknowledged and addressed in future research. Our study was limited to one particular listening task type that was carried out by advanced-level ESL learners studying in an EAP program at a British university. The findings may not transfer to other task types, proficiency levels, L2s, types of programs, and institutional contexts. Another set of limitations has to do with the relatively low number of task versions to which we had access. For example, it was not feasible to conduct a multiple regression analysis due to the small sample of task versions, and, therefore, potential interactions between the listening text characteristics could not be considered. Additionally, although our simple regression analyses—with 18 task difficulty estimates—had the power to detect moderate to large effects, the impact of textual features with small effect sizes may have gone undetected. It could also be argued that some of our measures were originally developed to assess the complexity of written rather than spoken texts, and, thus, they might not have been applicable to the listening passages used in this study. This potential shortcoming was mitigated by the fact that the listening texts in the present study were scripted narratives and, as a result, bore many features typically associated with written discourse (e.g., lack of spontaneity, hesitation, repetition, and redundancy). Given these limitations, this study has advanced understanding of the nature of the relationships between input text characteristics and listening task difficulty and has opened up new avenues for further investigation.