


1. Introduction
Understanding the coupled ocean atmosphere sea-ice system is a difficult problem, especially in the region around Antarctica where there is large seasonal and interannual variation in the sea ice and the observational record is short. A possible analysis method is to verify global climate models (GCMs) against such observations as are available, then use the models to probe the modes of variability and possible connections to climate change. Verification of the global and hemispheric climate signal for the U.K. Meteorological Office (UKMO) Hadlcy Centre HADCM2 model for the last century was carried out by Reference Mitchell, Johns, Gregory and TettMitchell and others (1995), but this paper is the first study where model results have been compared with observations over Antarctica and surrounding seas, where there is the issue ofhow much the uptake of heat by the ocean causes asymmetry in the response in climate between the two hemispheres. Early GCM studies of climate change, where the atmosphere is coupled to a mixed-layer ocean (Reference Houghton, Jenkins and EphraumsHoughton and others, 1990), showed large temperature changes in the Antarctic region. One of the largest changes in climate response between these early “equilibrium” experiments and transient simulations, where a full dynamic ocean is used, occurs in the region around Antarctica. This is because heat transfer into the deep ocean significantly moderates warming in the coupled-model Studies. This subduction of heat into the Southern Ocean has consequences for climate-change scenarios across the Southern Hemisphere continents (Reference Hirst, Gordon and O'FarrellHirst and others, 1996; Reference Whetton, England, O'Farrell, Watterson and PittockWhetton and others, 1996).
Data scarcity makes verification of GCMs over the Antarctic region very difficult. By comparing the results from ihree different coupled models we can enhance our confidence in their simulations if they agree, or conversely have little confidence if they disagree.
The Antarctic Peninsula is a region ofparticularly high tempera!lire variability, possibly because it is further north and hence closer to the variable ice edge than other parts of Antarctica. It has also seen very large positive temperature trends over the last 50 years: up to 0.8JC per decade in winter (Reference KingKing, 1994). We inquire into the reasons for these trends: are they a product of natural variability, or perhaps an amplified signal of global climate change?
2. Models and Observational Data
For each of the three coupled GCMs used in this paper, there is a control run forced with constant CO2 to assess the basic model stability and degree of unforced variability. The climate-change runs are forced by observed CO2 variations (since 1880) but are otherwise identical to their controls. All three runs have an atmospheric model coupled to deep-ocean and sea-ice models: all use flux correction 10 prevent ch ili in the condol climate which would otherwise occur.
The UKMO model is a gridpoint model with a resolution of 2.5° latitude by 3.75° longitude and 19 vertical levels. The land, atmosphere and ocean components are described by Reference JohnsJohns and others (1997), who describe the control run used here.The Hamburg Max-Planck-Instiiui (MPI) model is the EC1IAM4/OPYC3 version which is spectral with a horizontal resolution of T42, approximately equivalent to that of the HADCM2, and 19 vertical levels. It is described in Reference Roeckner, Oberhuber, Bacher, Christoph and KirchnerRoeckner and others (1996). The Commonwealth Scientific and Industrial Research Organisation (CSIRO) atmospheric model is spectral with a lower resolution of R21 and nine vertical levels. The methodology of coupling to an ocean model is described in Reference Gordon and O'FarrellGordon and O'Farrell (1997). The ocean model is the standard GFDL (Geophysical Fluid Dynamics Laboratory) model with 21 levels but includes the Reference Gent and McWilliamsGent and McWilliams (1990) eddy-mixing parameterisa-tion which improves the representation of water masses and stratification in the Southern Ocean. Results from another CSIRO simulation using estimates of sea-surface temperatures and ice extents for the last century (GISST 1.0 (global sea-ice and sca-surfacc temperature data set); Reference Parker, Folland, Bevan, Ward, Jackson, Maskell and MartinsonParker and others, 1995) are included for comparison. The atmospheric component of the model is the same as the one-used in the coupled-model experiments, except that it has higher horizontal resolution (T63).
Observational records in the Antarctic are available from only a few stations and most do not start until the International Geophysical Year in 1957. Station observations are taken from the database of Reference Jones and LimbertJones and Limbert (1987) and updated at the British Antarctic Survey to include data up to 1994, where available. A few stations in the Antarctic Peninsula have .Somewhat longer records which are more useful for detecting multi-decadal variability and trends. Faraday (65.3° S, 64.3° W) records are available from 1944 to 1996, and Rothera (67.57° S, 68.13° W) records from 1947 to 1994. These two stations are on the western side of the Peninsula and are influenced by the Bellingshausen Sea. Esperanza (63 4° S, 57.0° W; data from 1945 to 1988) is on the eastern side and more influenced by the Weddell Sea. Oreadas (60.7° S, 44.7° W; 1903-86) is further north.
3. Comparison of Temperature Trends Over Antarctica
The winter (June-August; hereafter JJA) temperature trends from CO2-forced runs of three coupled GCMs for the period 1880-1990 are shown in Figure 1. Despite the apparent dissimilarity of the pictures, some features are common to at least two of the models. All the models show significant trends at approximately 130° E, although the warming is small (but significant at a 95% confidence level) in the UKMO model and the MPI run shows a strong cooling. The eastern Weddell Sea also shows sensitivity, with the UKMO model having its strongest warming there. The MPI run shows a slight cooling in this region. One feature that the models do agree on is that there is little or no warming in the Antarctic Peninsula region, particularly to the west; the little warming that is present there is not significant.
Closer examination of the MPI model shows very large trends. The model results were processed using empirical orthogonal function analysis and show (unsurprisingly) a close connection between the temperature decreases and sea-ice growth in the region near the coast at 130° E. These trends are linked to a strong oscillation with a period of approximately 45 years. This oscillation is present in both the control and CO2 integrations, though it is somewhat clearer in the control integrations without the extra CO2-induced signal. The oscillation in the MPI data is in the near-surface temperature and sea-ice fields over a wide region from the Antarctic Peninsula west to the Ross Sea and near the East Antarctic coast, with an out-of-phase character between the maxima shown in Figure lb in the Ross Sea and at 130° E. The somewhat irregular oscillation
Winter (JJA) temperature trends (°Ca−1) from 1880 to 1990 from coupled CO 2-forced transient runs from: (a) UKM0,(b) MPI, (c) CSIRO. Areas of change not significant at a 95% confidence level are masked.

has a peak-to-peak magnitude of up to 8°C in surface temperature at Faraday. Further, the longer-term (90 year) observational record al Oreadas shows no such oscillation; and the large spatial scale of the model oscillation, with out-of-phase changes between the Peninsula region and in the East Antarctic sea-ice zone is not seen in observations. The presence of this oscillation gave us reservations over the performance of MPI control climate simulation in the Antarctic region and we conclude that the MPI model is not suitable for examining climate change in this region, but we will still present comparative results for the control simulation as part of Figures 2-4.
The largest observedJJA temperature trends around the East Antarctic coast are seen in this region at Dumont d'Ur-ville (140° E; 0.062°Ca−1) and Casey (110.5° E; 0.056°Ca−1), although the trend at Casey is not significant. in Figure 1 this region shows significani trends in the CSIRO model, a weak trend in the UKMO model and cooling trends in the MPI model.
The region with the largest temperature trends in Antarctica is the western side of the Anlarctic Peninsula. The UKMO and CSIRO models show no significant warming in this region; in fact, nowhere in the Antarctic region are the century trends in the models (Fig. 1) as large as those observed at the Peninsula stations. It may be that the regional climate sensitivity of these models is too low. The equilibrium global sensitivities of the UKMO and CSIRO models are 2.5° and 4.3°C, which cover the middle to upper part of the Intergovernmental Panel on Climate Change range.
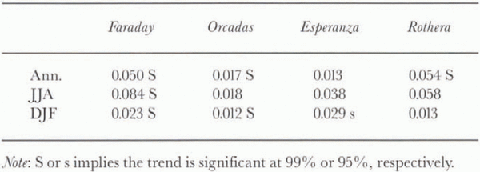
Observed température trends (°Ca−1) for annual, JJA and DJF periods at Faraday, Oreadas, Esperanza and Rothera
4. Temperature Changes in The Antarctic Peninsula
Observations show that some stations in this area have seen temperature rises of up to 0.08°Ca−1 in winter (JJA) over the last 40 years, which are larger than anywhere else in Antarctica. Table 1 shows the observed temperature trends at Faraday, Oreadas, Esperanza and Rothera.
Trends are larger in winter (JJA) than in the annual average. Faraday and Rothera, on the western side of the Peninsula and mostly influenced by the Bellingshausen Sea climate, show the largest trends. The warming al Esperanza, on the eastern side, is smaller and not significan! except in summer. Further north, at Oreadas, trends are lower and less seasonally distinct, since this station is less influenced by sea ice. Data from southern Chile and Argentina also show significant annual trends in air temperature since the 1960s of around 0.02°Ca−1 (Reference Rosenbluth, Fuenzalida and AceitunoRosenbluth and others, 1997). King (1994) tried to relate temperature trends in the Peninsula region with indices of sea ice, atmospheric circulation and
Annual 1.5 m temperature 50year trend distribution at Faraday, (a) UKMO, (b) MPI, (c) CSIRO.

cloud cover. He found a strong association between sea ice and temperature, but could not conclusively link these together. He concluded that atmosphere—ocean interactions in the Bellingshausen Sea and Drake Passage were likely to be responsible for the temperature anomalies at Faraday.
The previous section showed that the UKMO and CSIRO models show little long-term warming trend at these stations; instead we consider the hypothesis that temperature trends of these magniludes could be caused by simple climatic variability. To do this, we examine the distribution of temperature trends in GCM control runs.
JJA 1.5m temperature 50 year trend distribution at Faraday, (a) UKMO, (b) MPI,(c) CSIRO.

Figures 2-4 show the distribution of 50 year annually averaged, JJA and DJF (December-February) temperature trends from the UKMO, MPI and CSIRO GCMs.
One thousand years of data were available from the UKMO and CSIRO control runs. From a 1000 year run there are 950 trend lines, but these are not, of course, all independent. Only 130 years of data were conveniently available from the MPI model. The UKMO and CSIRO models show no trends greater than or equal to those observed in annual mean or summer. in winter the UKMO model shows a positive trend greater than that observed in only 0.7 % of cases.
The MPI model shows a significant proportion of trends greater than those observed in all seasons; this is explained by the unrealistic oscillation discussed in the previous section.
The UKMO and CSIRO models indicate that trends like that observed at Faraday are very unlikely to be due to variability, or at least variability as simulated by the models. If the trend is a mixture of variability, cyclic behaviour and background trend, then the models suggests that the variability component is small. A run similar to the control, but with increasing levels of CO2 prescribed to match the observed changes for the last century, also fails to show trends of the observed magnitude. in fact, for the UKMO model, the trends in the CO2-forced case are somewhat lower than in the control run, indicating that the CO2-induced warming has not really begun around Antarctica. This seems to indicate that these model simulations are flawed, either in failing to produce the regional anthropogenic warming signal or in not including whatever natural process has produced the observed Peninsula warming. The UKMO model is known to simulate the atmospheric circulation variability with some fidelity at high latitudes (Con-nolley, 1997) and has about as much variability in global mean temperature as reality (Tell and others, 1997), but the simulation of high-latitude temperature is less certain. One encouraging sign is that the modelled trends are larger in JJA than in annual mean, which in turn are greater than in DJF, like those observed.
DJF 1.5 m temperature 50year trend distribution at Faraday, (a) UKMO,(b) MPl (c) CSIRO.

1.5m temperature 50year trend distribution for CSIRO GISSTat Faraday, (a) Annual, (b) JJA, (e) DJF.

JJA 1.5 m temperature difference, 1980s minus 1950s for CSIRO-GISST.

One possible failing of our approach of testing the observed trends against those modelled is that weaknesses in the coupled GCMs used may mean that the warming they simulate is unrealistic, To investigate this problem, we used the CSIRO model forced by observed sea-surface temperatures (SSTs) and sea ice from 1880 to 1990, using GISST 1.0 (Parker and others, 1995). There are some reservations with GISST 1.0, especially in the data-sparse AntarctiC. Sea-ice and SSTobservations for most of the southern high latitudes for the early period are largely taken from cli-matology, and global coverage is not available until the satellite era (1970s). However, temperature variations over most of the rest of the globe, and in particular in the tropics, should be well resolved in this forcing dataset. Only sea-ice extent is available, so thickness is prescribed at 2 m and con-cenlralion as 100% in the run used here. Figure 5 shows that even in these runs the trends modelled are not as large as observations; indeed they are very much in line with those simulated by the coupled models.
It is possible that the lack of data in the first half of the GISSTdataset masks any warming that the model might be expected to show. This is partly supported by Figure 6, which shows the warming in winter in the latter part of the run, between the 1950s and the 1980s. Although warming over the Peninsula itself is still slight, there is considerable warming in the Bellingshausen Sea linked to sea-ice-edge variations. This is likely, in reality, to be related to variations in iff concentration and thickness which could lead to warming nearer the Peninsula. in the model, only ice extent is allowed to vary and so warming is confined to the ice-edge area.
5. Discussion
According to Reference Kattenberg, Houghton, Filho, Callander, Harris, Kattenberg and MaskellKattenberg and others (1996), GCM results are most likely to be trustworthy on global and continental scales, but confidence in regional simulations is low. We have examined the patterns of temperature variation around Antarctica from three different coupled GCMs. The large natural variability in the region and the shortness of the observational record means that significant trends are hard to establish. The models show sensitivity in the region near 130° E where positive trends are observed in two of the models, possibly because this is the area of East Antarctica where the sea ice most closely approaches the coast. While we have examined only the winter trends in this area, any decrease in summer sea ice here will affect temperatures in autumn and winter at coastal stations as the freeze-up is delayed. However, the UKMO and CSIRO models also show positive trends in the eastern Weddell Sea where observed trends are small and insignificant, and little trend near the Antarctic Peninsula where observed trends are largest. It is possible that the warming in the Antarctic Peninsula is regional in character and not linked to any larger-scale warming; if so, the distribution of trends from coupled transient and control runs shows that the models fail to capture whatever processes are responsible for this warming.
There are still a number of outstanding problems in coupled models which may impact on the success of these models in matching the observations. These problems may be linked to the sea-ice formulation. The UKMO model sea ice is too extensive, although the control is commendably drift-free. The MPI has a substantial climate drift in the control run linked to excessive growth in sea ice, but the seasonal cycle is well simulated. The CSIRO model has a reasonable seasonal cycle of sea-ice extent, but its sensitivity to an increase in ocean température may be too low. A further issue under investigation is whether the high rates of heat subduction in the coupled models are being overestimated due to the model's representation of water-mass formation and mixing (England, 1995; Whetton and others, 1996). The choice of the Antarctic Peninsula region to test the model is based on the high sensitivity that has been observed and the sparsity of data from other regions of the Southern Ocean and may be loo limited a sample to judge the model performance. The two preferred models do show some skill in the East Antarctic 110-140° E sector. However, if we were to consider flow well the models perform away from the continent and north of the seasonal ice edge, in the broad expanse of the Southern Ocean, there are only limited observations from the sub-Antarctic islands (e.g. Macquaric, Campbell, Kerguelen). A comparison of the trends portrayed by Jones (1995) for these islands and the trends simulated during the last century in Figure 1 shows that the models are not simulating the observed trends over the Southern Ocean either.
The results for the next century of the UKMO and CSIRO simulations are examined further in O'Farrell and Connolley (1998) to see if the higher levels of CO2 concen-trations in the simulation produce a strong enough signal to overcome the decadal variability in the model and the pattern of the warming signal in the Peninsula region.
Acknowledgements
We are grateful toj. Mitchell and group members at the UKMO Hadley Centre, Bracknell, for permission to use model data from their HADCM2 runs, to J. Oberhuber and group members at MPI for the ECHAM4/OPYC runs; and to the CSIRO climate-modelling group for access to coupled-model and GISST simulations and the Antarctic CRC for computer time for the simulation of the climate of the last century.



