I. INTRODUCTION
Creating ordered, crystalline structures is essential for a broad range of materials research. One standard means to achieve this is by using an appropriate substrate that serves both to concentrate the crystallizing molecules and also to impart order.Reference Grzybowski, Wilmer, Kim, Browne and Bishop1 For small growth units (0.1–1 nm) such as metals and semiconductors, epitaxial substrates are widely used to grow films. In this case, “patterning” is created by employing crystalline materials with the same, or similar, lattice spacing. In this size regime, the driving force for crystallization is dominated by the molecule–molecule and molecule–substrate interatomic potentials. For large growth units (100–5000 nm), such as found in colloidal crystallization, patterning is based on lithography, which has been used to create morphological and compositional surface variations. Such substrates have been used for colloidal epitaxyReference van Blaaderen, Ruel and Wiltzius2 to create ordered structures typically composed of silica and PMMA spheres.Reference Aizenberg, Braun and Wiltzius3 Because of the large particle sizes, entropic terms stemming from excluded volume effects play a larger role during materials assembly.Reference Lin, Crocker, Prasad, Schofield, Weitz, Lubensky and Yodh4
The intermediate regime, between inorganic crystalline structures and the capabilities of lithography, remains a challenge. This size range between 1 and 100 nm is of considerable interest for the ordering of proteins, viruses, dendrimers, and nanoparticles. This scale is also of interest for fundamental crystallization studies because the magnitude of the interaction potential and the entropic terms cross over within this range.
Within the intermediate regime, protein crystallization is of particular technological interest and an area where engineered nucleants may be of considerable value.Reference Saridakis and Chayen5 The crystallization of proteins is a difficult and crucial step in the determination of their structure. In practical terms, there is at best a limited range of protein supersaturation in solution growth that creates x-ray diffraction quality protein crystals. Low concentration leads to exponentially long nucleation times and slow growth, while high supersaturation produces an excess of small crystals and unacceptably high defect densities. Much effort has gone into combinatorial search of medium, precipitants, concentrations, and temperatures to find optimal conditions for protein crystal synthesis. It has been appreciated that protein epitaxy on an appropriate substrate could assist protein crystallization efforts,Reference Galli, Coen, Hauert, Katanaev, Wymann, Groning and Schlapbach6–Reference McPherson and Shlichta8 but there are few materials with periodicities commensurate with typical protein dimensions (2–20 nm). In this paper, we demonstrate that prepared cross sections of nanolaminate structures can be used to order proteins. The nanolaminate is fabricated by sequential physical vapor deposition using magnetron sputter sources, sectioned across the nanolayers of materials, and polished to present a flat, nanolaminate heterosurface. Control of both substrate layer composition and thickness at the nanoscale enables the intentional tuning of the molecule–molecule and molecule–substrate interactions of an assembling monolayer.
A short description of the magnetron sputter deposition process used to fabricate the Al2O3/SiO2 nanolaminates is presented. Along with a list of the broad range of materials already fabricated in nanolaminate form. In this paper we report the use of cross sections of alumina–silica nanolaminate structures as templates to order the enzyme, ATCase. We also show by means of model calculations that the ability to synthetically determine the nanolaminate periodicity enables nanolaminate period tuning to create either one-dimensional or two-dimensional protein ordering.
II. METHODS
A. Fabrication of nanostructured surfaces
In the work reported here, alternating nanometer thickness layers of differing compositionReference Barbee, Chang and Giessen9–Reference Barbee and Keith11 were synthesized by reactive magnetron sputter deposition.Reference Barbee, Keith, Nagel and Tiller12 The resulting nanolaminate materials are low-contamination nanolaminate solids with high interface concentration (Fig. 1). These structures can be crystalline/crystalline,Reference Hodge, Wang and Barbee13 amorphous/crystalline,Reference Wang, Li, Hamza and Barbee14 or amorphous/amorphous in structure. The initial technological applications of these nanolaminate/multilayer materials were as Bragg diffraction reflecting structuresReference Barbee15–Reference Walker, Barbee, Hoover and Lindblom17 for short wavelength domains not accessible with naturally occurring crystals. However, since this first application multilayers have been synthesized by physical vapor deposition from more than 75 of the 92 naturally occurring elements and applied in a broad range of scientific investigations as well as diverse technological development efforts. Individual nanolaminate component material layers can be elemental, alloy, or in the form of compounds to produce a rich variety of metal–oxide, oxide–oxide, and metal–metal structures. Individual layer thickness of 1.0 nm have been achieved,Reference Barbee15, Reference Barbee16 and total thicknesses larger than 200 μm have be made with several materials.Reference Shute, Myers, Xie, Barbee, Hodge and Weertman18
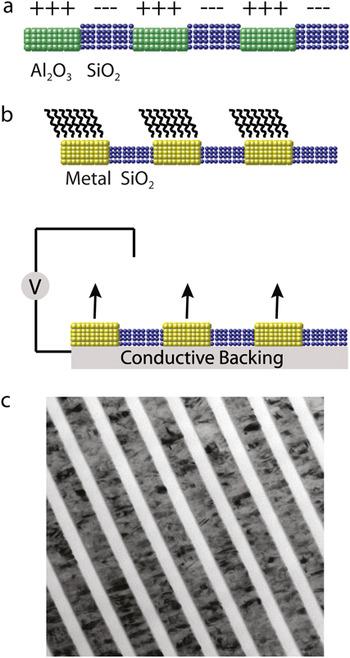
(a) Nanolaminate structure composed of alumina and silica in cross section with positive and negative surface charge, respectively. (b) Metal–oxide nanolaminate structures in cross section with chemical functionalization of the metal (top) and with an applied external field (bottom). (c) An example of a metal–oxide nanolaminate is shown in the TEM image of a Monel 400 (thickness 47.8 nm)/SiO2 (thickness 28.2 nm) cross section: this sample was synthesized using reactive magnetron sputter deposition for the SiO2.

Engineering calibration of nanolaminate synthesis process parameters for the range of materials used here were empirically determined. Important nanolaminate structural and fabrication process characteristics include: (i) layer thicknesses, (ii) layer thickness uniformity throughout a sample, (iii) layer composition, (iv) fabrication process reproducibility, (v) fabrication process stability in a long (>300 h) deposition experiment, and (vi) fabrication process flexibility. Therefore, a systematic approach to the development of a nanolaminate magnetron sputter deposition process is needed to reproducibly achieve the structural and fabrication process characteristics outlined above. Four basic characteristics of magnetron sputtering and the technology applied here make this possible. First, the magnetron sputter sources are energized with very stable direct current electrical power supplies: stability at the 1 part in 10,000 is available. Second, the integrated sputtering rate (atoms/unit time) of a given material in a given source geometry is empirically known to be nearly linearly dependent on the sputter source excitation power and to be very reproducible given the power applied is reproducible and stable (1 part in 10,000). Third, stable, 1 part in 10,000, motion control is available. Implementation of these levels of individual synthesis process component control makes it possible to run the deposition process “open loop” with no feedback control of layer thickness while maintaining layer thickness uniformity and stability at the 0.01 nm level for x-ray optics.
We also note that the inherent chemical difference between nanolaminate component layer materials differing chemistries allow the possibility of area-specific functionalization and manipulation of the local electric field. A schematic of potential nanolaminate structures is shown in Figs. 1(a) and 1(b) shown with an example of a metal–silica nanolaminate [Fig. 1(c)]. Metal–oxide nanolaminates extend functionality by allowing control of the electric field at the surface of the metallic layer using an external power supply. Additionally, metal stripes can be functionalized using convenient linking chemistries such as alkanethiols, catenanes, and oligonucleotides. An example of a metal–oxide nanolaminate structures is shown in Fig. 1(c) where a transmission electron microscope (TEM) image of a cross section of a Monel 400/SiO2 nanolaminate is presented. The SiO2 layers (28.2 nm) are amorphous, while the Monel 400 (47.8 nm) are nanocrystalline.
B. Characterization of nanolaminates and samples for protein epitaxy
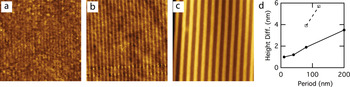
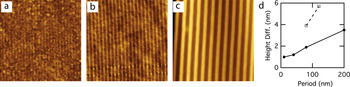
In this work we describe nanolaminates composed of the oxides: ZrO2, Al2O3, and SiO2. The Al2O3–SiO2 pair provides the combination of highest surface quality and greatest variation in component materials isoelectric points. Atomic force microscopy (AFM) images of the surfaces of polished cross sections of the nanolaminates showed that partial dissolution of the Al2O3 layers occurred during sample preparation (Fig. 2). The Al2O3/SiO2 samples were observed to be more stable against this preferential material removal. For these reasons we selected the Al2O3–SiO2 pair as the substrates for the protein deposition experiments.
AFM images of alumina–silica multilayers of differing periods and ratios of materials. (a) 55 nm square image with 10 nm periods, 5 nm SiO2, and 5 nm Al2O3. (b) 2000 nm image with asymmetric pairs 13 nm SiO2 and 78 nm Al2O3. (c) 2 × 2 μm image with multilayers 100 nm SiO2 and 100 nm Al2O3. The alumina etches slightly leading to height variations. (d) Plot of the measured height difference between SiO2 and the recessed Al2O3 strips versus the nanolaminate period (T).
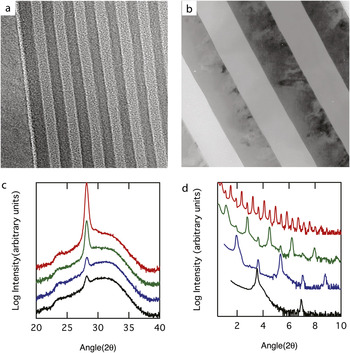
Prototypical nanolaminates were constructed using magneton reactive sputtering to deposit alternating layers of amorphous alumina and amorphous silica onto a silicon (100) substrate.Reference Barbee and Keith11, Reference Barbee, Keith, Nagel and Tiller12 The double-layer period was varied from 8 to 200 nm—with nominal periods of 8, 10, 20, 40, 80, and 200 nm. Within one nanolaminate sample, the period varies by a factor of approximately 2.5 over a 2 in. radius. Thus, intermediate periods are obtained by cutting pieces at different positions on the sample. The total thickness of the multilayer composite is typically 5 μm and, e.g., 25 alumina–silica pairs with periods of 200 nm. Calibration of this synthesis process was achieved by determination of the layer periodicity using both TEM (Al2O3/SiO2 and ZrO2/SiO2) and XRD for a subset of the samples (Fig. 3). Transmission electron microscopy (TEM) plan view and cross-section samples from SiO2/Al2O3 and ZrO2/Al2O3 nanolaminates were preparedReference Bravman and Sinclair19, Reference Wall20 and examined using a JEOL 200CX (JEOL Ltd, Tokyo, Japan) electron microscope; typical results are presented in Figs. 1(c), 3(a), and 3(b). Standard x-ray powder diffraction Bragg–Bretano Θ/2Θ scans were performed using a Philips XRG 31000 (Philips Electronics Inc., Amsterdam, Netherlands) diffractometer with Cu Kα (0.15418 nm) radiation; results are presented in Figs. 3(c) and 3(d).
TEM micrographs of (a) a SiO2/Al2O3 8 nm structure and (b) a ZrO2/Al2O3 200 nm period structure, both composed of component layers of equal thickness, are shown. (c) High-angle x-ray diffraction curves for ZrO2/Al2O3 nanolaminate superlattices (in this figure) having periods of ~80 (black), 85 (blue), 120 (green) and 125 (red) nm in both parts of (c) enable assessment of the atomic arrangements in the individual layers as a function of the nanolaminate layer thicknesses. These high-angle x-ray diffraction data show that the ZrO2 layers are partially crystalline monoclinic in structure and the Al2O3 is amorphous. (d) The low-angle nanolaminate superlattice x-ray diffraction data for ZrO2/Al2O3 nanolaminate superlattices having periods of ~2.7 (black), 5.0 (blue), 10.0 (green) and 20.0 (red) nm shown in this figure make possible accurate determination of the nanolaminate periodicity through the refraction-corrected Bragg’s equation.

Low-angle x-ray diffraction from ZrO2/Al2O3 nanolaminate superlattices having periods of ~2.7, 5.0, 10.0, and 20.0 nm is presented in Fig. 3. High-angle diffraction observations indicate that the ZrO2 layers are partially crystalline with a monoclinic structure and Al2O3 is amorphous [Fig. 3(d)]. The TEM micrographs are of a ZrO2/Al2O3 200 nm period structure and a SiO2/Al2O3 8 nm structure; both samples were composed of component layers of equal thickness. These images present data representative of the typical component layer uniformity and interfacial quality of our nanolaminate materials
C. Surface preparation
Sections of the wafers are mounted in epoxy and polished, exposing their cross section as illustrated in Fig. 2. Several nanolaminates were mounted in the same epoxy puck allowing samples with different periods to be subjected to the same sample preparation and experimental conditions. The surfaces used in these experiments were first polished with 0.02 μm colloidal silica and ultrasonically cleaned for 5 min in an alkaline detergent (1% Brulin 815GD, Brulin Corp., Indianapolis, IN) at 50 °C, followed by 10 min in deionized water (Millipore, Billerica, MA) at 50 °C. The detergent, Brulin 815GD, is a proprietary mixture of surfactants, alkaline components, and corrosion inhibitors; it has been tested on aluminum/aluminum–oxide interfaces and shown not to leave residues.Reference Cherepy, Shen, Esposito and Tillotson21 The polishing and cleaning steps preferentially etch the alumina relative to the silica as revealed by topographic measurements using the AFM. The detergent contains sodium metasilicate and sodium tripolyphosphate that are known to sequester metal ions and may contribute to etching. The isoelectric points (IEP) for clean alumina and silica are 9 and 2.7, respectively.Reference Stumm22 Processing may chemically alter the alumina or silica surfaces, possibly shifting their isoelectric points; however, a critical review of isoelectric points reports that pure alumina ranges from 8.7 to 9 with hydrous aluminum oxide also at 9 and silica prepared under a range of conditions may vary between 2.3 and 3.Reference Kosmulski23, Reference Kosmulski24 Thus, although the isoelectric points of the SiO2 and Al2O3 layers in these samples were not measured, they are expected to have opposite surface charge at neutral pH.
D. Protein deposition
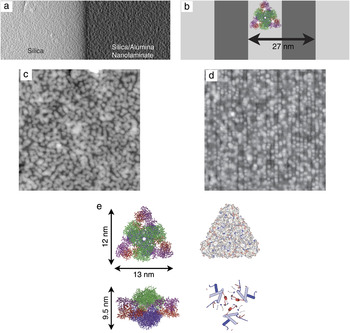
Cleaned, polished substrates were used as templates for subsequent protein deposition. A large protein was chosen such that its size was within the range of multilayer periods that were produced. The range of substrate widths could then be used to reveal the effect of commensurability on protein epitaxy. The large protein size is also an advantage in AFM measurements. We used the enzyme aspartate transcarbamoylase (ATCase), an approximately 12 × 13 × 9.5 nm prolate ellipsoidal protein, which has an approximately oval (clamlike) shape when viewed along its 2-fold axis and a roughly triangular shape when viewed along its 3-fold axis [Fig. 4(e)]. ATCase was also chosen for its robustness. It has a melting temperature of 66.8 °C,Reference Edge, Allewell and Sturtevant25 which suggests that it has a relatively high degree of stability that would make it less likely to denature upon binding to a surface than a protein with a lower melting point. However, the biological activity was not tested on substrate-bound ATCase, and our experiments did not have sufficient resolution to determine the degree of conformational change upon binding to the substrate.
AFM images near the boundary between the silica substrate and the alumina–silica nanolaminate show that the nanolaminate template orders protein. (a) Hybrid topography and shadow contrast AFM image of 1.5 × 3 μm area spanning the boundary. A large step separates the upraised silica (light) and the lower (dark) nanolaminate. Shadowing provides contrast due to the protein. (c) Zoomed 800 × 800 nm height images of ATCase deposited on the (c) homogeneous silica region and (d) nanolaminate region with a period of 27 nm. (c) and (d) were imaged within a micrometer of one another and thus exposed to similar protein concentrations. (b) Nanolaminate schematic with silica (light) and alumina (dark) stripes in cross section and plan view. (e) Enzyme aspartate transcarbamoylase looking down the 3-fold and 2-fold axes. The catalytic trimers are shown in green and blue, and regulatory dimers are shown in violet and red. The right upper schematic is color coded for the charge of the surface residues with red as negative and blue as positive. The right lower image is color coded for hydrophobicity with red as hydrophilic and blue as hydrophobic.

ATCase from Escherichia coli is a large, multimeric protein composed of 12 polypeptide chains, with a native M r of 310 kDa. ATCase catalyzes the first reaction specific to the biosynthesis of pyrimidine nucleotides, which are used as DNA precursors. ATCase containing a His6 sequence at the amino-termini of the regulatory chains was purified by metal–chelate chromatography as previously described.Reference Graf and Schachman26 ATCase has been crystallized in several crystal symmetries: P321 (PDB ID 6at1),Reference Ke, Honzatko and Lipscomb27 R32 (PDB ID 2atc),Reference Honzatko, Crawford, Monaco, Ladner, Edwards, Evans, Warren, Wiley, Ladner and Lipscomb28 and most recently, H3 (PDB ID 3d7s).Reference Stieglitz, Xia and Kantrowitz29 The isoelectric point calculated from the sequence is 6.32 using ProtParam.Reference Gasteiger, Hoogland, Gattiker, Duvaud, Wilkins, Appel, Bairoch and Walker30
Protein was deposited onto the nanolaminate substrate using three steps: incubation in a protein solution, rinsing in distilled water, and drying using nitrogen gas. A similar process has been used to study the effect of pH and substrate chemistry on protein ordering at interfaces.Reference Schonafinger, Morbitzer, Kress, Essen, Noll and Hampp31
A 5–8 μL droplet of 0.3 mg/mL ATCase in Tris buffer at pH of 7.5 was placed on the nanolaminate substrate and allowed to interact with its surface in ambient atmosphere for approximately 10 min. The hydrophilic substrate caused the drop to spread several millimeters. Samples were placed under covers to avoid air drafts, but some drying occurred. For this reason the imaging area was chosen to be millimeters away from the droplet edges, which are more prone to drying effects. To rinse away unbound or loosely bound enzyme, the substrate was briefly submersed in a beaker of purified water (Millipore, Billerica, MA) and gently agitated. Only well-bound proteins, (meaning proteins that do not reversibly desorb in seconds) are expected to remain on the surface after this step. The surface was then dried in a flow of N2 gas. We cannot rule out that meniscus forces during drying might rearrange the surface to some degree, but the proteins were well bound, making them less susceptible to external forces. A control droplet without protein was placed on the other end of the sample and subjected to the same conditions.
Although the deposition technique presented previously allows comparisons between neighboring patterned and unpatterned sections subjected to the same condition, the protocol is not optimal for studying quantitative crystallization dynamics because the relationship between solution concentration and surface adsorption could not be determined as a result of the concentration gradients that appear across the drop. A more controlled experiment would flow the protein across the surface and image in situ. This would also remove any uncertainty associated with the effect of rinsing or drying.
E. Imaging and image analysis
Tapping mode imaging was performed under ambient conditions (Veeco Multimode, Santa Barbara, CA) using an ~10 μm (“E”) scanner and using a cantilever with an attached carbon nanotube tip (PiezoMax Technologies Inc., Madison, WI).
One-dimensional autocorrelation functions were calculated from raw AFM images after subtracting an average polynomial background to remove effects due to drift and backscattered light. Images were rotated such that the nanolaminate stripes were along the y-direction. For discrete data with N × M pixels (each of size D p × D p) the one-dimensional autocorrelation functions along the x (across stripes) and y (on stripe) directions are given by:

where m = x/D p and n = y/D p are the discrete distances between points along the x and y directions, respectively, and hk,l is the height at pixel position k,l. Summations were taken over the entire image. The average surface roughness is obtained from Gx(0) = σ2 where σ is the root-mean-square roughness. Plots shown in Fig. 5 are normalized by the root-mean-square (RMS) roughness. The autocorrelation function of periodic structures also oscillates with the first peak position beyond x = 0 indicating the period. The nanolaminate period (T) is measured from AFM images in this way.
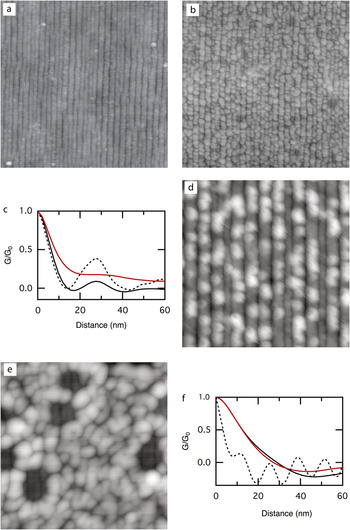
AFM images of surfaces before and after the deposition of ATCase. (a) Nanolaminate with 27 nm period exposed to buffer but no protein. (b) and (d) The same 27 nm nanolaminate (in a different section) exposed to buffer with ATCase. (e) ATCase on a nanolaminate with a smaller period (11.7 nm); the protein does not order. Image parameters are (a) 800 × 800 nm with RMS roughness of 0.6 nm, (b) 800 × 800 nm with RMS roughness 1.5 nm, (d) 300 × 300 nm with RMS roughness of 0.6 nm, (e) 300 × 300 nm with RMS roughness 1.7 nm. (c) and (f) Plots of the normalized one-dimensional correlation function versus distance with Gx shown in black and Gy shown in red. Gx for the underlying nanolaminate (without protein) is shown as a dashed line. (c) Results for images (a) and (b) with T = 27 nm. (f) Results for image (e) with T = 11.7 nm. The substrate without protein is not shown but can be seen in holes within (e).

F. Random sequential adsorption model
To describe expected trends with lattice spacing and with protein coverage, we studied protein adsorption onto nanolaminates using a topologically biased continuous RSA model.Reference Adamczyk, Nattich and Barbasz32, Reference Rizwan and Bhattacharjee33 We considered protein molecules to be circular disks adsorbing onto a substrate where they are only allowed to “stick” to designated regions of the surface. For the purpose of this work we constrained ourselves to the case where particles irreversibly adsorb at random on a regular lattice of parallel straight stripes of widths T/2 that are spaced T/2 apart. There is no adsorption in the spaces between the stripes. This represents a bilayer nanolaminate substrate with periodicity T, where adsorption is strongly preferred on one of the layers.
The model described previously is characterized by only one parameter, i.e., the ratio of the substrate lattice constant T, to the adsorbate diameter D. For values of the ratio much larger than 1, as well as very close to 0, this model becomes equivalent to two-dimensional continuous RSA model. In practice, we perform Monte Carlo simulations on rectangular substrates of size (Lx × Ly) = (100T × 100D). The particles are only allowed to adsorb on half of the substrate consisting of 100 parallel rectangular stripes of size (0.5T × 100D) that are spaced 0.5T apart from each other along the x-axis. The Monte Carlo algorithm is: (i) pick a random integer Ix between 0 and 99, (ii) pick two real random numbers: Rx between 0 and 0.5T, and Ry between 0 and 100D, (iii) make a trial adsorption by placing a circular disc of diameter D with its center positioned at (IxRx, Ry) on the substrate, (iv) check for overlap with previously adsorbed particles on the surface, (v) if overlap was found, reject this particle–otherwise add the particle to the adsorbed layer, and (vi) repeat step (i) for the next trial adsorption attempt. We consider maximum coverage of the substrate has been reached whenever 5 × 10⁶ consecutive trial adsorptions have been rejected.
In the following, we choose the particle diameter to be D = 1 and study the model as a function of lattice constant T. Four different T values: T = 2, 5/3, 4/3, and 1 are considered. We discuss the maximum coverage for these different cases, as well as the dependence of the protein ordering on the value of T. We define the particle coverage θ, to be the fraction of the area covered by the particles to the total surface area of the substrate. We denote the maximum particle coverage, or the jamming coverage on any substrate by θ∞. We study the particle ordering on the nanolaminates by calculating the pair correlation functions along the stripes g(y) and perpendicular to the stripes g(x). We define g(y) a

where Nx(n) is the number of particles in the nth rectangular stripe of size (T × 100D) and yi,n is the position along the y-axis of the ith particle in this stripe. In a similar manner g(x) is defined as

where Ny(n) is the number of particles in the nth rectangular stripe of size (100T × D) and xi,n is the position along the x-axis of the ith particle in this stripe. This is an adequate description of ordering for the model under study where the adsorbing particles are circular disks.
III. RESULTS AND DISCUSSION
A. Nanolaminate templates create linear arrays of protein
The central objective of this paper is to provide experimental evidence that nanolaminate substrates can be used to control ordering by inducing preferentially adsorption on one stripe chemistry over the other. This effect has been demonstrated for colloids at micrometer-length scales, but it has not yet been illustrated in the significantly more challenging nanometer regime.
In our experiments, the ability of the nanolaminate templates to influence order could be visualized by imaging the boundary between the silicon and the nanolaminate structure [Fig. 4(a)]. This region allowed a direct comparison between patterned and unpatterned substrates under nearly identical solution conditions. At this boundary, the nanolaminate was depressed relative to the silicon because of a faster polishing rate of the amorphous phases; the step provided a convenient demarcation between the regions [Fig. 4(a)]. The difference in ordering between the unpatterned silica surface [Fig. 4(c)] and the patterned alumina–silica nanolaminate [Fig. 4(d)] was unambiguous. In the homogeneous silica region, ATCase formed a layer composed of donut-shaped aggregates with 40–60 nm diameters. While the aggregates appeared to have short-range order, they were not always fully formed and were randomly placed on the substrate. Thus, no overall ordering could be discerned. By contrast, in the nanolaminate region, ATCase was preferentially bound along the nanolaminate stripes and had a clear linear ordering.
It should be noted that the patterned and unpatterned regions are far from the edges of the original droplet and are less than 1 μm apart from one another. For this reason, it is reasonable to assume that both regions were exposed to the same protein concentration. Nevertheless, the silica had a higher surface concentration of protein because its entire surface had a favorable binding chemistry, whereas only half of the nanolaminate favored binding.
B. ATCase adsorbs preferentially to silica stripes
It is also noteworthy that ATCase preferentially adsorbed along the silica rather than the alumina portion of the nanolaminate. This is easily seen from images with low protein coverage [Fig. 5(d)]. The protein is well ordered long the upraised lines of silica.
Several complex forces, both long and short ranged, guide the adsorption of proteins onto substrates. These forces include electrostatic forces, hydration forces, van der Waals forces, image forces, entropic forces, and possible hydrogen or chemical bonding between the protein and substrate. The system under consideration consists of alumina (IEP = 9), silica (IEP = 2.7), and ATCase (IEP = 6.3) in a Tris buffer pH of 7.5. This indicates that both the ATCase and silica carry negative charges while the alumina has a positive charge. Derjaguin–Landau–Verwey–Overbeek (DLVO) theory assumes that these electrostatic interactions are the driving force for adsorption. This leads to the prediction that the negatively charged protein will adsorb and order on the positively charged alumina sections of the nanolaminate, the opposite of what is seen experimentally. Other groups have also reported the adsorption of negatively charged proteins onto negative hydrophilic substrates such as silica.Reference Giacomelli and Norde34, Reference Norde, MacRitchie, Novika and Lyklema35
While long-range electrostatic interactions are believed to be important in guiding protein adsorption, the determination of these forces is not straightforward. The electrostatic potential surface of ATCase shows that the net negative charge of the protein is distributed over the protein [Fig. 4(e)]. Because the dimensions of the protein (12 × 13 × 9.5 nm) are large compared with the Debye length (~2 nm) the distribution of patches of charge may be more important than the net charge.Reference Asthagiri and Lenhoff36, Reference Ellis, Kong and Muthukumar37 Another issue is the effective surface charge carried by the silica and alumina sections of the nanolaminate substrate. The use of isoelectric points in determining the surface charge is a convenient first approximation, but counter ions affect these values.Reference Mashl and Gronbech-Jensen38 In the case of silica, an excess of positive ions, such as K+1, adsorbed to surface leads to a more positive zeta potential.Reference Iler39, Reference Kirby and Hasselbrink40 This may result in a weakening of repulsive interactions such that other attractive forces (van der Waals, hydrophobic, or bonding) dominate.
Hydrophobicity may also influence the location of ATCase on the nanolaminate. The silica surface may be assumed to be hydrophilic, although processing conditions will determine the extent of hydrophilicity versus hydrophobicity. Examination of the ATCase crystal structure reveals that 57% of its solvent accessible surface is hydrophobic. Therefore, interactions between hydrophobic areas of the substrate and protein will lower the energy of the system. Examination of the face of the ATCase protein, Fig. 4(e), reveals the existence of relatively hydrophobic helices, which if contacted with a hydrophobic area of the substrate, would lead to adsorption of ATCase in this orientation. As the protein contacts the surface, denaturization may occur as hydrogen or chemical bonds are formed across the protein/substrate interface. This suggests that entropic forces arising from dehydration of hydrophobic areas and/or structural rearrangement of the protein may also be important in guiding the protein into a low energy state on the nanolaminate.
Without detailed modeling, it is unclear which of these potential mechanisms lead to preferential adsorption of ATCase onto silica. However, they do highlight that templates with a variation in isoelectric points may not be universal nucleants for a diverse set of proteins and solutions. The more controlled adsorption mechanisms available by applying fields directly or by functionalizing the surface with specific chemistries may lead to more robust nucleation surfaces.
C. Periodicity and one-dimensional ordering of protein
Independent of the microscopic mechanisms, it is visibly clear that the ATCase preferentially adsorbs to silica when deposited as described. The preference for silica over alumina is evident from the higher protein concentration on the homogeneous silica [Fig. 4(c)] compared with the nanolaminate and is also apparent at low coverage where the protein is centered on upraised silica stripes [Fig. 5(d)]. To further explore the consequence of this chemical preference, several locations on the same substrate were compared both with and without protein (Fig. 5). The degree of order was quantified using the one-dimensional autocorrelation both across the stripes, Gx, and along the stripes, Gy as described in Sec. II.
The control region, which was exposed to the buffer without the protein [Fig. 5(a)], was essentially unchanged from the original freshly cleaned surface (not shown). In this region, the multilayer period was 27 nm (13.5 nm silica and 13.5 nm alumina) with alumina recessed ~1 nm and had an overall RMS roughness of 0.6 nm over a 1 μm2 area. The finite probe width caused the silica “mesa” to appear wider than the alumina “trough.” We note that the edges of the nanolaminate are somewhat wavy. We believe that the topographic relief of the alumina layer in combination with the stresses of polishing and sonication permitted some bending in the silica edges at these length scales. This edge wandering causes the amplitude of the oscillations in the autocorrelation function Gx to decay with distance [Fig. 5(c), dashed line].
The same 27 nm period nanolaminate under the protein droplet [Fig. 5(b)] showed ordering of ATCase along the underlying stripes. The autocorrelation function along the x-direction [Fig. 5(c), black solid line] showed that the protein had the same periodicity as the nanolaminate. By contrast, the autocorrelation function along the stripe, Gy [Fig. 5(c), red line] did not show ordering, and instead decayed to zero. This is unexpected, because as described below, even a random sequential adsorption model, would predict correlation (a peak) at the protein–protein spacing. We attribute this to the fact that we individual proteins are not well resolved when they are clustered. This is not simply a matter of probe diameter as we can resolve “hard” nanolaminate structures with features smaller than the protein dimensions [Fig. 5(e)]. We also suspect that the proteins deposit in multiple orientations due to the variations in height that are seen in the image. Both of these effects will limit the measured on-stripe correlation.
A smaller, 11.7 nm period nanolaminate (5.85 nm silica, 5.85 nm alumina) was also examined [Fig. 5(e)]. In this case, the nanolaminate period is smaller than the protein dimensions and the protein formed disordered surface layers. The protein formed circular clusters similar to those seen on homogeneous silica surfaces suggesting protein–protein interactions. The underlying 11.7 nm period template could be observed in holes where the protein did not adsorb. The autocorrelation functions along both the x- and y-directions are similar, both decaying to zero without evidence of a periodic structure. This is in contrast to the underlying nanolaminate (dashed line), which shows clear oscillations.
D. Random-sequential adsorption model
To provide some insight into expected trends with protein coverage and nanolaminate periodicity, we use a random sequential adsorption (RSA) model. Random sequential adsorption is often used to describe protein and colloidal deposition onto substrates.Reference Oberholzer, Stankovich, Carnie, Chan and Lenhoff41, Reference Onoda and Liniger42 Such models do not include attractive interactions or diffusion and thus reflect the order of steric constraints. They illuminate how geometric considerations affect the surface coverage as well as particle–particle correlations. In the absence of surface diffusion and attractive interparticle forces, they provide lower bounds on the degree of particle ordering that can be achieved in the adsorbed layer.
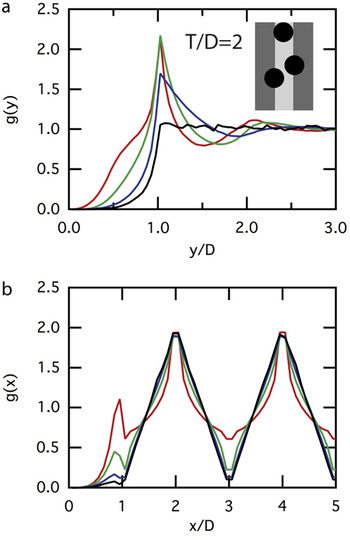
For the sake of comparison to the experimental AFM images above of the ACTase protein adsorbed onto alumina/silica nanolaminates with a ratio of the lattice constant to the protein diameter of approximately 27/13.5 nm, we start by studying the RSA model with lattice constant T = 2 (where we keep D = 1). The maximum coverage for this model is approximately θ∞ = 0.434. Since in the experiments a varying degree of coverage on the different regions of the substrate was observed, we have calculated g(x) and g(y) for the maximum coverage θ∞, as well as three cases where lower coverage of 0.1θ∞, 0.6θ∞, 0.8θ∞, were enforced, see Fig. 6. Note that the RSA model leads to clear short-range ordering along the nanolaminate layers as observed in g(y), with a prominent first peak whose position is unaffected by coverage, while its intensity increases with increasing coverage. This peak is absent in the correlation functions from the AFM images [Fig. 5(e)] as discussed previously. Perpendicular to the nanolaminate layers, g(x) shows clear long-range ordering with a periodicity equal to the lattice constant T. This is observed in the AFM data as expected.
Pair distribution functions (a) parallel, g(y) and (b) perpendicular, g(x), to the nanolaminate substrate layers shown as a function of particle spacing in the unit of particle diameters (D). Plots shown for an RSA model with lattice constant T = 2 at four different coverages: 0.434 (jamming, red), 0.347 (green), 0.260 (blue), and 0.043 (black). Inset: underlying nanolaminate with silica in light gray, alumina in dark gray, and adsorbed particles in black.

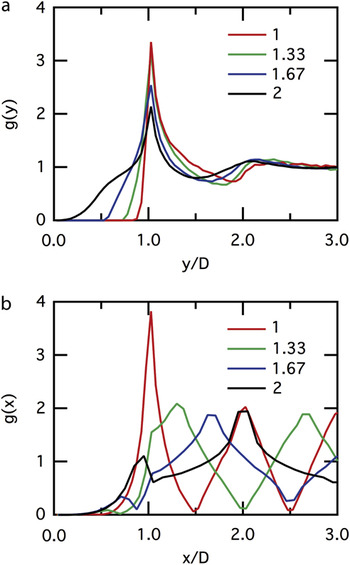
For the lattice period T = 2 studied previously, neighboring nanolaminate substrate layers do not interact and can thus be considered independent. As T/D is reduced, adsorbed particles on neighboring layers can overlap, leading to nontrivial interaction between them. We have studied the effect of this interaction by studying three RSA models with T = 5/3, 4/3, and 1. We observe that in this regime, the maximum coverage increases as T is reduced and ultimately becomes as high as θ∞ = 0.556 for T = 1. Figure 7 also shows the effect of interaction on g(y) and g(x), which illustrates increased ordering with decreasing T. In particular, the intensity of the first peak in both g(y) and g(x) increases as the nanolaminate lattice constant is reduced. Note again that the position of the first peak in g(y) is unaffected by the change in T. We conclude here by pointing out that the maximum coverage as well as the intensity of the first peak of the pair correlation functions will only decrease as T is reduced further below 1. This is because the nanolaminate becomes a less-effective template for ordering when the width of a bilayer becomes smaller than the particle diameter.
Pair distribution as a function of particle spacing in the unit of particle diameters (D), parallel g(y), and perpendicular g(x), to the nanolaminate substrate layers. Plots shown for four different RSA models with lattice constants T = 2 (black), 5/3 (blue), 4/3 (green), and 1 (red), at jamming coverage.

IV. CONCLUSIONS
These experiments have established that ATCase binds preferentially to silica over alumina. This chemical specificity has been exploited by using patterned substrates to create linear arrays of proteins. We also show that protein ordering is distinctly different on homogeneous versus patterned substrates and that substrate periodicities that are too small do not result in order. Although experiments at these length scales are demanding, our observations so far are in some ways trivial; the degree of ordering that we can prove is based simply on sticky and nonsticky regions. Ultimately, one would like to demonstrate clear ordering along the stripe and further to demonstrate that positional ordering along one stripe affects the positional ordering in the neighboring stripes. At this juncture, one is approaching the ability to crystallize a material. RSA models show that this is achievable even for noninteracting particles by adjusting the nanolaminate periodicity.
Future experiments suggest two directions. The first is to develop greater ability to tune surface interactions using either surface functionalization or electrochemical drive as suggested by Fig. 1. The second is to exploit the ability to vary both the size and surface chemistry of synthetic adsorbates such as dendrimers and nanoparticles.
The controlled adsorption of molecules onto ordered arrays has enormous potential both for basic science applications as well as for commercial devices. This work demonstrates that nanolaminate templates can be made with a high degree of reliability. Substrate periods can be made in the 5 to 100 nm range, which is difficult to achieve either with natural materials or with standard lithography. Engineered substrates at this scale open the possibility of templating materials such as proteins, nanoparticles, and dendrimers.
ACKNOWLEDGMENTS
This work was performed under the auspices of the United States Department of Energy by Lawrence Livermore National Laboratory under Contract DE-AC52-07NA27344. Portions of this work were supported by the Laboratory Directed Research and Development Program (99ERD066).