Introduction
Studies of visual ecology have established that the photic environment affects the spectral tuning properties of the visual pigments in aquatic mammals, with the wavelength of maximum absorbance (λ max) often being tuned to the spectral energy distribution of the lights reaching them through the water (Lythgoe & Dartnall, Reference Lythgoe and Dartnall1970; McFarland, Reference McFarland1971; Lythgoe & Partridge, Reference Lythgoe and Partridge1989). These early works have shown that the rod visual pigments of cetaceans and pinnipeds have a much wider range in their λ max values than those of terrestrial mammals. Unlike terrestrial mammals, whose rod pigments absorb maximally around 500 nm, marine mammals have rod pigments that vary in their absorption maxima from 480 to 505 nm (Lythgoe & Dartnall, Reference Lythgoe and Dartnall1970; McFarland, Reference McFarland1971; Lavigne & Ronald, Reference Lavigne and Ronald1975; Piggins et al., Reference Piggins, Muntz and Best1983; Fasick et al., Reference Fasick, Cronin, Hunt and Robinson1998; Fasick & Robinson, Reference Fasick and Robinson1998, Reference Fasick and Robinson2000; Newman & Robinson, Reference Newman and Robinson2005).
The spectral tuning properties of visual pigments are due primarily to interactions between amino acids within the transmembrane region of the opsin protein and the chromophore, 11-cis retinal. Previous investigations of the wavelength modulation in vertebrate visual pigments have shown that most of the amino acid changes affecting λ max involve either a gain or loss of a hydroxyl group or a change in charge (Zhukovsky & Oprian, Reference Zhukovsky and Oprian1989; Nathans, Reference Nathans1990; Nakayama & Khorana, Reference Nakayama and Khorana1991; Chan et al., Reference Chan, Lee and Sakmar1992; Merbs & Nathans, Reference Merbs and Nathans1993; Chang et al., Reference Chang, Crandall, Carulli and Hartl1995). Blueshifted visual pigments tend to have charged or polar amino acid substitutions in the region of the protonated Schiff base, preferentially stabilizing the ground state of the chromophore over the excited state (Mathies & Stryer, Reference Mathies and Stryer1976).
Similarities between rod visual pigment λ max values from deep-foraging marine mammals and deep-dwelling fishes have previously been established (Lythgoe & Dartnall, Reference Lythgoe and Dartnall1970; McFarland, Reference McFarland1971). More recent studies have described the molecular mechanisms underlying these wavelength modulations, first identified in deep-dwelling fish (Hunt et al., Reference Hunt, Fitzgibbon, Slobodyanyuk and Bowmaker1996) and later described in the cetaceans (Fasick & Robinson, Reference Fasick and Robinson1998, Reference Fasick and Robinson2000) involving the amino acid substitutions at positions 83, 292, and 299. The absorbance maximum of the Atlantic bottlenose dolphin (Tursiops truncatus) rod visual pigment (λ max = 488 nm) is significantly blueshifted relative to the rod visual pigments from terrestrial mammals. A mutagenesis study in the bovine rod visual pigment in which three amino acids were substituted with the corresponding dolphin rod visual pigment residues (83Asp → 83Asn, 292Ala → 292Ser, and 299Ala → 299Ser) resulted in a blueshift from the wild-type bovine rod λ max of 499 to 488 nm, the latter value being identical to the wild-type dolphin rod λ max (Fasick & Robinson, Reference Fasick and Robinson1998). Thus, these three amino acid substitutions describe completely the wavelength modulation between the cetacean and bovine rod visual pigments.
Less is known about the rod visual pigments from the mysticete whales. McFarland determined that the rod visual pigment from the gray whale (Eschrichtius robustus) has a λ max of 497 nm, while that from the humpback whale (Megaptera novaeangliae) has a λ max of 492 nm (McFarland, Reference McFarland1971). The absorbance spectrum of the rod visual pigment from E. robustus is slightly blueshifted when compared to those from terrestrial mammals and correlates well with the shallow coastal photic environment in which this species lives (McFarland, Reference McFarland1971). The absorbance spectrum of the rod visual pigment from M. novaeangliae, however, is intermediate to the rod visual pigments of E. robustus and the odontocetes. An examination of the dive profiles from two foraging M. novaeangliae individuals showed dive depths with lunge feeding occurring around 150 m (Goldbogen et al., Reference Goldbogen, Calambokidis, Croll, Harvey, Newton, Oleson, Schorr and Shadwick2008), although M. novaeangliae has been known to dive to depths of 1000 m (Norris, Reference Norris and Anderson1969). Although E. robustus and M. novaeangliae possess rod visual pigments with different λ max values, the visual pigments from these two species are well adapted to the available light found at their respective foraging depths.
Because of the frequent lack of fresh retinal tissues, direct absorbance measurements of marine mammal visual pigments are often times difficult. An alternative strategy to directly measuring the absorbance spectrum of a visual pigment is to estimate or to predict the spectrum. This estimate begins with the identification of the amino acids found at critical positions that greatly influence the pigment’s absorbance maximum (see Yokoyama, Reference Yokoyama2008, for review). We can then estimate the absorbance maximum for any visual pigment from a directly expressed pigment that shares the same amino acids at these positions, with the provision that the pigment is of the same class utilizing the same chromophore. A recent study of the North Atlantic right (Eubalaena glacialis) whale estimated the rod visual pigment to have a λ max = 499 nm based on the amino acids occurring at position 83, 292, and 299 deduced from sequence analysis of exons 1 and 4 from genomic DNA (Fasick et al., Reference Fasick, Bischoff, Brennan, Velasquez and Andrade2011). Although recent efforts have been made to better understand the spectral sensitivities of the right whale, to date, only 3 of the 15 known extant mysticete species have been examined either directly (McFarland, Reference McFarland1971) or by estimates derived from genomic analysis (Fasick et al., Reference Fasick, Bischoff, Brennan, Velasquez and Andrade2011).
In this study, we have examined the rod visual pigments from 11 mysticete species by first identifying the amino acids occurring at positions 83, 292, and 299 in each species and subsequently providing λ max estimates based on directly determined λ max values from expressed rod visual pigments possessing identical amino acids at these three positions. We have been fortunate in acquiring fresh retinal tissue from a single Eub. glacialis individual from which we have been able to clone, sequence, and express the first mysticete rod visual pigment. Our results show that members of the families Balaenidae and Eschrichtiidae possess estimated rod pigment λ max values similar to that determined from Eub. glacialis. Surprisingly, most of the members of the family Balaenopteridae possess rod visual pigments similar to that identified in T. truncatus with estimated λ max values of 484 nm, while the single species, pygmy right whale (Caperea marginata), representing the family Neobalaenidae possesses a rod visual pigment similar to that identified in Sowerby’s beaked whale (Mesoplodon bidens) with an estimated λ max of 479 nm. These results demonstrate for the first time that pelagic and deep-sea rod visual pigments, previously thought to be found in only the odontocete species, are also present in the majority of the mysticete species.
Materials and methods
Identification of deduced amino acid substitutions from mysticete whale genomic DNA
Genomic DNA samples from two individuals for each species, except where noted, were obtained from the National Marine Fisheries Service, Southwest Fisheries Science Center. Examined whale species were: Family Balaenopteridae: Bryde’s (Balaenoptera edeni), sei (B. borealis), blue (B. musculus), humpback (M. novaeangliae), fin (B. physalus), and common minke (B. acutorostrata); Family Eschrichtiidae: gray (E. robustus); Family Neobalaenidae: pygmy right (C. marginata); Family Balaenidae: Pacific right (Eubalaena australis, one individual), bowhead (Balaena mysticetus). The sperm whale (Physeter macrocephalus, one individual), an odontocete, was also examined for comparison. Genomic DNA samples were diluted to 25 ηg/μl in filter-sterilized distilled water for subsequent polymerase chain reaction (PCR) amplifications. Amino acids at positions 83, 292, and 299 from mysticete rod opsin genes were inferred from sequenced PCR products resulting from the amplification of genomic DNA within conserved regions of exon 1 and exon 4. Oligonucleotide primers were constructed based on the consensus sequence of aligned cetacean and bovine rod opsin complimentary DNA (cDNA) sequences [National Center for Biotechnology Information (NCBI) IDs: common dolphin (Delphinus delphis, AF055314), bottlenose dolphin (T. truncatus, AF055456), Sowerby’s beaked whale (Mes. bidens, AF055316), long-finned pilot whale (Globicephala melas, AF055315), and domestic cow (Bos taurus, K00502)]. The exon 1 upstream sense degenerate oligonucleotide primer containing position 83 was 5’-ATGAAYGGGACGGARGGCCTGAACT-3’, and the exon 1 downstream antisense oligonucleotide primer was 5’-CGCCCAGGGTGGCAAAGAAGCCCTC-3’. The exon 4 upstream sense oligonucleotide primer containing positions 292 and 299 was 5’-GCAGCTGCCCAACAGCAGGAGTCGG-3’, and the exon 4 downstream antisense oligonucleotide primer was 5’-CTGCTTGTTCATCATGATGTAGATG-3’. Each amplification was carried out with the AmpliTaq Gold 360 Master Mix kit (Applied Biosystems, Foster, CA) and contained 25 μl AmpliTaq Gold 360 Master Mix, 22 μl filter-sterilized distilled water, 0.5 μM of each primer, and 25 ηg of genomic DNA. The thermal cycle parameters consisted of 95°C for 5 min followed by 35 cycles consisting of 95°C for 1 min, 54°C for 1 min, 72°C for 1 min with a final 8 min at 72°C.
PCR products were sequenced directly using the exon-specific primers described above. Each opsin sequence is based on consensus sequences of both the forward and reverse sequences resulting from at least two PCR products from two independent PCR amplifications from two individuals, except where noted above. Sequence alignments were made using CLC Sequence Viewer, 6.0 (CLC Bio, Cambridge, MA).
Cloning and expression of Eubalaena glacialis rod opsin
The right eye was collected from a North Atlantic right whale calf of approximately 2 years of age (NOAA Field ID# CALO 0901) that was euthanized on the east coast of Florida after stranding. The eye was stored frozen at −80°C immediately following collection. The eye was thawed on ice until soft, and the retina was subsequently dissected out. Total RNA was isolated using the RiboPure Kit (Applied Biosystems/Ambion, Austin, TX) following the manufacturer’s instructions for tissue sample preparations. First strand cDNA was generated from total RNA using an oligo dT18 primer and reverse transcriptase provided in the Reverse Transcription System kit (Promega, Madison, WI) following the manufacturer’s instructions. The coding region of the rod opsin cDNA was isolated by PCR using oligonucleotide primers designed to amplify from the initiating methionine to the stop codon. Both primer annealing regions were identified from consensus nucleotide sequences of previously published cetacean rod opsins. The upstream sense oligonucleotide primer was 5’-ATGAACGGGACGGAGGGCCT-3’; the downstream antisense oligonucleotide primer was 5’-TTAGGCAGGCGCCACCTGGC’-3’. Each amplification was carried out in a 50-μl mixture containing 0.2 μM of each primer, 2 μl of reverse transcribed single-stranded cDNA, and Amplitaq Gold master mix (Invitrogen, Carlsbad, CA). The thermal cycle parameters consisted of 95°C for 5 min followed by 35 cycles consisting of 95°C for 1 min, 54°C for 1 min, 72°C for 1 min with a final 8 min at 72°C. PCR products were cloned into pCR2.1 (Invitrogen), and recombinant clones were sequenced. Opsin cDNA sequence was based on consensus double-stranded sequences from two clones resulting from independent PCR amplifications. cDNA sequence corresponding to exons 1 and 4 were confirmed in alignments with Eub. glacialis rod opsin genomic DNA (Genbank ID: HM371331). cDNA sequence corresponding to exons 2, 3, and 5 were confirmed in alignments with genomic DNA from two North Atlantic individuals [Lab ID/Field ID: 13086/MH99-601-EG/Wellfleet, MA and Z28311/CCS-01E02/MA (Marine Mammal and Sea Turtle Genetic Archive, National Marine Fisheries Service, Southwest Fisheries Science Center, La Jolla, CA)]
Eub. glacialis rod opsin was cloned into the pMT3 expression vector (Franke et al., Reference Franke, Sakmar, Oprian and Khorana1988). The rod opsins from Eub. glacialis and the previously expressed rod opsins from T. truncatus, Mes. bidens, and domestic cow (Bos taurus) were transiently transfected into COS-1 cells using a chloroquine/DEAE-dextran-mediated transfection procedure as previously described (Nickle et al., Reference Nickle, Wilkie, Cowing, Hunt and Robinson2006) with the following modifications; transfections were performed using confluent cells in 150-mm tissue culture treated plates using 5-μg plasmid DNA per plate.
11-cis retinal was previously synthesized as reported (Xie et al., Reference Xie, Gross and Oprian2003). 1D4 antibody (Molday & MacKenzie, Reference Molday and MacKenzie1983) was bound to CNBr-activated Sepharose 4B (GE Healthcare Bioscience, Piscataway, NJ) according to manufacturer’s instructions. COS-1 cells expressing opsin, collected from five 150-mm tissue culture plates, were resuspended in phosphate buffered saline (PBS) and incubated at 4°C with 40 μM 11-cis retinal for 1 h. Upon addition of retinal, all subsequent steps were performed in a darkroom under dim red illumination to avoid retinal isomerization. Cells were solubilized in 1% (w/v) n-Dodecyl-β-D-maltoside (DDM; Calbiochem, San Diego, CA), PBS, 0.2 mg/ml phenylmethylsulfonyl fluoride for 1 h. Samples were centrifuged at 4000 × g for 10 min. Supernatant was added to 1D4 antibody-bound Sepharose beads and incubated for 1 h at 4°C. The beads were washed eight times with 0.1% DDM (w/v) in PBS, followed by four washes with 0.02% DDM (w/v), 10 mM HEPES pH 7.5, 0.2 mM MgCl2, 3 mM NaN3. Pigments were eluted at room temperature using 50 μM of a peptide corresponding to the last nine amino acids of bovine rod opsin’s C-terminal tail (sequence: TETSQVAPA) in 0.02% DDM (w/v), 10 mM HEPES pH 7.5, 0.2 mM MgCl2, 3 mM NaN3. Spectral analysis was performed using a Hitachi U-3210 dual-beam spectrophotometer (Hitachi, Tokyo, Japan) that was modified by the manufacturer for use in a darkroom.
In order to accurately determine λ max values, templates designed for visual pigments with a retinal chromophore, developed by Govardovskii et al. (Reference Govardovskii, Fyhrquist, Reuter, Kuzmin and Donner2000), were used. Data spectra were fitted successively with all template spectra with maxima from 400 to 600 nm at 1-nm intervals of λ max, and sums of squares were computed for differences between data and template at 1-nm intervals over the range where the template was above 75% of the maximum on the short-wavelength limb to 25% of the maximum on the long-wavelength limb. This procedure was followed to minimize contributions from the short-wavelength region of the data, where scattering or photoproducts distort the spectrum, and from the long stretch of very low absorption extending into the long-wavelength tail of pigment absorption. Sums of squares were corrected for the number of points included in the sum, and the template spectrum generating the minimum corrected sum of squares was taken as the best fit to the data.
Results
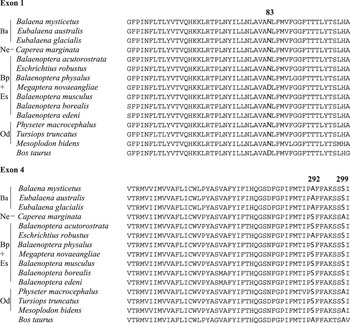
In order to estimate the dark rod visual pigment absorbance spectra and resulting λ max values from the mysticete whales, we first identified the amino acids occurring at three positions (83, 292, and 299) previously determined to be key regulators in the absorbance of cetacean rod visual pigments. This was accomplished by the PCR amplification of exon 1, encoding amino acid position 83, and exon 4, encoding amino acid positions 292 and 299, from genomic DNA samples isolated from 22 individuals representing 11 mysticete species. Fig. 1 shows sequence alignments for both exons 1 and 4 for these individuals as well as sequence from T. truncatus, Mes. bidens, and P. macrocephalus for comparisons to odontocete rod visual pigments as well as from Bos taurus for comparison to a terrestrial mammalian rod visual pigment. It is evident that the amino acid substitution 83Asn is highly conserved in all the cetaceans examined with the exception of M. novaeangliae, which possesses aspartate at this position. The amino acids occurring at position 292 are less well conserved in the mysticete species. We observed that all members of the Balaenidae and Eschrichtiidae examined possess 292Ala, while all members of the Balaenopteridae and Neobalaenidae examined possess serine at this position. Like position 83, the amino acids occurring at position 299 are well conserved. We observed that all members of the Balaenidae, Eschrichtiidae, and Balaenopteridae possess the amino acid 299Ser, while the single member of the family Neobalaenidae, C. marginata, possesses alanine at this position.
Deduced amino acid sequences of exons 1 and 4 from 11 mysticete whales after PCR of genomic DNA. Amino acids at positions 83, 292, and 299 are highlighted. Family names for the mysticetes are abbreviated to the left (Ba, Balaenidae; Ne, Neobalaenidae; Bp + Es, Balaenopteridae + Eschrichtiidae; and Od for the order Odontoceti).

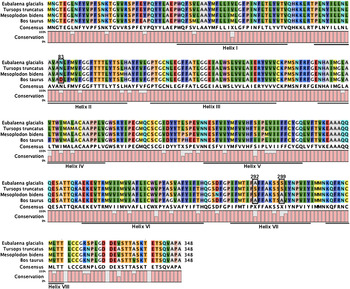
In order to estimate the absorbance spectra and resulting λ max values for the Balaenopteridae and Neobalaenidae rod visual pigments, we expressed two previously described odontocete rod visual pigments from T. truncatus and Mes. bidens (Fasick & Robinson, Reference Fasick and Robinson2000), which share identical amino acids at positions 83, 292, and 299 with members of these mysticete families. Estimating the λ max values for the Balaenidae and Eschrichtiidae rod visual pigments was accomplished by first expressing the Eub. glacialis rod visual pigment, which shares the same amino acids as the other members of these families. BLAST analysis of the amino acid sequence against the NCBI protein collection shows greatest sequence identity with the other characterized cetacean rod opsins, all of which produced the top identity scores. Clustal-W alignment against the translated amino acid sequences from the other cetacean rod opsins reveals highest sequence identity with the rod opsin from the common dolphin (97% identity). The translated amino acid sequence of the Eub. glacialis rod opsin is shown in Fig. 2 in the context of an alignment against T. truncatus, Mes. bidens, and Bos taurus rod opsins. Putative helical boundaries were determined by alignment with the known boundaries defined for the bovine rod opsin using the ground state X-ray crystal structure (Palczewski et al., Reference Palczewski, Kumasaka, Hori, Behnke, Motoshima, Fox, Le Trong, Teller, Okada, Stenkamp, Yamamoto and Miyano2000).
Deduced amino acid sequences from expressed cetacean rod opsins. The sequences are aligned with bovine rod opsin for comparison. Horizontal lines indicate transmembrane helical regions. Amino acids at positions 83, 292, and 299 are boxed. Percent conservation is determined for each amino acid position based on the amino acid present for each of the four species.

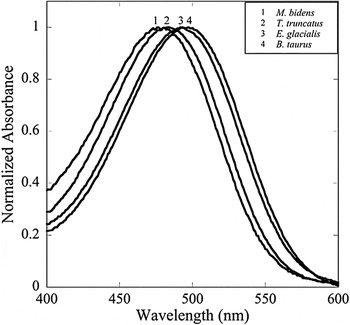
For opsin expression, the Eub. glacialis rod opsin coding sequence was subcloned into the pMT3 expression plasmid (Franke et al., Reference Franke, Sakmar, Oprian and Khorana1988) and transiently transfected into COS-1 cells. Expressed and purified rod pigments from T. truncatus, Mes. bidens, and Bos taurus have previously been published (Fasick et al., Reference Fasick, Cronin, Hunt and Robinson1998; Fasick & Robinson, Reference Fasick and Robinson1998, Reference Fasick and Robinson2000) but were expressed again for this study to control for the different cell line as well as modifications to the purification process. Upon reconstitution with 11-cis retinal and purification, the Eub. glacialis dark-adapted rod visual pigment revealed a λ max = 493 nm, while T. truncatus, Mes. bidens, and Bos taurus had λ max values of 484, 479, and 496 nm, respectively, as shown in Fig. 3. These λ max values were confirmed by fitting the dark-adapted spectra to visual pigment templates (Govardovskii et al., Reference Govardovskii, Fyhrquist, Reuter, Kuzmin and Donner2000). As seen in these side-by-side purification experiments with the odontocete and bovine rod visual pigments, the λ max value from the Eub. glacialis rod visual pigment was slightly blueshifted (−3 nm) from that of the bovine rod visual pigment and agrees with the estimated shift described in a recent study (Fasick et al., Reference Fasick, Bischoff, Brennan, Velasquez and Andrade2011). In side-by-side purifications with the odontocete rod visual pigments, the λ max value from the Eub. glacialis rod visual pigment was significantly redshifted from that of the T. truncatus (+9 nm) and Mes. bidens (+14 nm) rod visual pigments. As seen in Fig. 3, it is evident that the four absorbance spectra fall into two groups with the longer wavelength group containing the Bos taurus and Eub. glacialis absorbance spectra and the shorter wavelength group containing the T. truncatus and Mes. bidens absorbance spectra.
Normalized dark absorbance spectra of four expressed rod visual pigments: 1, Mesoplodon bidens (λ max = 479 nm); 2, Tursiops truncatus (λ max = 484 nm); 3, Eubalaena glacialis (λ max = 493 nm); and 4, Bos taurus (λmax = 496 nm).

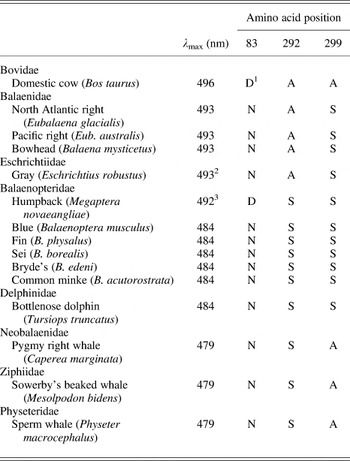
The amino acid substitutions occurring at positions 83, 292, and 299 in the rod visual pigments from 11 mysticete species, along with the λ max values resulting from dark-adapted expressed rod pigments from Eub. glacialis, T. truncatus, and Mes. bidens and their corresponding amino acid substitutions, are summarized in Table 1. These results clearly show that the estimated absorbance spectra and resulting λ max values for the mysticete species examined here are described by one of the three expressed cetacean rod visual pigments. The single exception to this is M. novaeanglieae, which possesses the unique substitutions 83Asp, 292Ser, and 299Ser and a λ max of 492 nm previously determined from difference spectra (McFarland, Reference McFarland1971). The estimated λ max value of 493 nm for the Balaenidae and Eschrichtiidae species are based on the shared amino acid identities with the expressed Eub. glacialis rod visual pigment. The estimated λ max value of 484 nm for the Balaenopteridae species is based on the shared amino acids substitutions with the expressed T. truncatus rod visual pigment, while the estimated λ max value of 479 nm for the single Neobalaenidae species, C. marginata, is based on the shared amino acids identities with the expressed Mes. bidens rod visual pigment.
Amino acid identities at positions 83, 292, and 299 from 11 mysticete rod opsins and their estimated absorbance maxima based on directly determined dark absorbance spectra

1 Single letter amino acid nomenclature: D = Aspartate, N = Asparagine, A = Alanine, S = Serine.
2 Absorbance maximum experimentally determined from difference spectrum to be 497 nm (McFarland, Reference McFarland1971).
3 Absorbance maximum experimentally determined from difference spectrum (McFarland, Reference McFarland1971).
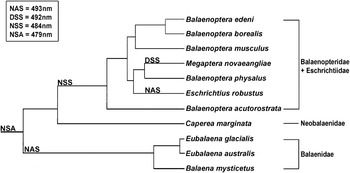
A minimum of five amino acid substitution events at sites 83, 292, and 299 have occurred in the mysticete rod opsins since the time of the most recent common ancestor (MRCA) shared with the odontocetes: two with the emergence of the Balaenidae, one with the emergence of the Balaenopteridae, one with the emergence of the Eschrichtiidae, and an additional substitution with the emergence of M. novaeangliae. Fig. 4 shows the emergence of the different amino acid substitutions for the four mysticete families mapped onto a phylogenetic tree modified from McGowen et al. (Reference McGowen, Spaulding and Gatesy2009). The MRCA of the mysticete whales is represented by P. macrocephalus, which possesses the amino acid substitutions 83Asn, 292Ser, and 299Ala and is represented by the horizontal bar at the left in Fig. 4. With the emergence of the Balaenidae, two amino acid substitutions occurred, 292Ser → 292Ala and 299Ala → 299Ser present in three species from this family, Eub. glacialis, Eub. australis, and Bal. mysticetus resulting in an estimated λ max value of 493 nm representing a 14-nm redshift in λ max relative to the MRCA. No amino acid substitutions are observed in the single species of Neobalaenidae, C. marginata, which retains the identical amino acids at positions 83, 292, and 299 as the MRCA and a corresponding estimated λ max value of 479 nm. The majority of the Balaenopteridae species examined here (B. edeni, B. borealis, B. musculus, B. physalus, and B. acutorostrata) all possess the single amino acid substitution 299Ala → 299Ser when compared to the MRCA, resulting in estimated λ max values of 484 nm representing a 5-nm redshift in λ max relative to the MRCA. The exception is M. novaeangliae, which possesses the unique amino acid substitution 83Asn → 83Asp, often found in terrestrial mammalian rod opsins, while retaining 292Ser and 299Ser observed in the other Balaenopteridae species. The M. novaeangliae rod visual pigment possesses a λ max of 492 nm, experimentally determined by McFarland (Reference McFarland1971) from difference spectra, resulting in 13 and 8 nm redshifts when compared to the MRCA and other members of the Balaenopteridae, respectively. The single species representing Eschrichtiidae, E. robustus, possesses a single amino acid substitution when compared to the members of Balaenopteridae, 292Ser → 292Ala, resulting in the same amino acid substitutions observed in the members of Balaenidae (83Asn, 292Ala, and 299Ser) and a corresponding estimated λ max value of 493 nm.
Emergence of amino acid substitutions at positions 83, 292, and 299 in 11 mysticete rod opsins. Phylogenetic tree adapted from McGowen et al. (Reference McGowen, Spaulding and Gatesy2009).

It is evident from Fig. 4 that two distinct divergence events occurred in the mysticete phylogeny regarding rod opsin amino acid substitutions and the associated spectral sensitivities observed today. The first event occurred with the emergence of the Balaenidae and the substitutions at positions 292 and 299 (83Asn, 292Ser → 292Ala, and 299Ala → 299Ser). The second event occurred with the emergence of the Balaenopteridae and the single substitution at position 299 (83Asn, 292Ser, and 299Ala → 299Ser). Two additional events in M. novaeangliae and E. robustus occurred independently and more recently with single amino acid substitutions occurring in each species.
Discussion
Various methods exist by which the absorbance spectrum of a photoreceptor or purified visual pigment can be measured, including psychophysical tests, corneal electroretinography, microspectrophotometry, as well as gene expression. These techniques, however, require either a living organism or fresh tissue from which photoreceptors can be directly measured and from which retinal messenger RNA can be extracted for expression analysis. Due to the extremely limited availability of fresh cetacean tissues, we have presented an alternative strategy that estimates visual pigment absorbance spectra by utilizing easily acquired genomic DNA and identifying the amino acids at key positions known to modulate the absorbance spectra of rod visual pigments.
In order to estimate the λ max values of the mysticete rod visual pigments, we have sequenced exons 1 and 4 from the rod opsin genes from 11 mysticete species in order to identify amino acid substitutions at positions 83, 292, and 299 known to be critical to the wavelength modulation of the absorbance spectrum. We also directly expressed cetacean rod visual pigments that shared the identical amino acid substitutions at these critical positions in order to estimate the absorbance spectra and λ max values from species where direct determinations is not currently feasible. Our results show that the mysticete whales possess a much wider range of λ max values than previously reported by McFarland (Reference McFarland1971).
We can place the mysticete rod visual pigments into three general categories; surface, pelagic, or deep sea, based on their estimated λ max values. As summarized in Table 1, the surface rod visual pigments possess a λ max of 493 nm and the amino acids 83Asn, 292Ala, and 299Ser as observed in the Balaenidae and Eschrichtiidae species Eub. glacialis, Eub. australis, Bal. mysticetus, and E. robustus. This λ max value is slightly blueshifted when compared to terrestrial mammalian rod visual pigments (λ max ≈ 500 nm; 496 nm as determined here), which possess the amino acids 83Asp, 292Ala, and 299Ala. The pelagic rod visual pigments possess a λ max of 484 nm, the amino acids 83Asn, 292Ser, and 299Ser as first described in the Delphinidae (McFarland, Reference McFarland1971; Fasick et al., Reference Fasick, Cronin, Hunt and Robinson1998), and are observed in the Balaenopteridae species B. musculus, B. physalus, B. borealis, B. edeni, and B. acustorostrata. The deep-sea rod visual pigments possess a λ max of 479 nm, the amino acids 83Asn, 292Ser, and 299Ala as first described in the Ziphiidae (McFarland, Reference McFarland1971; Fasick & Robinson, Reference Fasick and Robinson2000), and are observed in the Neobalaenidae species C. marginata.
The λ max values of these three different rod visual pigment classes correlate well with the documented foraging strategies and foraging depths described for several of the mysticete species examined here. The Balaenidae are skim or continuous ram filter feeders that forage on copepods and other small zooplankton while cruising through all levels of the water column from the surface to the bottom (Goodyear, Reference Goodyear1993; Winn et al., Reference Winn, Goodyear, Kenney and Petricig1995; Baumgartner & Mate, Reference Baumgartner and Mate2003; Werth, Reference Werth2004). The single Eschrichtiidae species E. robustus is a suction feeder that feeds on benthic invertebrates restricted to relatively shallow water environments (Meier et al., Reference Meier, Yazvenko, Blokhin, Wainwright, Maminov, Yakovlev and Newcomer2007; Pyenson & Lindberg, Reference Pyenson and Lindberg2011). Alternatively, the Balaenopteridae are intermittent ram or lunge feeders engulfing large volumes of water containing dense aggregations of plankton or nekton from the sea surface to depths over 500 m (Panigada et al., Reference Panigada, Zanardelli, Canese and Jahoda1999; Goldbogen et al., Reference Goldbogen, Calambokidis, Shadwick, Oleson, McDonald and Hildebrand2006, Reference Goldbogen, Calambokidis, Croll, Harvey, Newton, Oleson, Schorr and Shadwick2008, Reference Goldbogen, Calambokidis, Oleson, Potvin, Pyenson, Schorr and Shadwick2011; Nowacek et al., Reference Nowacek, Friedlaender, Halpin, Hazen, Johnston, Read, Espinasse, Zhou and Zhu2011). Extremely little is known about the single Neobalaenidae species C. marginata. Because C. marginata possesses a deep-sea rod visual pigment, we can speculate that spectral sensitivity for this visual pigment is adapted to a similar foraging environment as that utilized by Physeteridae and Ziphiidae. In this instance, we would assume that C. marginata is an extreme diver possibly foraging at depths similar to that of Ziphiidae species with documented foraging dives up to 1888 m (Tyack et al., Reference Tyack, Johnson, Soto, Sturlese and Madsen2006) or P. macrocephalus with documented foraging dives between 650 and 1330 m (Watkins et al., Reference Watkins, Daher, Fristrup and Howald1993; Watwood et al., Reference Watwood, Miller, Johnson, Madsen and Tyack2006). Although previous reports have speculated that C. marginata is indeed a deep-diving cetacean (Davies & Guiler, Reference Davies and Guiler1957), no data pertaining to dive profiles currently exist.
The 83Asp→83Asn and 292Ala→292Ser amino acid substitutions have occurred frequently during the evolution of the vertebrate rod visual pigments and have appeared on five separate occasions (four times in fish, once in mammals), causing similar functional changes each time (Yokoyama, Reference Yokoyama2008). These substitutions appear in combination within the mysticete whales as well. From Fig. 4, we can hypothesize that upon entering an aquatic photic environment, the ancestral cetacean rod opsin gene underwent adaptive evolution utilizing the amino acid substitutions found in many present-day cetaceans, 83Asp→83Asn, 292Ala→292Ser, resulting in rod visual pigments that are blueshifted relative to their terrestrial counterparts. We assume that the ancestral cetacean possessed the amino acids 83Asn, 292Ser, and 299Ala as observed in present-day Physeteridae. With the emergence of the mysticete whales, we observe secondary adaptations in the rod opsin genes in many species with redshifted spectral sensitivities relative to the ancestral pigment that are better adapted to relatively shallower foraging environments. This is observed first with the Balaenidae with two amino acid substitutions (292Ser→292Ala and 299Ala→299Ser) and the associated 14-nm redshift compared to the ancestral pigment. Interestingly, the Neobalaenidae species C. marginata possesses the identical amino acids as the ancestral pigment at positions 83, 292, and 299 associated with deep-sea rod visual pigments. Finally, with the emergence of the Balaenopteridae, there is an associated single amino acid substitution (299Ala→299Ser) and an associated 5-nm redshift compared to the ancestral pigment. Two exceptions, however, have been observed with the Eschrichtiidae and M. novaeangliae. With the emergence of the single Eschrichtiidae species, E. robustus, an additional amino acid substitution (292Ser→292Ala) has occurred resulting in a further redshift of 9 nm compared to the Balaenopteridae species and the formation of a rod visual pigment identical to those found in the Balaenidae species. During the evolution of M. novaeangliae, an additional amino acid substitution has also occurred when compared to the Balaenopteridae species. This substitution surprisingly is 83Asn→83Asp, an amino acid substitution previously only observed in terrestrial mammalian rod visual pigments, which results in a further redshift of 8 nm when compared to the Balaenopteridae species. It should be noted that both the E. robustus and M. novaeangliae absorbance spectra were determined by difference spectra, calculated from the dark-state absorbance spectrum minus the photobleached absorbance spectrum (McFarland, Reference McFarland1971). Difference spectra were generated for the four expressed rod visual pigments presented here (data not shown) resulting in λ max values that were redshifted 2 nm when compared to their respective dark spectra. If we applied this difference spectral correction to the E. robustus and M. novaeangliae spectra reported by McFarland, we estimate dark spectra λ max values of 495 and 490 nm, respectively. This corrected difference spectrum for the E. robustus rod visual pigment is in good agreement with our estimated value of λ max = 493 nm presented here, while the corrected difference spectrum for the M. novaeangliae rod visual pigment defines this species λ max as being intermediate between the Balaenidae and the Balaenopteridae, as suggested by its foraging and dive profiles.
In summary, we have examined the rod opsin genes from 11 mysticete species and have estimated their absorbance spectra and λ max values based on directly determined dark absorbance spectra combined with the identity of amino acids known to be key regulators of spectral absorbance. From this, we have determined that the majority of the mysticete species possess rod visual pigments with absorbance maxima between 479 and 484 nm, values previously only known to exist in the pelagic and extreme diving odontocete species. Finally, we have described the amino acid substitution events that have occurred with the emergence of each of the four principle mysticete families. It is our hope that this work provides new insight and understanding of the visual processes of the mysticete whales and how they have adapted to their underwater photic environments.
Acknowledgments
We acknowledge the following individuals and funding sources for the collection of the CALO 0901 eye: William McLellan, University of North Carolina Wilmington; Craig Harms, Chris Butler, and Eric Anderson, North Carolina State University Center for Marine Science and Technology; Gretchen Lovewel, National Marine Fisheries Service Beaufort Laboratory; and Susan Barco, Virginia Aquarium Stranding Response Program. Without their hard work and dedication, this work could not have begun. Live stranding response and tissue collection were completed under permit to Dr. Teri Rowles of National Marine Fisheries Service, Silver Springs, MD. We acknowledge the National Marine Fisheries Service, Southwest Fisheries Science Center, especially Kelly Robertson, for supplying us with genomic DNA from the Marine Mammal and Sea Turtle Genetic Archive (SWFSC Archive Loan #216 and #263). We thank Dr. Phyllis Robinson, Department of Biological Sciences, University of Maryland Baltimore County for supplying us with the odontocete rod opsin plasmid constructs. We thank Drs. Ernst Peebles and Mya Breitbart, College of Marine Science, University of South Florida, St. Petersburg, FL, for opening their laboratories for intersession research. Additionally, we acknowledge Dr. Daniel D. Oprian, Biochemistry Department, Brandeis University, for research support. Finally, we thank Dr. Mark Baumgartner, Biology Department, Woods Hole Oceanographic Institution, for his discussions regarding right whale biology. This work was supported by internal grants from Kean University (J.I.F.) and the Consortium for Wildlife Bycatch Reduction at the New England Aquarium under U.S. Department of Commerce NOAA Award #NA09NMF4520413 (J.I.F.). Funding for stranding response and necropsy was provided under the Right Whale Necropsy Response Contract PO #EM133F07SE333323 to Michael Moore, Woods Hole Oceanographic Institution and William McLellan, University of North Carolina at Wilmington from National Marine Fisheries Service. Additional support comes from NIH grant 2RO1EY009514 (D.D.O.). T.W.C. was supported by National Science Foundation grant IOS0721608 and by the Air Force Office of Scientific Research (FA9550-09-1-0149).