


Introduction
Ice sheets are traditionally considered to consist of slow-moving internal regions, which are drained by faster-moving outlet glaciers and ice streams, and these are considered to be separated from each other by abrupt onset regions and shear margins (Reference Alley and WhillansAlley and Whillans, 1991). It is now, however, accepted, based on synthetic aperture radar interferometry (InSAR) and modelling of depth-averaged balance velocities, that this view is simplistic, and instead there is a network of enhanced-flow tributaries which penetrate into the interior of the ice sheet for several hundred kilometres (Reference JoughinJoughin and others, 1999; Reference Bamber, Vaughan and JoughinBamber and others, 2000). This complexity within ice-sheet interiors has significant implications for understanding ice-sheet flow and stability, and this is important for determining present-day and possible future changes in behaviour.
Most work to date on enhanced-flow tributaries has been carried out on the Siple Coast ice streams of West Antarctica. Here, most enhanced-flow tributaries follow valleys in subglacial topography (Reference JoughinJoughin and others, 1999; Reference Hulbe, Joughin, Morse and BindschadlerHulbe and others, 2000). This is because here the ice is thicker, and so driving stresses, and thus internal ice deformation, are greater. However, basal motion may also contribute to flow because the decrease in pressure-melting point (pmp) under thicker ice can lead to the production of subglacial water. In addition, deformable sediments may build up in subglacial valleys and, together with water, will facilitate basal motion (Reference Anandakrishnan, Blankenship, Alley and StoffaAnandakrishnan and others, 1998; Reference BellBell and others, 1998; Reference JoughinJoughin and others, 1999). However, it is uncertain whether a similar mechanism might act in the East Antarctic ice sheet (EAIS), most of which is not grounded below sea level. Consequently, compared to the West Antarctic ice sheet (WAIS), marine sediments beneath the EAIS are unlikely to be as widespread (Reference Alley, Blankenship, Bentley and RooneyAlley and others, 1986; Reference Blankenship, Bentley, Rooney and AlleyBlankenship and others, 1986; Reference JoughinJoughin and others, 1999; Reference Studinger, Bell, Blankenship, Finn, Arko and MorseStudinger and others, 2001).
In this paper, we investigate the significance of ice thickness for the flow regime of the enhanced-flow tributaries of Bailey Ice Stream and Slessor Glacier, and demonstrate that basal roughness is an important control on flow dynamics for these flow features.
Methodology
Airborne radio-echo sounding (RES) was carried out in the upper reaches of Bailey Ice Stream and Slessor Glacier, in Coats Land, East Antarctica, during the austral summer of 2001/02. This region is characterized by an extensive network of enhanced-flow tributaries penetrating up to ∼600km into the ice sheet, as well as significant inter-tributary areas (Reference Bamber, Vaughan and JoughinBamber and other, 2000). A fuel depot and field camp were located at 78˚58.60' S, 7˚24.97' W, from which a series of flights were carried out over an area measuring 200 ×280 km2 (Fig. 1).
Base map showing Bailey Ice Stream and Slessor Glacier, with flight-lines and the field camp/fuel depot marked. The three lines along which corrected basal reflection power (BRPcorr) is investigated are indicated, and marked with thicker black lines. Background is from the RADARSAT Antarctic Mapping Project (RAMP) mosaic of Antarctica (Reference JezekJezek and RAMP Product Team, 2002). Location of base map is shown in the inset.

Approximately 5000 km of RES data were collected, at a centre frequency of 150MHz, using the British Antarctic Survey (BAS) airborne radar system, mounted on a de Havilland DHC-6 Twin Otter aircraft. Lines were flown between predetermined waypoints, and locations were recorded using two Ashtech global positioning system (GPS) receivers. At an aircraft speed of 60 ms–1 the sampling interval was 25 m, while the across-track spacing of the radar lines was 40 km. The locations of the first return samples associated with the surface and bed were identified using a semi-automatic picking process in the seismic processing package ProMAX v2003.0. Positional data were determined using the Trimble package GPSurvey. The system and procedures are described in full elsewhere (Reference Rippin, Bamber, Siegert, Vaughan and H.F.J. CorrRippin and others, 2003).
To investigate basal properties, power returns associated with the bed were determined. Previous studies have used RES power returns to differentiate between areas of frozen and unfrozen bed in Antarctica (Reference Bentley, Lord and LiuBentley and others, 1998; Reference Gades, Raymond, Conway and JacobelGades and others, 2000), and to identify the location of subglacial lakes (e.g. Reference Oswald and RobinOswald and Robin, 1973; Reference Siegert and RidleySiegert and Ridley, 1998). The power of a basal return is sensitive not only to the presence and distribution of water, but also to the thickness, porosity and distribution of a till layer, and also the roughness of the underlying bed (Reference BerryBerry, 1972, Reference Berry1973; Reference GadesGades, 1998). In West Antarctica, power returns have been analyzed and used to investigate basal conditions beneath ice streams and interstream areas. Beneath Siple Dome and Engelhardt Ice Ridge (former Ridge BC), ice has been identified which is frozen to the bed, while beneath Kamb Ice Stream (former Ice Stream C) and’Siple Ice Stream’ an unfrozen bed and the existence of either a basal layer of water or a till layer have been identified (Reference Bentley, Lord and LiuBentley and others, 1998; Reference Gades, Raymond, Conway and JacobelGades and others, 2000)
Power returns associated with the bed were determined by identifying the maximum return amplitude in a window of 50 samples (∼2 μs), immediately following the first return sample. Peak amplitudes were then converted to measurements of basal reflection power (BRP) based on known system parameters. In order to identify changes in BRP that are attributable to changes in basal conditions, the reduction of RES signal strength with path length (as a result of attenuation due to geometric spreading and absorption/reflection) must be accounted for (Reference Bogorodsky, Bentley and GudmandsenBogorodsky and others, 1985). To empirically determine the relationship between ice thickness and BRP, an investigation was carried out in an inter-tributary area (between Bailey tributary and the northern limb of Slessor tributary), where balance velocities are uniformly low and bed conditions (i.e.
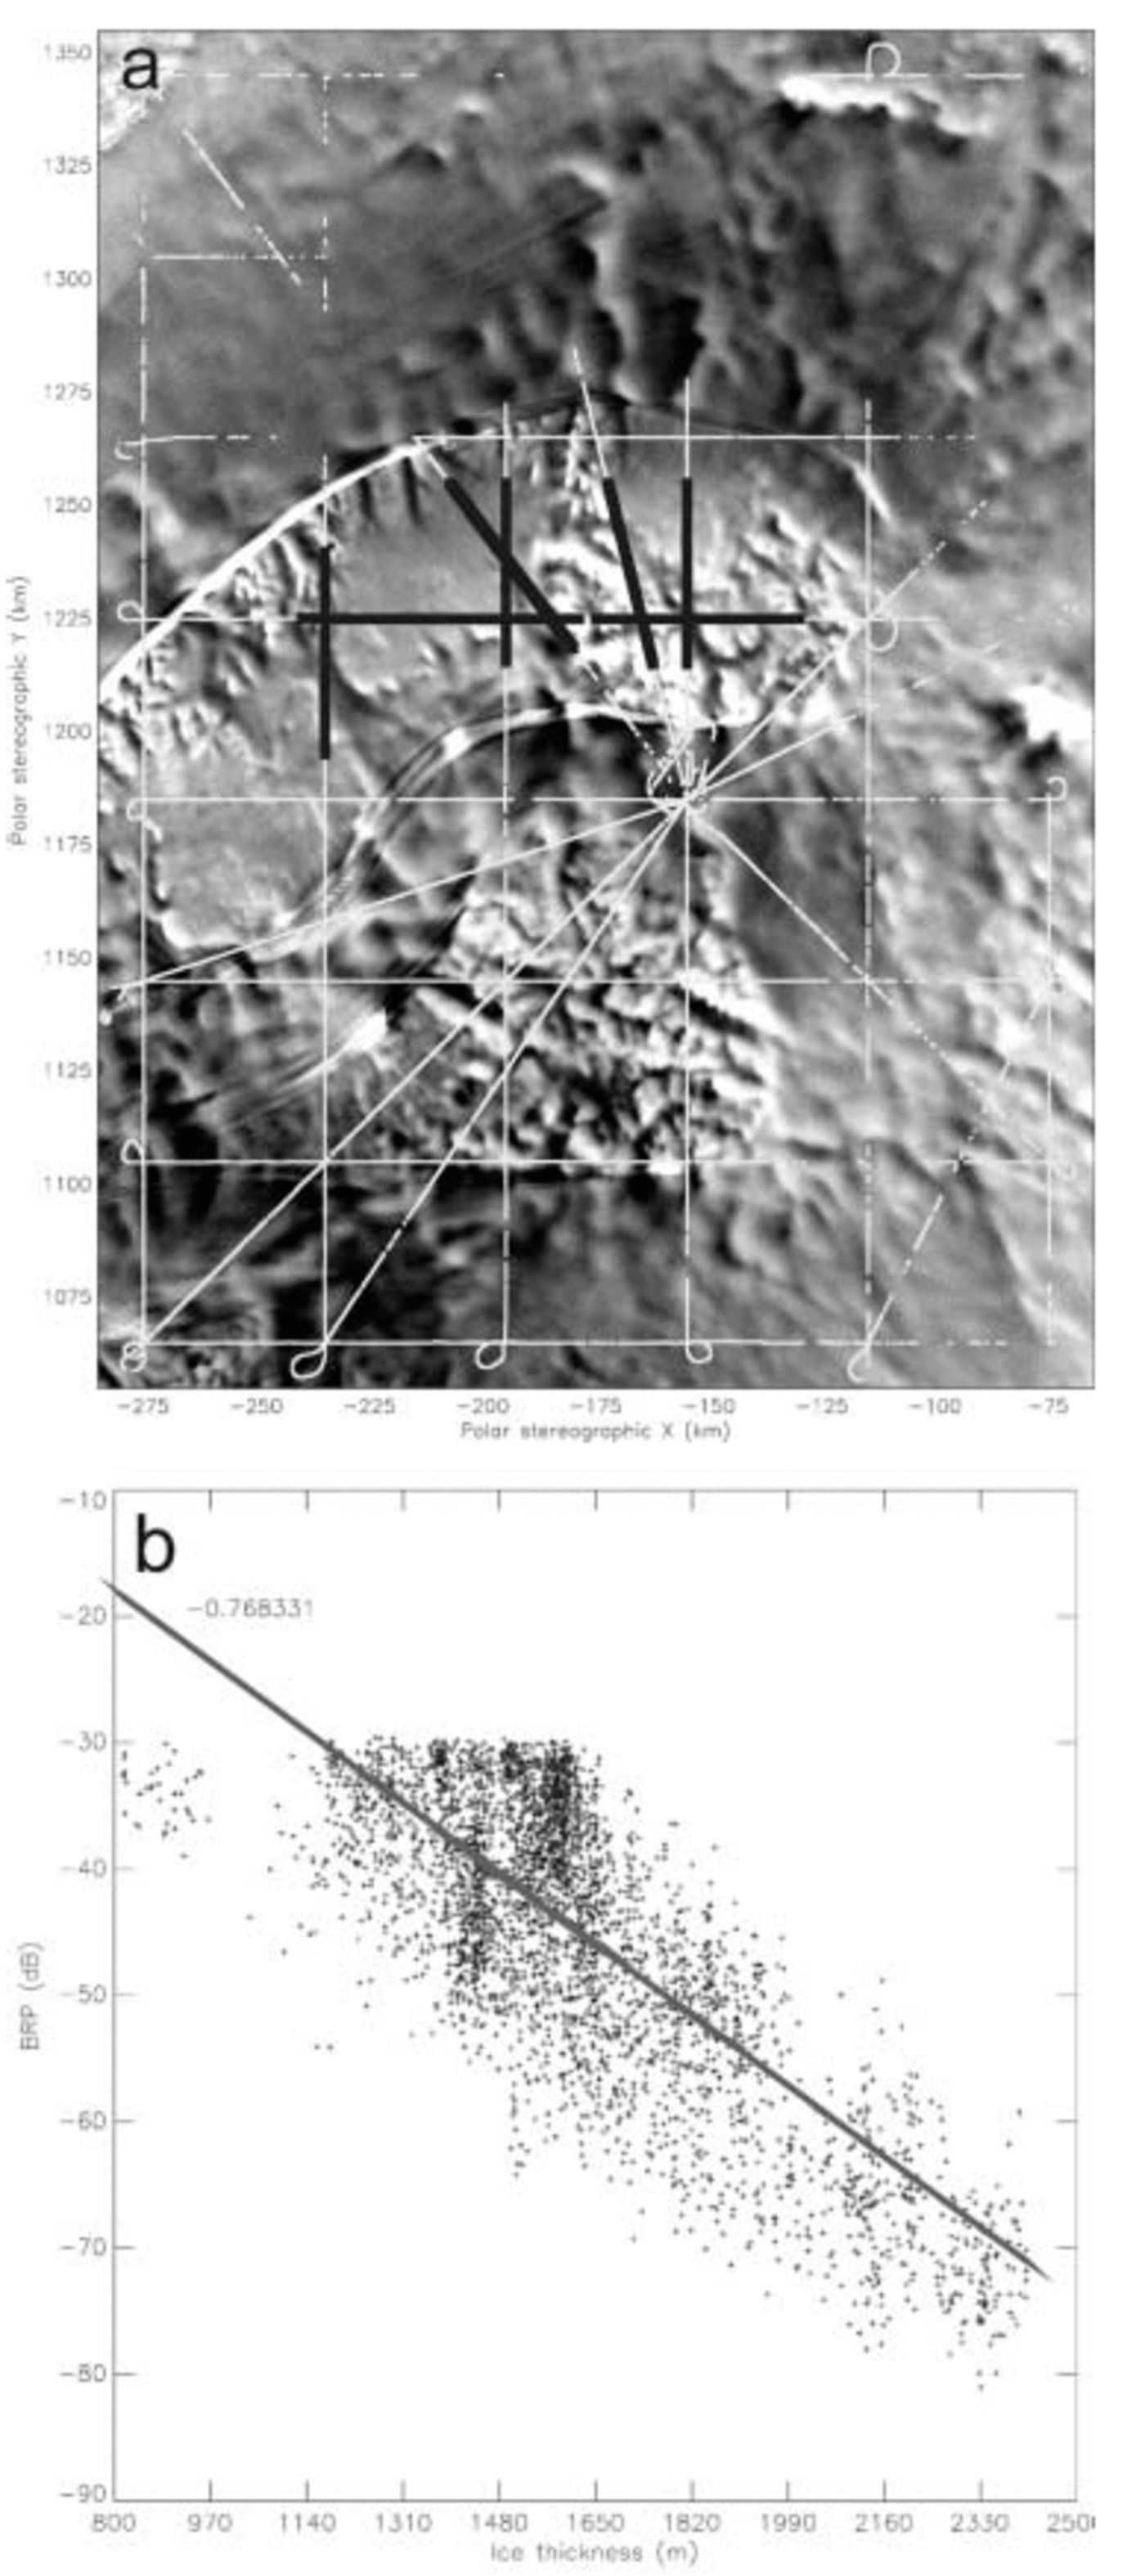
roughness and the presence of water and/or sediment) are believed to be uniform, yet where there is considerable variation in ice thickness (∼815–2411 m) (Fig. 2a). The relationship between ice thickness and measured BRP
(a) The location of points used to construct the relationship between ice thickness and BRP in the interstream area (black), as well as all RES flight-lines where bed returns were achieved (white). Background is part of the RAMP mosaic of Antarctica (Reference JezekJezek and RAMP Product Team, 2002). (b) Relationship between ice thickness and BRP in the inter-tributary area, used for calculating theoretical BRP at any given ice thickness. Fitted linear regression and correlation coefficient displayed. derived here was used to calculate a theoretical BRP at any given depth (Fig. 2b). This calculated BRP was then used to correct all data in the study area for variations in ice thickness, giving a corrected basal reflection power (BRPcorr) which is the ratio of the measured BRP to the calculated BRP (Reference Gades, Raymond, Conway and JacobelGades and others, 2000). Changes in BRPcorr across the study area are thus largely considered to be due to variations in basal properties, since the effects of ice thickness have been removed (Reference Gades, Raymond, Conway and JacobelGades and others, 2000).
Values of BRPcorr were then compared with the location of enhanced-flow features and shear margins, as identified in the RADARSAT Antarctic Mapping Project (RAMP) mosaic of Antarctica (Reference JezekJezek and RAMP Product Team, 2002), velocities derived from InSAR where available (personal communication from I. Joughin, 2002) and balance velocities. Balance velocities were calculated for the grounded part of the ice sheet from surface slope, ice thickness and mean net surface mass balance, using a two-dimensional finite-difference scheme (Reference Budd and WarnerBudd and Warner, 1996; Reference Bamber, Vaughan and JoughinBamber and others, 2000).
Results
Ice thickness
Figure 3 shows a grid of interpolated ice thickness, at a 20 ×20 km2 resolution. This grid is the difference between the surface and bed elevation grids, both of which were created from > 81 000 measurements using a kriging interpolation routine (Reference Rippin, Bamber, Siegert, Vaughan and H.F.J. CorrRippin and others, 2003).
Ice-thickness grid. Significant areas of thick and thin ice are marked as such. The flowlines associated with Bailey (top), Slessor-north (middle) and Slessor-south (bottom) are also shown by thick black lines. Gridcell resolution is 20 km, and contours are in metres.

The ice-thickness map shows that there are two major areas of thick ice (> 2800 m), named ‘thick-1’ and ‘thick-2’ (Fig. 3). Thick-1 is located to the northwest of the region, and thick-2 to the southeast (Fig. 3). Thick-2 also extends around an area of thin ice (named ‘thin-3’) in two distinct limbs (named ‘limb-north’ and ‘limb-south’). Ice within these limbs is ∼2000–2400m thick. In addition to thin-3 in the south, there are two other areas of thin ice (named ‘thin-1’ and ‘thin-2’). Most notably, thin-2 is a large elongate feature which separates thick-1 from limb-north. Finally, thin-1 is located to the far northwest of the study area, adjacent to thick-1 (Fig. 3). Our new ice-thickness data are, on average, ∼164m (∼4.2% of mean ice thickness) greater than in the BEDMAP database (Reference Lythe, Vaughan and ConsortiumLythe and others, 2001), where existing coverage over the region was relatively sparse. In some regions, however, the discrepancy is much greater (Reference Rippin, Bamber, Siegert, Vaughan and H.F.J. CorrRippin and others, 2003).
Basal reflection power
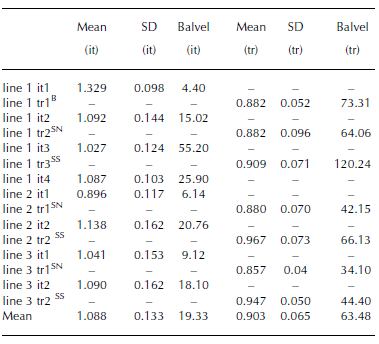
Figures 4–6 show plots of BRPcorr along three transects across the study area, running approximately north–south. These figures show how BRPcorr varies within enhanced-flow tributaries and inter-tributary areas (based on the margins visible in the RAMP mosaic), and how balance velocities vary along these lines (cf. Fig. 1). Table 1 summarizes the BRPcorr and the standard deviation (SD) of BRPcorr in each tributary and inter-tributary area, as well as the mean balance velocities in each region.
Mean and standard deviation (SD) of BRPcorr in a number of inter-tributary (it) and tributary (tr) regions along three transects (lines 1–3) running approximately north–south across the Bailey– Slessor onset region. Mean balance velocities (Balvel) within these regions are also shown (m a–1). The suffix B in column 1 indicates that this tributary is part of Bailey Ice Stream, the suffix SN indicates it is part of Slessor-north, while SS indicates it is part of Slessor-south
(a) Corrected basal reflection power (BRPcorr) (grey dots) and balance velocities (thick black line) along line 1. (b) Location of line 1 (horizontal black line), overlying RAMP mosaic (Reference JezekJezek and RAMP Product Team, 2002). Dotted vertical lines in (a) and (b) divide each plot into tributary (tr) and inter-tributary (it) areas.

Same as Figure 4, but along line 2.

Same as Figure 4, but along line 3.

Although the mean BRPcorr is similar in both inter-tributary and tributary regions, it is generally slightly higher in inter-tributary areas (Table 1). More clear, however, is the difference in standard deviation (SD) of BRPcorr, which is significantly greater in inter-tributary than in tributary areas. The mean SD in tributary areas is 0.065, while the mean SD in inter-tributary areas is 0.133, more than twice as much. Mean balance velocities are also three times higher in tributary areas (63.48ma–1) than in inter-tributary areas (19.33ma–1).
With respect to individual enhanced-flow tributaries, there are three measurements for Slessor-north (Table 1). All of these give very similar BRPcorr values, despite the decreasing balance velocity with distance up-tributary. There is only one measurement for Bailey Ice Stream, but this is also very similar to the Slessor-north values. The three Slessor-south values are all higher than those for Bailey Ice Stream and Slessor-north, although the measurement close to where the two Slessor tributaries join (line 1, tributary 3) is more similar to the Slessor-north values (Table 1).
Discussion
Figure 7 shows InSAR and balance velocities overlying gridded ice thickness. InSAR data are not available for the whole area, and although balance velocities are qualitatively similar, the precise location of tributaries, and velocity magnitudes differ slightly.
Both balance velocities and InSAR velocities indicate that Bailey Ice Stream tributary and the two Slessor Glacier tributaries are associated with thicker ice (thick-1, limb-north and limb-south respectively), while areas of thinner ice occur in inter-tributary areas (Fig. 7; cf. Fig. 3). This clear correspondence between thicker ice and enhanced-flow tributaries is not surprising, since ice deformation is greater in thicker ice. However, since thicker ice also results in a lowering of the pmp at the bed, increased basal melting is possible, so enhanced basal motion may also be at least partly responsible for increased flow velocities.
In order to investigate the relative significance of ice deformation and basal motion, a simple model was employed in which longitudinal and shear stresses are ignored, and all flow is resisted by basal drag (Reference NyeNye, 1952; Reference GlenGlen, 1955; Reference Van der VeenVan der Veen, 1999). Under such conditions, the velocity which results from ice deformation within the ice column (du) is expressed as:

where A is the flow-law parameter, n is the flow-law exponent (3), ρ is the mean density of ice (917 kg m–3), g is gravity (9.81 ms–2), α is the surface slope, z is the elevation of a point within the ice column (equal to 0 at the bed, and h at the surface), dz is the thickness of a layer of ice (Reference HutterHutter, 1983; Reference PatersonPaterson, 1994) and E is an enhancement factor, equal to 8 in the tributaries (where accumulated strain results in crystal alignment and fabric softening) and 1 in the inter-tributary area (Reference Jacka and BuddJacka and Budd, 1989; Reference Van der Veen and WhillansVan der Veen and Whillans, 1990). The total amount of deformation occurring is calculated by dividing the ice column into 100 equal thickness layers, and integrating throughout the depth.
(a) Balance velocities (m a–1) (black) contoured over gridded ice thickness (m) (grey-scale). (b) InSAR velocities (m a–1) (black) contoured over gridded ice thickness (m) (grey-scale).

The temperature profile throughout the ice column is unknown. This is of concern, however, since the flow-law parameter A is taken to be a function of temperature and is the most significant unknown in the calculation (Reference PatersonPaterson, 1994). A vertical temperature profile was thus constructed based on the work of Reference RobinRobin (1955; cf. Reference Van der VeenVan der Veen, 1999). Reference Takeda and PayneTakeda and others (2002), using large-scale modelling, have shown that large parts of the bed in this region are at the pmp. Under an ice thickness of ∼2290 m, a pmp of –1.33˚C was calculated (Reference PatersonPaterson, 1994). A surface temperature of –35˚C was also used (Reference Giovinetto, Waters and BentleyGiovinetto and others, 1990), and these limits were used to construct a temperature profile, which was in turn used to determine values of the flow-law parameter A.
Figure 8 shows the percentage of total motion which can be explained by ice deformation. Total motion was determined from InSAR velocities where they were available, and balance velocities (recalculated using the new ice-thickness data and calibrated to InSAR velocities where there is overlap) elsewhere (Reference Rippin, Bamber, Siegert, Vaughan and H.F.J. CorrRippin and others, 2003). In inter-tributary areas, the majority of flow is due to ice deformation. Similarly, most of the flow of the Slessor tributaries occurs by deformation, but basal motion must be invoked to explain 50–70% of flow in Bailey tributary (Fig. 8).
Percentage of total velocity due to ice deformation (grey-scale), with combined InSAR velocities and recalculated, calibrated balance velocities (m a–1) overlain (black contours).

The investigations of BRPcorr indicate that there is a difference in basal conditions beneath the tributaries, as compared with the inter-tributary areas. Although values of BRPcorr are generally higher in inter-tributary areas, caution needs to be exercised in interpreting these results because of possible variations in englacial properties and spatial variations in attenuation (despite efforts to remove the effects of ice thickness). However, it is significant that all measurements of BRPcorr in Bailey and Slessor-north (as well as in Slessor-south, near the convergence with Slessor-north) are very similar, suggesting compatible basal conditions beneath these tributaries, which perhaps differ from conditions beneath much of Slessor-south (as well as, of course, inter-tributary areas). More interesting, however, and more conclusive, is the relative variability (SD) of BRPcorr, which is unrelated to ice thickness and is twice as high in inter-tributary areas as in tributary areas (Fig. 4–6; Table 1). This difference implies that, at the scale of the radio wavelength in ice (∼1.12 m), the bed in inter-tributary areas is rougher than in the tributaries. Such an observation supports the suggestion that there may be significant basal motion within the enhanced-flow tributaries (particularly Bailey), as compared with the inter-tributary areas, since a smoother bed within the tributaries implies fewer obstacles to sliding (perhaps as a result of erosion of obstacles and infilling of gaps between obstacles by sediment), and/or the presence of basal water.
Conclusions
A new map of ice thickness was produced for the Bailey/Slessor region of East Antarctica, from an airborne RES survey. This map indicates that the enhanced-flow tributaries of Bailey Ice Stream and Slessor Glacier are coincident with significantly thicker ice than the surrounding, slower-moving areas. A numerical modelling study indicates that virtually all flow within the slow-moving inter-tributary regions can be explained by ice deformation, as indeed can the majority of flow in the Slessor tributaries. However, a large proportion of the flow of Bailey enhanced-flow tributary is dominated by basal motion. This conclusion is supported by less variable BRPcorr values within this tributary, which are interpreted as indicating a smoother bed. In contrast, the slower-moving inter-tributary areas are characterized by a much rougher bed. The Slessor tributaries are also characterized by a smoother bed, despite much of their flow being explained by ice deformation. It is possible that the relatively high enhancement factor used overestimates the significance of deformation here, and that some basal motion does occur. However, the use of a high enhancement factor puts a maximum bound on the amount of ice deformation occurring, and gives increased confidence that the residual basal motion in Bailey is real.
As in the Siple Coast ice streams of West Antarctica, enhanced-flow tributaries exist where ice is thicker, and are thus focused along subglacial topographic lows. Elevated velocities in the Bailey enhanced-flow tributary (and perhaps Slessor), however, are not purely a result of increased ice deformation, but are also due to increased basal motion. The precise mechanisms are difficult to determine, but it is likely that significant feedback mechanisms operate, whereby the pmp at the bed is reduced beneath thicker ice, and so there is an increased concentration of warmer ice, and thus liquid water, in these topographic lows. The resulting elevated sliding velocities will lead to increased erosion rates, which will accentuate the topographic troughs in which they lie and reduce bed roughness, and could provide the sediment required to create a deformable substrate (Reference BellBell and others, 1998). Since ∼36 Myr BP, when the whole of East Antarctica was largely buried beneath ice (Reference Ehrmann and MakensenEhrmann and Mackensen, 1992), a
significant subglacial layer could accumulate, sufficient to act as a lubricating basal till. The resultant enhanced velocities mean increased basal melting and more erosion, further increasing velocities.
Acknowledgements
This work was supported by UK Natural Environment Council grant GR3/AFI2/65. Antarctica fieldwork was made possible by the British Antarctic Survey (BAS) Administration and Logistics Division. Particular thanks are owed to D. Leatherdale, P. Jones and P. Woodroffe for assistance in the field. We are grateful to I. Joughin for providing InSAR velocity data, and to the editor, T. H. Jacka, and two referees, whose comments helped to improve this paper.



