I. INTRODUCTION
Alloying, by definition, describes minor addition of one or more elements, viz., solutes to a primary metal acting as the solvent to achieve a solid solution with enhanced mechanical properties. In 2004, with the advent of the concept of high-entropy alloys (HEAs),Reference Yeh, Chen, Lin, Gan, Chin, Shun, Tsau and Chang1–Reference Cantor, Chang, Knight and Vincent3 a new alloying strategy was established that instead of comprising a primary solvent metal and one or more solutes is composed of four or five elements present in equiatomic or near-equiatomic concentrations. In other words, HEAs as solid solutions stand distinct from conventional alloys in terms of absence of a primary solvent metal.Reference Praveen and Kim4 As per conventional physical metallurgy and existing phase diagrams, the above-mentioned alloying design of HEAs would be expected to result in the formation of intermetallic phases. However, the possibility of retaining solid solution characteristics in these multicomponent alloys (MCAs) stems from the concept of entropic stabilization, wherein the large number of elements would raise the configuration entropy and simultaneously reduce the free energy of the mixture, in particular at higher temperatures.Reference Yeh, Chen, Lin, Gan, Chin, Shun, Tsau and Chang1,Reference Pickering and Jones5–Reference Gao, Zhang, Gao, Zhang, Ouyang, Widom and Hawk9 On the basis of configurational entropy values, HEAs are categorized as alloys with a value of 1.5R [where R is the gas constant given as 8.314 J/(K mol)] compared to a value of 1R for low entropy or conventional alloys.Reference Zhang, Liaw and Zhang10,Reference Carroll, Lee, Tsai, Yeh, Antonaglia, Brinkman, LeBlanc, Xie, Chen, Liaw and Dahmen11 Owing to the general definition of HEAs and the underlying potential to unlock a vast elemental composition space, they have attracted increasing attention over the last decade,Reference Yeh, Chen, Lin, Gan, Chin, Shun, Tsau and Chang1,Reference Cantor, Chang, Knight and Vincent3,Reference Miracle and Senkov6,Reference Yeh12–Reference Gali and George24 offering opportunities for designing novel materials possessing properties superlative to those exhibited by conventional alloys. This is evidenced by the vast repository of reports, several reviews,Reference Pickering and Jones5–Reference Miracle7,Reference Zhang, Liaw and Zhang10,Reference Yeh13,Reference Diao, Feng, Dahmen and Liaw20,Reference Zhang, Zuo, Tang, Gao, Dahmen, Liaw and Lu25–Reference Tsai and Yeh27 and two booksReference Gao, Yeh, Liaw and Zhang15,Reference Murty, Yeh and Ranganathan28 already published on design, structure, and properties of HEAs.
Over the past decade, most of the research in this area has been primarily influenced by four fundamental principles or core effects displayed by HEAs in comparison to conventional alloys. These four aspects, as postulated by Yeh and co-workers over several publications,Reference Yeh, Chen, Lin, Gan, Chin, Shun, Tsau and Chang1,Reference Huang, Yeh, Shun and Chen2,Reference Yeh13,Reference Yeh, Lin, Chin, Gan, Chen, Shun, Tsau and Chou14,Reference Yeh, Chen, Lin and Chen29 encompass the following:
(i) The Gibbs free energy for phase formation is dominated by the maximization of configurational entropy, thereby stabilizing solid solutions over intermetallic phases.
(ii) The atomic sizes of different constituent elements in HEAs may vary significantly leading to significant lattice strain due to the absence of a primary solvent metal.
(iii) HEAs exhibit sluggish diffusion kinetics since the interatomic bonding can fluctuate a lot due to the presence of many dissimilar metals.
(iv) The interatomic interactions in HEAs can be diverse, whereby they are expected to show unusual properties as well as a composite-like behavior. This was coined as the ‘cocktail effect’.
However, these four effects have been subject of severe debatesReference Pickering and Jones5,Reference Senkov, Miller, Miracle and Woodward23,Reference Otto, Yang, Bei and George30–Reference Jones, Frezza and Stone33 with respect to their practicality in developing HEAs. One of the seminal reviews regarding this was published by Pickering and Jones,Reference Pickering and Jones5 wherein they highlighted that experimental evidence indicate that the aforementioned core effects may not be significant in HEAs. Indeed, despite the proposed entropic stabilization effect, majority of the designed HEAs till date exist as multiphase alloys in their stable state.Reference Senkov, Miller, Miracle and Woodward22,Reference Senkov, Miller, Miracle and Woodward23,Reference Otto, Yang, Bei and George30,Reference Ma, Grabowski, Körmann, Neugebauer and Raabe34–Reference Otto, Dlouhý, Pradeep, Kuběnová, Raabe, Eggeler and George37 This is primarily owing to the complexities associated with local stress/strain distributions, local compositional fluctuations, and interatomic interactions among constituent elements under diverse thermomechanical processing schemes.Reference Rao, Diao, Ocelík, Vainchtein, Zhang, Kuo, Tang, Guo, Poplawsky, Zhou, Liaw and De Hosson19,Reference Zhang, Zuo, Tang, Gao, Dahmen, Liaw and Lu25,Reference Jones, Christofidou and Stone31,Reference Otto, Dlouhý, Pradeep, Kuběnová, Raabe, Eggeler and George37–Reference Santodonato, Zhang, Feygenson, Parish, Gao, Weber, Neuefeind, Tang and Liaw41 In fact, due to the inherent difficulty in achieving stable single-phase HEAs, many researchers have proposed alternative terminologies for these alloys such as MCAs, multiprincipal element alloys, baseless alloys, or complex concentrated alloys.Reference Praveen and Kim4,Reference Miracle and Senkov6,Reference Miracle7,Reference Senkov, Miller, Miracle and Woodward23,Reference Gorsse, Miracle and Senkov26 Consequently, a major portion of current HEA research has transitioned toward exploration of multiphase HEAs, with the focus lying upon controlling microstructural design and topological distribution of phases with respect to desired mechanical properties.Reference Rao, Diao, Ocelík, Vainchtein, Zhang, Kuo, Tang, Guo, Poplawsky, Zhou, Liaw and De Hosson19–Reference Tang, Senkov, Parish, Zhang, Zhang, Santodonato, Wang, Zhao, Yang and Liaw21,Reference Jones, Christofidou and Stone31,Reference Pickering, Stone and Jones38,Reference Pickering, Muñoz-Moreno, Stone and Jones39,Reference Deng, Tasan, Pradeep, Springer, Kostka and Raabe42–Reference He, Wang, Huang, Xu, Chen, Wu, Liu, Nieh, An and Lu49
Engineering multiphase HEAs have successfully shown that significant enhancement in structural properties over conventional steels is possible, whereby the much debated strength-ductility trade-off effect can be surpassed in these alloys.Reference Deng, Tasan, Pradeep, Springer, Kostka and Raabe42–Reference Nene, Liu, Frank, Mishra, Brennan, Cho, Li and Raabe45,Reference He, Wang, Huang, Xu, Chen, Wu, Liu, Nieh, An and Lu49 For instance, one of the relatively well-researched HEAs is the AlxCoCrFeNi system, which is known to transition from solid solution FCC to mixture of FCC and BCC phases with increasing Al content.Reference Wang, Wang, Wang, Tsai, Lai and Yeh16,Reference Basu, Ocelík and De Hosson40,Reference Rao, Ocelík, Vainchtein, Tang, Liaw and De Hosson50,Reference Rao, Ocelík, Vainchtein, Tang, Liaw and De Hosson50–Reference Ma, Jiang, Li, Wang, Dong, Liaw, Xu and Sun55 By appropriate microstructural design in the multiphase regime, development of HEAs that possess the benefits of both a ductile FCC phase along with the strength increment imparted by BCC constituent phases is potentially achievable. However, considering the multiphase HEAs to be a conglomerate of different phases (comprising phase boundaries, precipitates, spinodally decomposed phases, etc.), complex physical interactions between individual phases/elements during thermomechanical processing is an expected outcome. In this regard, it is essential to surmise the individual response of different crystal structures and phases as well as the local strain compatibility effects across interfaces between compositionally or crystallographically dissimilar phases present in these alloys.
Strengthening in materials is strongly dependent on the characteristic length scale of a microstructure, i.e., dislocations, precipitates, twins, grains, etc. Therefore, deformation characteristics at material intrinsic length scales prognose the overall bulk strength and plasticity in metallic systems.Reference Greer and De Hosson56 To optimize microstructural design in HEAs, a thorough knowledge of size-dependent deformation in these alloys is imperative. This is essential to not only correlate mechanical response with the local microstructure but also to gain greater understanding about their resistance to damage nucleation, wherein HEAs seem to outperform conventional alloys.Reference Zhang, Mao, Wang, Gludovatz, Zhang, Mao, George, Yu and Ritchie17,Reference Zou, Ma and Spolenak57–Reference Gludovatz, Hohenwarter, Thurston, Bei, Wu, George and Ritchie59
Despite a large amount of literature available on HEAs, the number of reviews exclusively encompassing microstructural design-related deformation mechanisms in HEAs is very few—e.g., reviews by Zhang et al.Reference Zhang, Zuo, Tang, Gao, Dahmen, Liaw and Lu25 and Diao et al.Reference Diao, Feng, Dahmen and Liaw20 Moreover, there is at present no review articles that consider the effect of intrinsic length scales and submicron plasticity in these alloys. In this regard, a topical review focusing on these aspects is not only timely but also brings into light another aspect of HEA research that is growing into prominence.
The content of this review will address the metal physics of small-scale deformation in these alloys that can be quite diverse owing to the complexities in the alloying chemistry. This would be useful in enhancing the reader’s understanding of structure–property relationships in HEAs from the point of view of better alloy designs as well as provide a wealth of information regarding microstructure-related deformation characteristics that are distinct compared to those observed in conventional structural materials.
II. PLASTIC DEFORMATION IN HEAs: A BRIEF OVERVIEW
HEAs have exhibited impressive mechanical properties, viz., high hardness and compressive strength both at room and elevated temperatures, as well as enhanced tensile strength and ductility.Reference Diao, Feng, Dahmen and Liaw20,Reference Zhang, Zuo, Tang, Gao, Dahmen, Liaw and Lu25,Reference Gorsse, Miracle and Senkov26 For instance, FCC-structured HEAs are known to be more ductile in nature, displaying low strengths and high plasticity, whereas BCC-structured HEAs show higher strengths and low plasticity.Reference Diao, Feng, Dahmen and Liaw20 On the basis of crystallographic structure and related mechanical behavior, the literatureReference Diao, Feng, Dahmen and Liaw20 classifies HEAs in primarily three categories, viz., Type I HEAs that typically exist as solid solution FCC. Recently, however, there have been reports that have established processing routes for development of HCP-structured HEAs.Reference Feuerbacher, Heidelmann and Thomas60–Reference Gao, Zhang, Guo, Qiao and Hawk62 However, work on their structure–property relationships is still in its nascent stages. Type II HEAs comprise mixture of crystallographically and compositionally different phases, primarily a combination of BCC and FCC structures, and in very few cases they exist as a mixture of FCC and HCP phases. This class of HEAs potentially exhibit a combination of high strength and enhanced ductility, depending on the variation in structures of the HEA. The third category or the Type III HEAs constitute mostly BCC-structured alloys typically suitable for refractory purposes. However, it must be noted that the above classification is quite ambiguous considering the fact that most single phase HEAs are metastable, wherein thermal or mechanical-induced phase transformations resulting in a multiphase microstructure (Type-II HEAs) have been reported quite often.Reference Senkov, Miller, Miracle and Woodward22,Reference Senkov, Miller, Miracle and Woodward23,Reference Otto, Yang, Bei and George30,Reference Ma, Grabowski, Körmann, Neugebauer and Raabe34–Reference Otto, Dlouhý, Pradeep, Kuběnová, Raabe, Eggeler and George37 Nevertheless, for the sake of simplicity, we stick to the aforementioned classification of HEA types in this section.
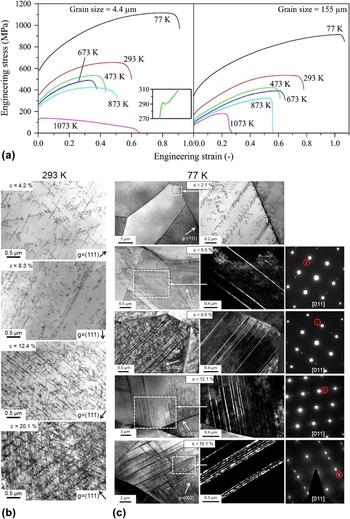
With respect to the generic deformation behavior, Type I HEAs show characteristics similar to those observed in conventional FCC metals.Reference Otto, Dlouhý, Somsen, Bei, Eggeler and George63 One of the extensively researched prototypical equiatomic HEA belonging to this category is the CoCrFeMnNi HEA, commonly referred to as the Cantor alloy. Otto et al.Reference Otto, Dlouhý, Somsen, Bei, Eggeler and George63 investigated the tensile properties of the CoCrFeMnNi HEA over 6 different temperatures (ranging from 77 to 1073 K) and found an increase in both tensile strength and ductility with decreasing temperature [see Fig. 1(a)]. The observed effect was ascribed to a transition in deformation mechanisms from planar dislocation slip [see Fig. 1(b)] to a combination of slip and nanoscale deformation twinning [see Fig. 1(c)]. In a later study,Reference Laplanche, Kostka, Horst, Eggeler and George64 strain-dependent microstructural evolution of the same HEA was investigated at room temperature and cryogenic conditions. It was shown that deformation at 293 K primarily ensued by means of planar dislocation slip on limited number of {111}-type planes [see Fig. 1(b)]. The activation of slip only on a limited set of {111}-type planes was attributed to short range ordering (SRO) effects, whereby the local Peierls stress for dislocation slip is modified on different planes belonging to the same crystallographic family.Reference Otto, Dlouhý, Somsen, Bei, Eggeler and George63,Reference Laplanche, Kostka, Horst, Eggeler and George64 As the temperature is lowered to 77 K, SRO effects are destroyed and planar dislocation slip (visible at small strains) vanishes leading to a dislocation arrangement observed in pure FCC metals.Reference Otto, Dlouhý, Somsen, Bei, Eggeler and George63,Reference Laplanche, Kostka, Horst, Eggeler and George64 Simultaneously, profuse mechanical nanotwinning driven by the generation of stacking faults bounded by  ${1 \over 6}\left\langle {112} \right\rangle$ Shockley partials is also activated [see Fig. 1(c)]. In a recent study,Reference Zhang, Zhuang, Hu, Kai and Liu65 it was proposed that the stacking fault energies in the FCC HEA can assume negative values at cryogenic temperatures, whereby the formation of twin faults becomes a spontaneous process. The twinning deformation not only contributes to ductility enhancement but also results in a dynamic Hall–Petch strengthening, by effectively fragmenting parent grains and subsequently improving work hardening rate and delaying necking.Reference Basu, Fidder, Ocelík and de Hosson66–Reference Basu, Gottstein and Zander68 Moreover, in context with HEAs, nanoscale twinning has been observed to be the key mechanism imparting unprecedented fracture toughness in these alloys at low temperatures.Reference Zhang, Mao, Wang, Gludovatz, Zhang, Mao, George, Yu and Ritchie17,Reference Gludovatz, Hohenwarter, Catoor, Chang, George and Ritchie58,Reference Gludovatz, Hohenwarter, Thurston, Bei, Wu, George and Ritchie59,Reference Zhang, Sheng, Wang, Gludovatz, Zhang, George, Yu, Mao and Ritchie69 The observed twinning-induced plasticity (TWIP) effect in FCC HEAs is also known to trigger at room temperatures under high tensile strains, during severe plastic deformation or by compositional modifications, i.e., for nonequiatomic HEAs.Reference Deng, Tasan, Pradeep, Springer, Kostka and Raabe42,Reference Laplanche, Kostka, Horst, Eggeler and George64,Reference Haase and Barrales-Mora70,Reference Schuh, Mendez-Martin, Völker, George, Clemens, Pippan and Hohenwarter71 Lately, it has been shown that for nonequiatomic compositions of FCC–HEAs’ dynamic transformation-induced plasticity (TRIP) behavior can be triggered, wherein the FCC phase partially transforms into an HCP phase.Reference Li, Tasan, Pradeep and Raabe43,Reference Li, Pradeep, Deng, Raabe and Tasan44
Engineering stress–strain curves of the CoCrFeMnNi HEA at different test temperatures for two different grain sizes: (a) 4.4 µm and (b) 155 µm (reprinted with permission from Ref. Reference Otto, Dlouhý, Somsen, Bei, Eggeler and George63); Transmission electron micrographs of strain-based evolution of the CoCrFeMnNi HEA (c) at 293 K showing planar {111}-dislocation slip giving rise to banded morphology and (c) at 77 K indicating profuse twinning, from left to right are bright field images, dark field images, and corresponding SAD patterns showing diffraction spots from the twin and matrix. Reproduced with permission from Ref. Reference Laplanche, Kostka, Horst, Eggeler and George64 (Acta Mater., 2016).

Belonging to the other end of the spectrum are the Type III BCC refractory HEAs. One of the most commonly examined HEAs in this category is the HfNbTaTiZr alloy. Couzinié et al.Reference Couzinié, Lilensten, Champion, Dirras, Perrière and Guillot72 performed TEM investigations on equiatomic HfNbTaTiZr HEAs at different plastic strains. They observed that deformation in this alloy is primarily carried out by screw dislocations that are arranged in the form of bands [see Fig. 2(a)], described by a Burgers vector  ${\bi{b}} = \pm {a \over 2}\left[ {111} \right]$ and
 ${\bi{b}} = \pm {a \over 2}\left[ {1\bar{1}1} \right]$. At very low strains, the defect distribution is quite heterogeneous, with the screw dislocations either existing as long straight lines or forming jog and kink configurations. Furthermore, dislocations with opposite Burgers vector tend to form dipoles or loops. The formation of such defect configurations severely limit the mobility of screw dislocations and result in the dislocations possessing a complex structure. Additionally, the higher Peierls stress associated with BCC-structured materials further abates the mobility of 〈111〉 dislocations.Reference Couzinié, Lilensten, Champion, Dirras, Perrière and Guillot72–Reference Dirras, Lilensten, Djemia, Laurent-Brocq, Tingaud, Couzinié, Perrière, Chauveau and Guillot74 As the strain increases, the dislocation density rises with the defect distribution separating into hard (more dislocation clusters and forest configurations) and soft zones. At even higher strains (∼10%), the deformation structure becomes more homogeneous with the generation of dislocation cell walls and low angle boundaries. Similar strain-dependent dislocation characteristics were reported for the B2-BCC Al28Co20Cr11Fe15Ni26 HEA.Reference Feuerbacher75 In a separate study, Senkov et al. reported the appearance of deformation twin and shear band-like structures during room temperature deformation of the HfNbTaTiZr HEA [see Fig. 2(b)], while none was observed for the MoNbTaW BCC–HEA.Reference Senkov, Scott, Senkova, Meisenkothen, Miracle and Woodward76 Like for FCC–HEAs, tailoring compositions of refractory BCC–HEAs have shown the activation of the TRIP effect in these materials, whereby a dynamic phase transformation from BCC to HCP results in combined strength and ductility enhancement.Reference Lilensten, Couzinié, Bourgon, Perrière, Dirras, Prima and Guillot77
(a) Transmission electron micrograph of dislocation patterning (forming criss-cross bands) in the BCC HfNbTaTiZr HEA at a plastic strain of 0.85%, dislocation Burgers vector defined as  $b = {a \over 2}\left\langle {111} \right\rangle$ [observation plane is (001)], image reprinted with permission from Ref. Reference Couzinié, Lilensten, Champion, Dirras, Perrière and Guillot72; (b) appearance of shear bands and twins in the BCC HfNbTaTiZr HEA. Reproduced with permission from Ref. Reference Senkov, Scott, Senkova, Meisenkothen, Miracle and Woodward76 (J. Mater. Sci., 2012).

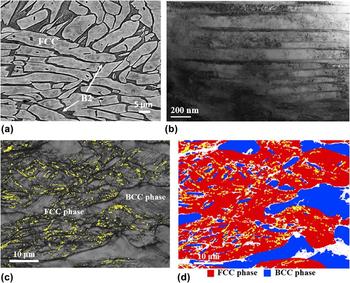
Type II HEAs theoretically encompass the multiphase alloys that constitute both crystallographic as well compositionally dissimilar phases. The most common example being the AlxCoCrFeNi (where 0.5 < × < 0.8) alloy existing as a mixture of BCC and FCC phases. The BCC phase is further known to decompose into compositionally ordered (B2) and disordered (A2) phases.Reference Rao, Ocelík, Vainchtein, Tang, Liaw and De Hosson50,Reference Ma, Jiang, Li, Wang, Dong, Liaw, Xu and Sun55 Deformation behavior in these alloys is the combination of that observed in conventional FCC and BCC metals. Joseph et al.Reference Joseph, Stanford, Hodgson and Fabijanic78 performed tensile and compression tests on AlxCoCrFeNi (where x = 0.3, 0.6, and 0.85), wherein it was reported that deformation in the FCC grains ensued by the combination of dislocation slip and mechanical twinning (see Fig. 3). On the other hand, strain accommodation in the BCC grain took place by pure dislocation slip on the {110} and {112} planes (see Fig. 3). With respect to stress/strain partitioning between the two crystallographic phases, it was reported that the FCC grains are the first to yield and the majority of the applied stress is borne by the harder BCC grains leading to a composite load bearing effect. Moreover, the overall strength and hardening rate of this alloy is strongly dependent on the spatial arrangement as well as the morphology of the constituent phases.
(a) Scanning electron microscopy (SEM) micrographs of compression deformed Al0.6CoCrFeNi HEA to a true strain of 0.48; (b) TEM image of dislocation activities and mechanical twins in the FCC phase; (c) EBSD image quality map with twin boundaries shown in yellow; and (d) phase map with FCC in red and BCC in blue. Reproduced with permission from Ref. Reference Joseph, Stanford, Hodgson and Fabijanic78 (J. Alloys Comp., 2016).

III. SIZE-DEPENDENT PLASTICITY IN HEAs AT ROOM TEMPERATURES: SUBMICRON SCALE DEFORMATION CHARACTERISTICS
A critical aspect influencing the deformation behavior in materials is their dependence on the length scale dynamics and associated defect topology. In this context, understanding the size effects on the mechanical response in HEAs is essential to categorize the role of various intrinsic length scales as determined by the dimensions of constituent phases on the generation and motion of crystal defects, such as dislocations, grain/phase boundaries, etc. Unfortunately, in contrast to the burgeoning publications in field of HEAs and related mechanical behavior, there are not many studiesReference Basu, Ocelík and De Hosson40,Reference Zou, Ma and Spolenak57,Reference Giwa, Liaw, Dahmen and Greer79–Reference Okamoto, Fujimoto, Kambara, Kawamura, Chen, Matsunoshita, Tanaka, Inui and George82 delving into the size effect associated deformation in HEAs. The following section will review the results derived from existing research in this area, with the observations classified on the basis of frequently implemented mechanical characterization techniques to probe small-scale deformation behavior in HEAs. A more detailed analysis on the underlying physics and relevant characteristics of small-scale deformation in HEAs will be treated in Sec. IV.
A. Nano/micropillar compression tests
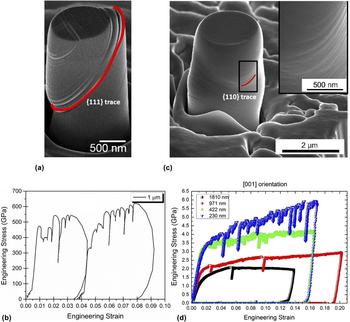
The literature offers very few studiesReference Zou, Ma and Spolenak57,Reference Giwa, Liaw, Dahmen and Greer79–Reference Okamoto, Fujimoto, Kambara, Kawamura, Chen, Matsunoshita, Tanaka, Inui and George82 investigating micropillar deformation characteristics in HEAs. Raghavan et al.Reference Raghavan, Kirchlechner, Jaya, Feuerbacher and Dehm80 performed room temperature micropillar compression tests on the FCC-structured CoCrFeMnNi HEA. Plastic deformation was carried out by {111}〈110〉 planar dislocation slip, with numerous fine slip bands appearing homogeneously throughout the pillar [see Fig. 4(a)]. The engineering stress–strain response corresponding to Fig. 4(a) is shown in Fig. 4(b). This is unlike conventional FCC metals, where micropillar deformation results in the activation of limited number of slip bands that bear majority of the strain. The experimentally determined size exponent was −0.32. The numerical magnitude of these values are smaller in comparison to conventional FCC metals, with size exponents between −0.6 and −0.9. Typically the magnitude of the size exponent ‘m’ scales inversely with the bulk-to-theoretical strength  $\left( {{\mu \over 5}\;{\rm{to}}\;{\mu \over {15}}} \right)$ ratio, mathematically given as
 $${{{\tau _{\rm{R}}}} \over \mu } = A{\left( {{D \over b}} \right)^m}\quad ,$$
where τR is the resolved shear stress, µ is the shear modulus, b is the Burgers vector, and D is the diameter of the pillar. The findings show that the HEAs exhibit higher bulk-to-theoretical strength ratio than conventional FCC metals. Besides the commonly observed “dislocation starvation” phenomenon, wherein attractive image forces experienced by the lattice dislocations due to the presence of free surface (this effect would gain prominence as pillar diameters become smaller in size) results in dislocations annihilating at the free surface, strength increment in FCC–HEAs over conventional FCC metals is attributed to the combination of truncation of dislocation sources owing to geometrical confinement and low mobility of dislocations in HEA resulting from higher Peierls stress. In another studyReference Okamoto, Fujimoto, Kambara, Kawamura, Chen, Matsunoshita, Tanaka, Inui and George82 on room temperature micropillar compression of CoCrFeMnNi HEAs, the experimentally derived size exponent was given as −0.63. However, the proposed size exponent was orientation-independent as opposed to the measurements performed in Ref. Reference Raghavan, Kirchlechner, Jaya, Feuerbacher and Dehm80, wherein the single crystal HEA was defined by the [11 3 5] direction parallel to the loading axis. It was further shown that the resolved shear stress for slip activation on {111}-planes is an order of magnitude (∼33–43 MPa) larger than those observed for conventional FCC metals (∼3 MPa). Micropillar compression on individual FCC and BCC phase constituents in Al0.7CoCrFeNi HEAs was carried out by Giwa and co-workers.Reference Giwa, Liaw, Dahmen and Greer79 They reported a size exponent for the FCC phase in the range of −0.63 to −0.7, indicating enhanced strengthening behavior in HEAs over pure FCC metals. The observed strength increment in FCC–HEA was ascribed to solid solution strengthening effects as well as a high background stress. In a recent studyReference Jiao, Sim, Komarasamy, Mishra, Liaw and El-Awady83 on the deformation of single-phase FCC AlxCoCrFeNi HEA micropillars, it was shown that increasing the Al content in the FCC phase regime (from x = 0.1 to x = 0.3) leads to mechanical softening response for specimen sizes ≤0.1 μm.
(a) SEM micrograph of the compressed CoCrFeMnNi HEA micropillar showing slip along numerous {111} slip planes and (b) corresponding engineering stress–strain response, note the serrated flow. Reproduced with permission from Ref. Reference Raghavan, Kirchlechner, Jaya, Feuerbacher and Dehm80 (Scr. Mater., 2017); (c) SEM image of compressed the BCC MoNbTaW HEA micropillar along the [001] direction showing wavy slip along {110} slip planes and (d) corresponding engineering stress–strain plots for different pillar diameters. Reproduced/adapted with permission from Ref. Reference Zou, Maiti, Steurer and Spolenak81 (Acta Mater., 2014).

Zou et al.Reference Zou, Maiti, Steurer and Spolenak81 investigated the deformation behavior in equiatomic MoNbTaW HEA existing as a BCC solid solution. Micropillars of two different orientations, viz., [100] and [316] parallel to the loading axis were subject to room temperature deformation. The applied strain was accommodated by screw dislocations along 〈111〉 direction, detected by their wavy traces due to cross slip highlighted by the red line in Fig. 4(c). The corresponding stress–strain response for the [100] micropillar is shown in Fig. 4(d). The m values were evaluated as −0.32 for the [316] orientation and −0.36 for the [100] orientation, corresponding to flow stress at 8% plastic strain. In comparison, the individual size exponents for the constituent elements are −0.93 for Nb, −0.44 for W, −0.43 for Ta, and −0.44 for Mo, indicating larger bulk-to-theoretical strength ratio for the HEA over pure BCC metals. The relative flow strength in HEAs is shown to be 2–5 times that of pure BCC metals. The higher strength resulted from increased lattice fraction and solid solution hardening effects leading to nonuniform stress fields that produce a dynamic drag on dislocation glide. In the same work,Reference Zou, Maiti, Steurer and Spolenak81 micropillar involving a grain boundary was also subjected to compression and it was shown that the fracture initiated and propagated along the grain boundary, indicating the role of grain boundaries in strength decrement. Similar observations were presented in Ref. Reference Giwa, Liaw, Dahmen and Greer79, reporting lower size exponents and higher strengths displayed by the BCC phase of the Al0.7CoCrFeNi HEA. Recently, Zou et al.Reference Zou, Ma and Spolenak57 showed that by intelligent microstructure and texture engineering, refractory BCC–HEAs can exhibit significant strength enhancement. They reported strength values of ∼10 GPa (nearly 10 times that of pure BCC metals) for strongly textured, columnar structured HEA micropillars with nanometer-sized grains. With regards to micropillar compression experiments on multiphase HEAs, to the authors’ best knowledge, there are at present no investigations probing into the size-dependent deformation behavior in the presence of an interphase boundary between two crystallographically different lattices.
B. Nanoindentation response in HEAs
An alternative approach to probe submicron scale plasticity mechanisms is using nanoindentation technique. Even though there are quite a few studiesReference He, Zeng, Wang, Ye, Zhu, Nieh, Lu and Yang84–Reference Jiao, Chu, Yang, Wang and Qiao95 probing nanoindentation response in HEAs, the corresponding correlation of the local deformation response to intrinsic material length scales is missing in the majority of these published studies. Nieh and co-workersReference Wu, Jang and Nieh86,Reference Zhu, Lu and Nieh91 performed room temperature nanoindentation experiments on CoCrMnFeNi HEAs. They reported larger activation volumes for FCC–HEAs (∼3 atomic volumes) compared to conventional FCC metals. The suggested mechanism of dislocation nucleation was by means of vacancy or vacancy-mediated migration of atoms. However, the mechanism was proposed to be distinct from the typically observed direct vacancy exchange process.
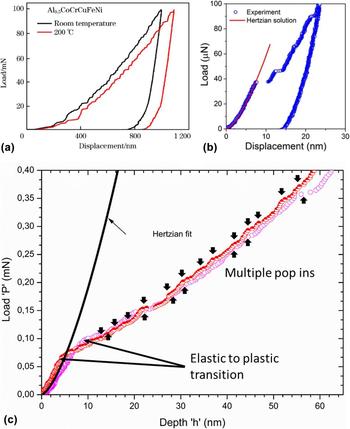
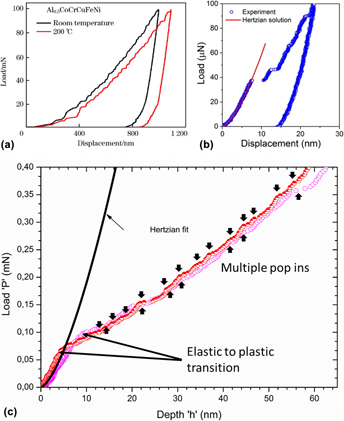
Recent studiesReference Yu, Chen, Ren, Ren, Yang, Dahmen and Liaw92,Reference Jiao, Chu, Yang, Wang and Qiao95,Reference Chen, Yu, Ren, Xie, Li, Xu, Zhao, Li, Yang, Ren and Liaw96 have characterized the room temperature nanoindentation-induced plastic response in Al0.5CoCrFeNi HEAs. The duplex microstructure comprises both BCC and FCC-structured phases. Appearance of discrete strain bursts or serrations was observed at low loading rates that disappeared as the loading rates increased, with load–displacement curves becoming smooth and continuous [see Fig. 5(a)]. It was also shown that the serrations continued to appear when the indentations are performed at 200 °C [see Fig. 5(a)]. Similar serrations were also observed for room temperature indentation in FCC Al0.3CoCrFeNi and BCC AlCoCrFeNi HEAs.Reference Jiao, Ma, Yuan, Wang, Yang and Qiao93 Appearance of multiple displacement bursts [see. Fig. 5(b)] was also observed during room temperature nanoindentation of BCC refractory the HfNbTiZr alloy.Reference Ye, Lu and Nieh90 Similar to the FCC–HEAs, activation volume measurement revealed values are larger than that observed for conventional BCC metals.Reference Ye, Lu and Nieh90 In another study,Reference Basu, Ocelík and De Hosson40 the room temperature nanoindentation response of BCC structured grains in hot forged multiphase Al0.7CoCrFeNi HEA was assessed. The initial microstructure is composed of deformed BCC grains and combination of both strained and strain-free FCC grains. Similar to the observations in the aforementioned studies, indentations performed in the BCC grain revealed appearance of discrete nanometer-sized strain bursts [see Fig. 5(c)]. However, the observed serrations were confined only to the initial plastic regime, transitioning into a smooth flow behavior at larger indentation depths.
Serrated flow curves for nanoindentations performed on (a) Al0.5CoCrFeNi HEA (reprinted with permission from Ref. Reference Yu, Chen, Ren, Ren, Yang, Dahmen and Liaw92); (b) BCC HfNbTiZr HEA (reprinted with permission from Ref. Reference Ye, Lu and Nieh90); and (c) BCC phases in the Al0.7CoCrFeNi HEA. Reproduced with permission from Ref. Reference Basu, Ocelík and De Hosson40 (Acta Mater. 2018).

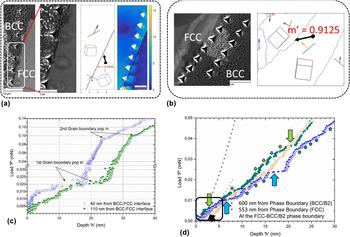
Size-dependent plasticity near and across crystallographically dissimilar phase interfaces in HEAs using nanoindentation is still an unexplored avenue apart from the recent study performed by the authors,Reference Basu, Ocelík and De Hosson97 wherein the role of BCC–FCC interphase boundary on the nanoindentation behavior in multiphase Al0.7CoCrFeNi HEAs from Ref. Reference Basu, Ocelík and De Hosson40 was investigated. Different BCC–FCC interfaces were investigated [see Figs. 6(a) and 6(b)], classified on the basis of slip transmission parameter “m′” from the BCC to FCC grain, given by the following expressionReference Shen, Wagoner and Clark98,Reference Clark, Wagoner, Shen, Lee, Robertson and Birnbaum99 :
 $$m' = \left( {{{\bi{n}}_1} \cdot {{\bi{n}}_2}} \right) \cdot \left( {{{\bi{b}}_1} \cdot {{\bi{b}}_2}} \right)\quad ,$$
where n1 and n2 are the normalized intersection lines common to the slip planes and the boundary plane, and b1 and b2 are the normalized slip directions in the pile-up and emission grains. Maximization of strain transfer parameter m′ is associated with lower grain boundary obstacle strength and easier slip transfer across the BCC–FCC phase boundary. The load–displacement curves for indents made in the BCC grain, in the vicinity of the boundary were analyzed. Plasticity near the boundary obstructing slip was marked by multiple discrete grain boundary related pop-ins [see Fig. 6(c)], whereas both the magnitude and severity of pop-in events were abated for indents near the interface allowing slip transmission [see Fig. 6(d)]. It was observed that slip transfer across interphase boundaries acting as obstacles to dislocation slip (low m′ values) ensued by the absorption of BCC lattice dislocation into the interface and simultaneous grain boundary shearing [see Fig. 6(a)]. This was followed by emission into FCC grain via nucleation at the grain boundary. In the case of boundaries well aligned for dislocation slip transfer (high m′ values), slip transmission took place by direct propagation events. Local scale internal stress gradients measured across the BCC–FCC interfaces strongly correlated with the local hardness response.
Nanoindentation profile near BCC–FCC interphase boundaries in the Al0.7CoCrFeNi HEA for (a) grain boundary blocking dislocation slip and (b) grain boundary allowing slip transfer; indentation response corresponding to (a) shown in (c), and for (b) shown in (d) [images 6a, 6c, and 6d adapted from Ref. Reference Basu, Ocelík and De Hosson97 (Acta Mater., 2018)].

IV. DISCUSSION
The following section discusses the relevant mechanisms associated with size-dependent plasticity in HEAs, in light of the various studies summarized in Sec. III. In the context of the current state of art, a detailed understanding of the relationship between length scale associated deformation response and local microstructure in these alloys is presented. Additionally, research aspects requiring further exploration are addressed. The correlation between the onset of local scale plasticity, defect generation mechanisms in HEAs, and corresponding activation volumes are examined in Sec. IV.A. In Sec. IV.B, particular emphasis is laid upon unraveling the mechanics of serrated flow observed frequently during small-scale deformation in these alloys. Section IV.C will discuss the aspect of size-dependent deformation response across BCC–FCC interphase boundaries in multiphase HEAs.
A. Incipient plasticity in HEAs
Submicron/nanometer scale deformation experiments demonstrate the potential to probe the onset of local scale plasticity in materials. One of the frequently sought techniques to determine the resolved shear stress required for defect nucleation in polycrystalline materials is nanoindentation. In many cases, the onset of plasticity in nanoindentation correlates with the appearance of the first displacement burst or “pop-in” in the load–displacement curve, where the maximum shear stress underneath the indenter τmax exceeds a critical value, i.e., the critical resolved shear stress to nucleate a dislocation.Reference He, Zeng, Wang, Ye, Zhu, Nieh, Lu and Yang84,Reference Lund, Schuh and Mason100,Reference Mason, Lund and Schuh101 In accordance with contact mechanics, τmax occurs at a distance approximately half of the contact radius ‘a’ beneath the indenter and is given byReference Lund, Schuh and Mason100–Reference Johnson102
 $${\tau _{\max }} = 0.47{{{P_{{\rm{applied}}}}} \over {\pi \cdot R \cdot h}}\quad ,$$
where P applied is the applied load, R is the indenter tip radius, and h is the indentation depth. The value of a is given as  $\sqrt {Rh}$.
Physically a pop-in event may ascribe to either nucleation of one or more dislocations or activation of pre-existing dislocation sources, such as Frank–Read loops, in materials. The mode of plasticity initiation is determined by the relative difference between indented volume (∝a 3) during plastic yielding and the mean dislocation spacing ‘d ⊥’ in the region. In the case of ‘a’ being smaller than ‘d ⊥’, plastic yielding will occur via homogenous nucleation of dislocations, whereas in the opposite scenario, plasticity is suggested to be triggered by mobilization and/or multiplication of already present dislocation sources.Reference Morris, Bei, Pharr and George103–Reference Hosson, Soer, Minor, Shan, Stach, Asif and Warren106 In principal, the former will exhibit yielding at stresses close to the ‘theoretical shear strength’ of the material.
Atomistic simulations showed that homogeneous dislocation nucleation during indentation can be considered a stress-biased thermally activated mechanism that involves cooperative motion of many atoms to form a critical-sized dislocation loop, and, consequently, the associated activation energy is very large and the activation volumes are correspondingly small (in the range of 0.5b 3–1b 3). However, the experimentally derived values of activation enthalpies in conventional metals (H ≈ 0.28 eV for FCC-Pt) are much lower than those determined from simulations. This indicated that dislocation nucleation in realistic cases most likely occurs by means of dislocation loop formation at pre-existing vacancy or vacancy cluster.Reference Lund, Schuh and Mason100,Reference Mason, Lund and Schuh101 Theoretically, the activation enthalpy H and activation volume V are indicative of an atomic scale event. While H defines the energy barrier that is needed to overcome for initiating yielding in a perfect stress-free crystal, the activation volume V defines the number of atoms involved in defect nucleation. The magnitude of V determines the rate limiting processReference Zhu, Li, Samanta, Kim and Suresh107,Reference Conrad108 —e.g., dislocation-mediated plasticity is typically associated with V ranging from 100 to 1000b 3 compared to that of point defect/vacancy diffusion being of the order of b 3. During indentation, the energy barrier H is reduced by the mechanical work of indentation σV, giving the probability of defect nucleation per unit volume of the material,  $\dot{n}$ asReference Mason, Lund and Schuh101
 $$\dot{n} = {n_{\rm{O}}}\exp \left( {{{ - H} \over {kT}}} \right)\exp \left( {{{\sigma V} \over {kT}}} \right)\quad ,$$
where kT is the average available thermal energy and n O is a pre-exponential frequency factor/attempt frequency per unit volume. σV captures the stress bias, where σ is the indentation stress acting over the activation volume V.
By contrast, studies on incipient plasticity in HEAs indicate a more complex dislocation nucleation process, as exhibited by higher activation enthalpies and larger activation volumes than conventional metals. Zhu et al.Reference Zhu, Lu and Nieh91 measured an activation enthalpy of 1.72 eV and activation volume of 3b 3 for FCC CoCrFeMnNi HEA. It was suggested that the onset of plastic deformation is a vacancy-mediated process, wherein vacancy migration does not proceed by the conventional one-to-one atom-vacancy exchange mechanism rather through cooperative motion of several atoms. This was attributed to complex compositional variations and inherent lattice disorder due to different atomic sizes of constituent elements in HEAs. In another studyReference He, Zeng, Wang, Ye, Zhu, Nieh, Lu and Yang84 on the same HEA, He and co-workers measured an enthalpy H = 0.74 eV and V ∼ 1.54b 3. The onset of plasticity was delayed, exhibiting a waiting time period before the first pop-in event when indentation loads were held at a constant value. The lower values compared to those reported by Zhu et al. was attributed to heterogeneous nucleation of dislocations in the former. Similarly, large activation volumes were also reported for BCC–HEAs such as 3b 3–5b 3 for BCC HfNbTiZr HEAReference Ye, Lu and Nieh90 and 5b 3 for BCC Al0.7CoCrFeNi HEA,Reference Basu, Ocelík and De Hosson40 indicating a difficult activation of dislocation motion. It was suggested, in the latter study, that the high lattice resistance along with diverse strengthening mechanisms (solid solution strengthening, spinodal strengthening, and order hardening effects) hinder the onset of dislocation-induced plasticity. Nevertheless, the mechanism of vacancy migration during dislocation nucleation in HEAs is still unknown. It is likely that vacancies in HEAs move via more energy intensive pathways such as ring exchange or crowdion mechanisms, but more rigorous experimental studies are needed to validate the feasibility of such processes in these alloys.
B. Serrated plastic flow mechanisms in HEAs
Appearance of discrete strain bursts in the plastic regime physically demonstrates a phenomenon wherein dislocation motion occurs under significant intrinsic resistance.Reference Zhang, Liu, Chen, Xie, Liaw, Dahmen, Qiao and Wang109 Such motion of dislocations is characterized as jerky, highlighted by intermittent periods of rapid glide that manifest as displacement bursts in the loading curve. In amorphous alloys such as bulk metallic glasses that do not prescribe to typical dislocation-based plasticity, strain accommodation is confined to sheet-like volumes known as shear transition zones (STZs) or by means of atomic jumps that act as the weak spots.Reference Schuh, Hufnagel and Ramamurty110 In the case of plastic deformation in semicrystalline materials, a metadislocation model was proposed by Dubois.Reference Dubois111 A metadislocation is an enormous lattice defect, composed of thousands of atoms, which is produced in the same manner as a dislocation except that its core size is much larger. Deformation proceeds by local flips of atomic bonds, which propagate progressively under stress through the entire lattice.Reference Dubois111 Both STZ and metadislocation deformation mechanisms physically manifest into a strongly serrated flow behavior.Reference Zhang, Zuo, Tang, Gao, Dahmen, Liaw and Lu25,Reference Schuh and Nieh112 On the other hand, conventional alloys exhibit classical dislocation-based plasticity that is described by a continuous and smooth flow curve. However, impurity solute–dislocation interactions in metallic alloys could promote serrated flow behavior, commonly addressed as dynamic strain aging (DSA) or Portevin–Le Chatelier (PLC) effect.Reference van den Beukel113,Reference Mulford and Kocks114 Apart from the commonly observed DSA phenomenon, slip avalanches/serrations may also arise from local starvation of dislocation sources, mutual interference of dislocation stress fields, or presence of obstacles that retard dislocation motion, such as statistically entangled dislocation configurations and presence of interfaces (shearing of precipitates, grain boundaries, etc.).Reference Rodriguez115–Reference Brechet and Estrin117
During plastic loading, indentation flow curves in HEAs tend to exhibit abrupt displacement bursts of varying magnitudes appearing at random intervals. Such serrated flow behavior was also reported when HEAs were subjected to slow compression/tension experiments at low strain rates.Reference Diao, Feng, Dahmen and Liaw20,Reference Zhang, Zuo, Tang, Gao, Dahmen, Liaw and Lu25,Reference Zhang, Liu, Chen, Xie, Liaw, Dahmen, Qiao and Wang109,Reference Antonaglia, Xie, Tang, Tsai, Qiao, Zhang, Laktionova, Tabachnikova, Yeh, Senkov, Gao, Uhl, Liaw and Dahmen118,Reference Laktionova, Tabchnikova, Tang and Liaw119 While the appearance of serrations in solid solution alloys and HEAs at elevated temperatures is a common feature owing to the DSA phenomenon,Reference Carroll, Lee, Tsai, Yeh, Antonaglia, Brinkman, LeBlanc, Xie, Chen, Liaw and Dahmen11,Reference Zhang, Zuo, Tang, Gao, Dahmen, Liaw and Lu25,Reference Otto, Dlouhý, Somsen, Bei, Eggeler and George63,Reference Zhang, Liu, Chen, Xie, Liaw, Dahmen, Qiao and Wang109 certain HEAs also show serrations at ambient and cryogenic temperatures where solute diffusivity rates are expected to be significantly sluggish to compete with dislocation velocities.Reference Basu, Ocelík and De Hosson40,Reference Yu, Chen, Ren, Ren, Yang, Dahmen and Liaw92,Reference Chen, Yu, Ren, Xie, Li, Xu, Zhao, Li, Yang, Ren and Liaw96,Reference Laktionova, Tabchnikova, Tang and Liaw119
Recent studiesReference Carroll, Lee, Tsai, Yeh, Antonaglia, Brinkman, LeBlanc, Xie, Chen, Liaw and Dahmen11,Reference Chen, Yu, Ren, Xie, Li, Xu, Zhao, Li, Yang, Ren and Liaw96,Reference Antonaglia, Xie, Tang, Tsai, Qiao, Zhang, Laktionova, Tabachnikova, Yeh, Senkov, Gao, Uhl, Liaw and Dahmen118 have shown that the serration statistics exhibit a universal scaling behavior, i.e., material microstructure and length scale independent, and can be predicted by a mean field model. In this regard, Dahmen and co-workersReference Dahmen, Ben-Zion and Uhl120,Reference Dahmen, Ertaş and Ben-Zion121 proposed a micromechanical model for correlating stress–strain response to slip avalanche behavior during the deformation of solids. The model assumes that a slowly sheared material (slow strain rates) will initiate slip in weaker zones where the local stress exceeds a random local threshold stress. For instance, such weak spots in crystalline materials could be the pre-existing dislocations, vacancy clusters, or interfacial defects. The weak spots are elastically coupled, which means that one slip can trigger other slips, leading to a slip avalanche. Simultaneous collective slip over many such weak zones results in macroscopic slip avalanches that can span length scales larger than the microscopic structure of the materials. Under slow strain rates, it is further assumed that each such slip avalanche does not temporally overlap with another similar event, giving rise to periodic strain bursts in the stress–strain curve. The slip in the weak zones is arrested when the local stress drops below the local obstacle strength, registering an increase in flow stress until the next avalanche initiates. Mathematically, for a crystalline material with N lattice points, the local stress τm at a lattice point m is given as
 $${\tau _{\rm{m}}} = {G \over N}\sum\limits_k {\left( {{u_k} - {u_m}} \right)} + {\tau _{\rm{a}}}\quad ,$$
where τa is the applied shear stress, G is the shear modulus (assumed as the elastic coupling factor in the model), u k is the cumulative slip of all the lattice sites in weak zone k, and u m is the slip contribution from lattice site m. Each point, in site k, slips when the local stress τm exceeds the local resolved shear stress τRSS for slip activation. As the lattice site m slips by a distance Δu m, the local stress drops by a value ∼2GΔx m, temporarily arresting the glide until τa increases further.
In light of the assumptions used in the slip avalanche deformation model, plasticity in HEAs can be considered as intermediate to those exhibited by conventional alloys and amorphous materials.Reference Zhang, Zuo, Tang, Gao, Dahmen, Liaw and Lu25 This is owing to the inherent lattice distortions and high chemical disordering in this class of alloys. Caroll and co-workersReference Carroll, Lee, Tsai, Yeh, Antonaglia, Brinkman, LeBlanc, Xie, Chen, Liaw and Dahmen11 deformed HEAs over different strain rates and temperature conditions such that for specific ranges a serrated flow behavior was observed. They observed that with increasing temperature, the serrated flow characteristics in HEAs transition from type-A to type-B, and finally type-C PLC-band behavior. The experimental findings were subsequently correlated with the slip-avalanche mean field model, described above, to quantify the serration statistics in HEAs and corresponding deformation behavior. It was proposed that dislocation motion in HEAs is characterized by variable lattice friction owing to different solute–dislocation interactions, resulting in stick-slip dislocation dynamics. In contrast to conventional alloys that show DSA effect, the frequency of such solute–dislocation interactions is much more abundant in HEAs owing to a larger diversity of elements present in the solid solution. This leads to more rapid fluctuations in the local stress τm and correspondingly more jerky dislocation behavior in HEAs. It was further suggested that the serrated flow effect is exacerbated when the size difference for various permutations of atomic pairs in the lattice increases, i.e., atomic radii of individual alloying elements show large variance.
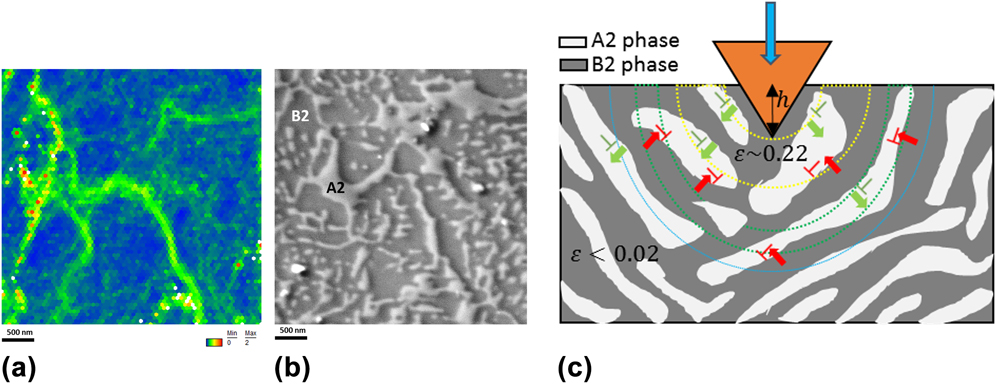
Even though the above-mentioned approach is able to explain stochastically the serrated flow characteristics in HEAs, it provides an incomplete picture with respect to the associated physical mechanisms especially with regards to serrations observed in HEAs at low temperatures (T ≤ 300 K). Moreover, the influence of local microstructure on the dislocation dynamics can significantly vary over compositionally and structurally distinct HEAs. In this direction, the authors probed into underlying physics of serrations in greater detail with respect to the BCC-structured Al0.7CoCrFeNi HEA that showed multiple strain bursts during room temperature nanoindentation-induced deformation.Reference Basu, Ocelík and De Hosson40 The microstructure of the indented body-centered cubic Al0.7CoCrFeNi HEA grain is known to comprise two compositionally different phases, viz., Ni- and Al-rich ordered B2-BCC phases interspersed with disordered Fe- and Cr-rich A2-BCC phases. These nanoscale phases, forming during long duration homogenization, give rise to the spinodally modulated microstructure. It was shown that the observed staircase yielding behavior is triggered by the resistance generated due to spinodal strengthening and order hardening mechanisms at the interphase boundary between the elastically stiffer B2 matrix and soft A2 phase, against the dislocation motion [see Figs. 7(a) and 7(b)]. Figure 7(c) gives a simplified illustration of the deformation behavior beneath the indenter tip. The BCC–HEA grain shows a composite-like microstructure wherein the white A2 phases act as the plastically weaker zones compared to ordered B2 phase shown in dark gray. During indentation strain accommodation, dislocation motion initiates in the elastically softer disordered A2 phases as depicted by dislocations in green with the forward stress component along the glide direction shown by the green arrow. These dislocations subsequently pile-up at the A2/B2 interface (illustrated by the retarded red dislocations with direction of back stress shown by red arrow), thereby arresting local slip until further increment in applied stress generates preferential glide in the one or more A2-BCC lamellae. This intermittent glide behavior gives rise to stick-slip dislocation dynamics. As the applied load increases more and more, it is likely that the local stresses become high enough in certain regions to overcome the strengthening stress barrier at the A2/B2 interface such that dislocations can now traverse through both the disordered and ordered phases. This explains the dampening of serration events that was observed for higher indentation loads or greater penetration depths.
(a) Kernel average misorientation and (b) SEM images for A2 and B2 phases in the BCC grain in the Al0.7CoCrFeNi HEA, showing higher plastic strain in A2 phases compared to B2 phases; (c) schematic illustrating small scale plasticity in BCC phases in the Al0.7CoCrFeNi HEA. Adapted with permission from Ref. Reference Basu, Ocelík and De Hosson40 (Acta Mater., 2018).

Metals and alloys that accommodate strain via alternative deformation modes such as mechanical twinning can also show serrated flow behavior. Since shear accommodated during twinning is instantaneous and significantly larger than slip deformation, the associated stress drop after each twinning event is quite abrupt.Reference Basu and Al-Samman67,Reference Christian and Mahajan122–Reference Basu and Al-Samman125 This is followed by an increase in applied stress until it nucleates another twin or leads to the growth of pre-existing twins. This process can give rise to a discontinuous flow behavior, often accompanied with crackling noise.Reference Gottstein116 One of the earliest studies on such twinning-related serrated flow was performed by Blewitt and co-workers,Reference Blewitt, Coltman and Redman126 where this phenomenon was exhibited during tensile deformation of face-centered cubic single crystalline copper at cryogenic testing conditions. Similar observations on serrated flow due to continual twinning were presented by Bolling and RichmanReference Bolling and Richman127,Reference Bolling and Richman128 where different face-centered cubic metals and alloys exhibiting mechanical twinning were investigated. Recently Liang et al.Reference Liang, De Hosson and Huang129 performed deformation on submicron-sized single crystalline TWIP steel micropillars with face-centered cubic structure. TWIP steels, as the name suggests, primarily deform by twinning and are often associated with discontinuous flow characteristics.Reference De Cooman, Kim and Lee130 It was shown that the flow behavior was discrete marked by repeated strain bursts interspersed with elastic loading. The plastic strain was accommodated primarily by deformation twinning, with the observed strain bursts resulting from discrete periods of twin growth.
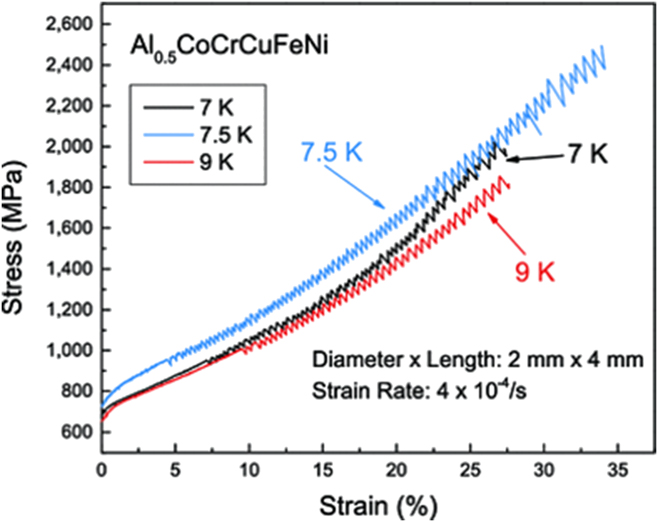
Certain FCC–HEAs, when deformed at room and cryogenic temperatures, exhibit serrated flow behavior. It has been frequently observed that macroscale deformation in FCC-structured HEAs proceeds by the combination of dislocation slip and mechanical twinning, with the latter being the dominant mode at low temperatures. From a microstructural point of view, mechanical twinning-related serrations could very likely be the underlying mechanism during the deformation of FCC–HEAs at low temperatures. Laktionova et al.Reference Laktionova, Tabchnikova, Tang and Liaw119 observed strongly serrated flow behavior at very low temperature (between 7 and 9 K) compressive deformation of FCC-structured Ag0.5CoCrCuFeNi HEAs (see Fig. 8). Antonaglia et al.Reference Antonaglia, Xie, Tang, Tsai, Qiao, Zhang, Laktionova, Tabachnikova, Yeh, Senkov, Gao, Uhl, Liaw and Dahmen118 analyzed the serration behavior reported in Ref. Reference Laktionova, Tabchnikova, Tang and Liaw119. They observed that the size of strain bursts decreased with increasing deformation temperature (see Fig. 8). It was speculated that the observed discontinuous flow behavior at low temperatures is attributed to the activation of deformation twinning. However, there are still no studies that directly correlate serration in FCC–HEAs with deformation twinning. Moreover, the size effects of twinning in HEAs and its corresponding impact on the twinning-induced strain accommodation still remains an area that needs further investigation. Till now room temperature submicron scale deformation behavior in FCC–HEAs is similar to that exhibited by conventional metals in terms of active deformation modes, i.e., plasticity is carried out purely by slip rather than twinning due to a larger size dependent strengthening of the latter.Reference Raghavan, Kirchlechner, Jaya, Feuerbacher and Dehm80 However, little is known regarding the submicron/nanoscale plasticity response of FCC–HEAs at very low temperatures (similar to the ones probed in Ref. Reference Laktionova, Tabchnikova, Tang and Liaw119). Particularly the flow behavior in these temperature ranges, in the case where deformation twinning is activated would be a critical step in throwing light on the role of mechanical twinning on small scale deformation response in HEAs.
Compressive stress–strain curves of Al0.5CoCrCuFeNi at temperatures of 7, 7.5, and 9 K at a strain rate of 4 × 10⁻⁴/s. The sample is 2 mm in diameter and 4 mm in length. Reproduced with permission from Ref. Reference Laktionova, Tabchnikova, Tang and Liaw119 (Low Temp. Phys., 2013).

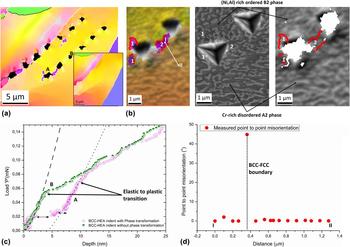
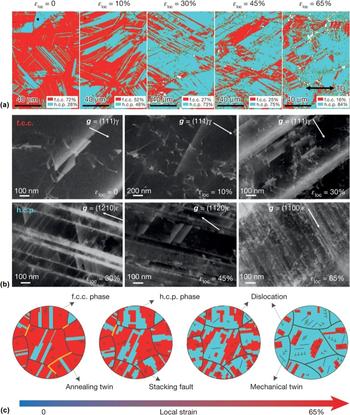
Another possible mechanism that may trigger serrated flow in HEAs is deformation strain-induced displacive phase transformations. One such instance was recently reported in Ref. Reference Basu, Ocelík and De Hosson40, wherein nanoindentation of the strained BCC grain in the Al0.7CoCrFeNi HEA resulted in dynamic transformation of parts of the BCC parent into FCC-structured grains [see Fig. 9(a)], which appeared as additional strain bursts in the indentation flow curve [see Fig. 9(c)]. The orientation relationship obeyed the Kurdjumov–Sachs (K–S) relationship defined by the {111}FCC‖{110}BCC and 〈110〉FCC‖〈111〉BCC [see Figs. 9(b) and 9(d)]. The observed transformation was of martensitic type, i.e., shear induced. It was suggested that local compositional perturbations (especially of Al, i.e., known to drive transformation from FCC to BCC) and strain gradients present in the microstructure strongly influence the phase stability of BCC grains and under external stress can drive such dynamic crystallographic modifications. Displacive transformation in HEAs during plastic deformation were also reported by Li et al.,Reference Li, Tasan, Pradeep and Raabe43 wherein a TRIP effect was achieved for a nonequiatomic Cantor alloy exhibiting strain-induced phase change from FCC to HCP that lead to exceptional strength and ductility performance (see Fig. 10). However, no serrations were registered on the macroscopic stress–strain response. It is likely that at reduced deformation length scales, such TRIP effects could result in a discrete plastic response. This is indeed the case for conventional TRIP steels, where it has been shown before that nanoindentation strain induced austenite to martensite transformation correlates with the appearance of discrete strain burst in the load–displacement curve.Reference Ahn, Oh, Kim, Oh, Bei, George and Han131
(a) IPF map showing indents made in the BCC grain, with few of them indicating indentation-induced BCC to FCC phase transformation. The inset image shows the same region prior to indentation with no traces of FCC grains. BCC–FCC phase boundaries are highlighted in white and other grain boundaries (misorientation larger than 3°) shown in black; (b) magnified IPF + IQ map of the vicinity of Indent A, corresponding SEM and forward scatter detector images showing the distribution of A2 and B2 phases. BCC–FCC phase boundaries are overlaid with Kurdjumov–Sachs orientation relationship shown in red, with an angular deviation of ±5°; (c) indentation load–displacement curves for indents with and without BCC–FCC phase transformation; (d) point-to-point misorientation profile across newly formed BCC–FCC phase boundaries, from point I to II. Reproduced with permission from Ref. Reference Basu, Ocelík and De Hosson40 (Acta Mater., 2018).

Deformation micromechanisms in the TRIP-DP-HEA with increasing tensile deformation at room temperature: (a) EBSD phase maps showing deformation-induced martensitic transformation as a function of deformation. εloc is the local strain and TD is the tensile direction; (b) electron channeling contrast imaging showing the evolution of defect substructures in the fcc and hcp phases; g is the diffraction vector, γ is the fcc phase, and ε is the hcp phase; (c) schematic showing the sequence of microprocesses in the TRIP-DP-HEA. Reproduced with permission from Ref. Reference Li, Pradeep, Deng, Raabe and Tasan44 (Nature, 2016).

C. Plasticity across the BCC–FCC interface in HEAs
Strengthening and plasticity response in multiphase Type II HEAs strongly depend upon the interactions between dislocations and interfaces. Grain or phase boundaries may either act as obstacles or sources of dislocation-based plasticity, primarily depending on the nature of interaction between stress fields generated by dislocations and grain boundaries, and crystallography of the interface.Reference Soer, Aifantis and De Hosson132 For interfaces acting as obstacles, incoming dislocations tend to pile-up at the interface creating a localized stress concentration at the boundary. As the number of dislocations in the pile-up increases, the magnitude of stress experienced by the dislocation positioned at the spearhead of the pile-up increases rapidly. At a certain critical stress concentration, the grain boundary resistance is overcome and the pile-up is relieved, which manifests as single or multiple displacement bursts in the indentation load–displacement curve. Theoretically, the number of dislocations in a pile-up ‘n pu’ can be expressed asReference Soer, Aifantis and De Hosson132
 $${n_{{\rm{pu}}}} = {\pi \over {Gb}} \cdot L \cdot {\tau _{\rm{a}}}\quad ,$$
where Gb is the product of shear modulus (measured from indentation experiments) and the magnitude of the Burgers vector of active slip direction; L is the length of pile-up and τa is the applied shear stress.
The release of pile-up is associated with dislocations being either directly transmitted across the boundary or first absorbed into the boundary and subsequently emitted into the neighboring grain. The feasibility of dislocation absorption into the grain boundary largely depends upon the nature of stress fields generated during the interaction of pile dislocations and the grain boundary dislocations.Reference Basu, Ocelík and De Hosson133–Reference Head137 With regards to the dislocation emission, the possible mechanisms could be either by means of slip propagation (wherein the availability of a geometrically aligned active slip system in the neighboring grain is a prerequisite) or by nucleation of dislocations, either at the boundary or in the neighboring grain.Reference Soer, Aifantis and De Hosson132 Theoretically, it is expected that the more favorable pathway will be the one associated with minimum energy expenditure.
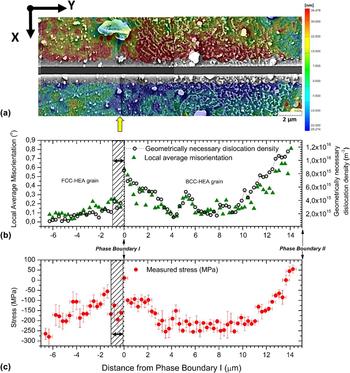
To probe the aforementioned mechanisms for interfaces in multiphase HEAs, deformation behavior at intrinsic length scales in the vicinity of phase boundaries needs to be understood. In Ref. Reference Basu, Ocelík and De Hosson97, BCC–FCC interfaces with varying geometrical compatibility with respect to incoming and outgoing slip systems were investigated (see Sec. III.B). Site-specific high resolution residual stress measurements across the BCC–FCC interface additionally reveal the local stress state on both sides of the grain boundary. For grain boundaries with poor slip transmissivity, both geometrically necessary dislocation densities and residual stress gradients were marked by a sharp discontinuity at the interface (see Fig. 11), highlighting their role on the local strain partitioning behavior. The stresses in the BCC phase moved from compressive to tensile on approaching the BCC–FCC phase boundary, while those in the adjacent FCC grain were of entirely compressive nature. The stress values in the BCC–HEA grain indicate a monotonic decrease with increasing distance from the interphase boundary, with the relative stress differential between the boundary and grain interior measured in the range of ∼325 MPa. On the other hand, the stress profile in the FCC–HEA grain is marked by a local stress minimum within ∼300 nm from the phase boundary, subsequently followed by a monotonically decreasing Hall–Petch type stress profile (defined by a stress variation of “one over square root of distance”) at larger distances from the interface.
(a) DIC contour map showing the displacement fields due to stress release from slit milling in the direction lateral to the slit (x-direction), investigated phase boundary is marked by the yellow arrow; (b) geometrically necessary dislocation density and local average misorientation gradients in the FCC–HEA and BCC–HEA grains, determined along the slit length (along y-direction); (c) experimentally measured local residual stress lateral to the slit length (along x-direction) plotted with respect to the slit length (along y-direction). FCC–HEA grain shows a local stress minimum and drop in local dislocation density values in the region very close to the BCC–FCC interface as shown by the shaded area. Reproduced from Ref. Reference Basu, Ocelík and De Hosson97 (Acta Mater., 2018).

Stress profiles associated with the BCC–FCC interface promoting slip transfer showed a smooth transition, displaying no stress discontinuity across grain boundary.Reference Basu, Ocelík and De Hosson97 Both grains showed an overall compressive stress state. The stress levels inside the BCC–HEA grain, varied from highly compressive in the grain interior to low compressive values near the boundary. With regards to the FCC grain, a stress minimum is observed near the interface. The deviation from the conventional Hall–Petch behavior observed in the FCC grains in the vicinity of the boundary is attributed to the stress fields generated due to the interaction of pile-up dislocations and the phase boundary,Reference Basu, Ocelík and De Hosson133,Reference Basu, Ocelík, De Hosson, Northwood, Rang, De Hosson and Brebbia138 which influences the local pile-up configuration.
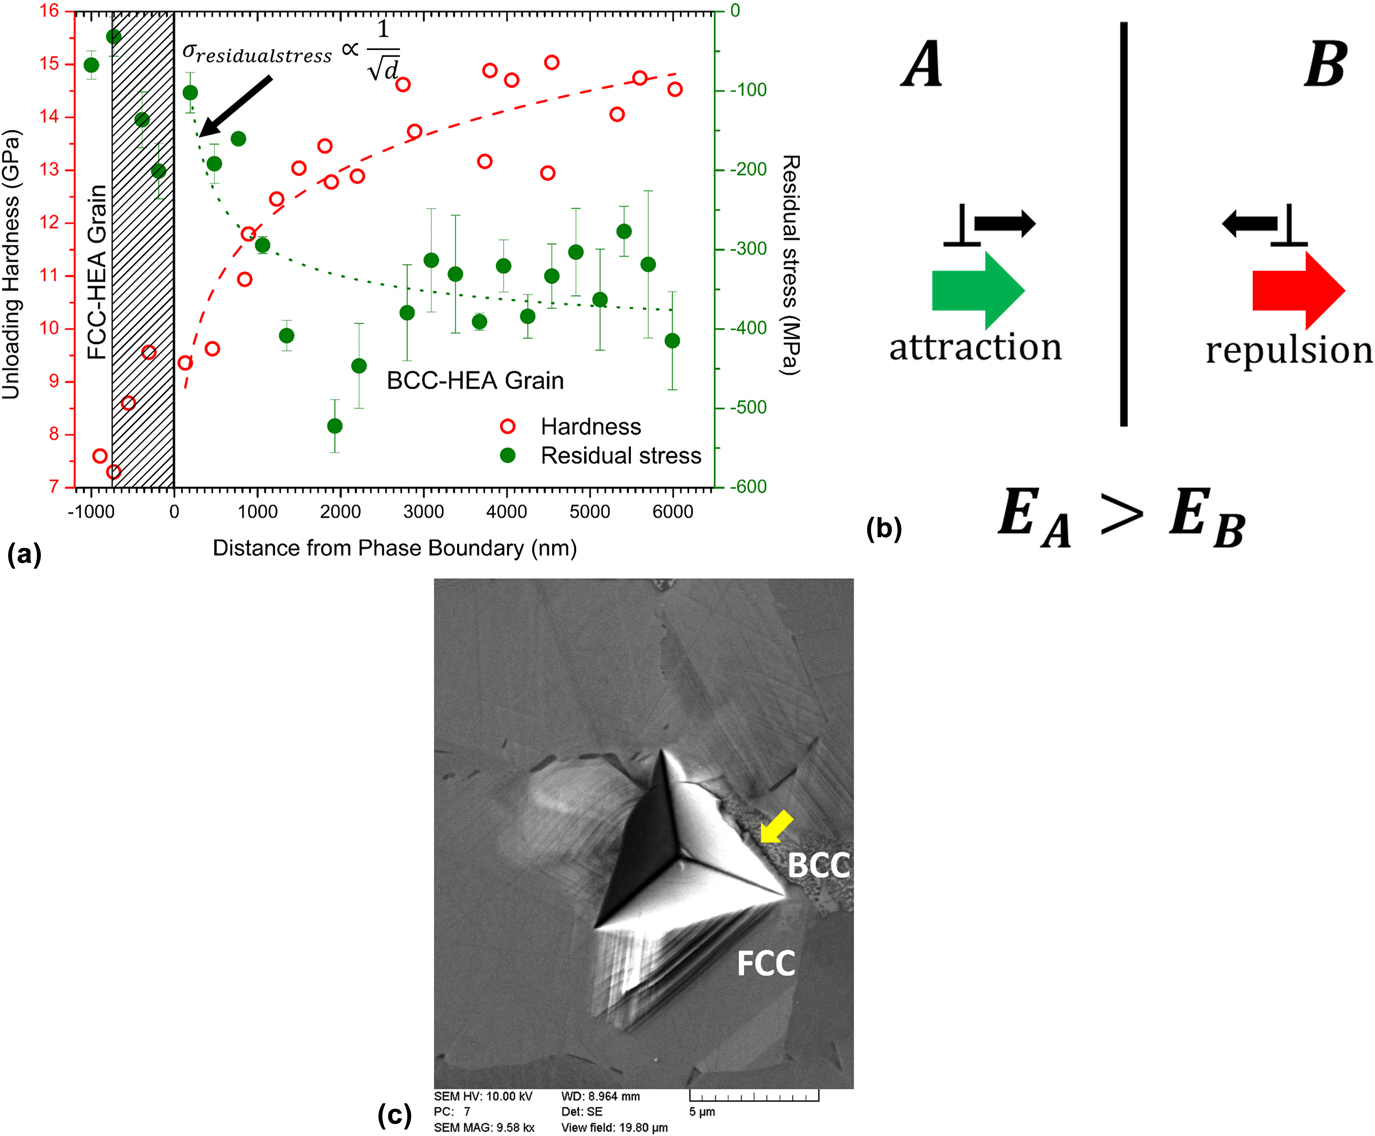
The experimentally determined values in Fig. 12(a) establish an inverse correlation between the local hardness and the locally existing internal stress fields, measured across the BCC–FCC interface. While for the BCC grain, the nanohardness values progressively decrease vis-à-vis local stress values transitioning from compressive to tensile on moving near the grain boundary, the trends reverse in the FCC grain with increasing hardness values and decreasing local residual stresses in the vicinity of the interface. As mentioned previously, these trends are associated with the nature of interaction of the incoming lattice dislocations, on either side, with the grain boundary. Such interactions result in the incoming lattice dislocations experiencing a self-stress, termed as image force, primarily arising due to the elastic moduli anisotropy between neighboring grains/phases.Reference Hirth136 The concept of image forces can be rationalized as follows. A dislocation near the interface will exert a strain field in both the grains [see Fig. 12(b)]. Considering the case, when the elastic moduli difference is given as, E A > E B, the dislocation energy in the stiffer medium A will be larger per unit dislocation length because the elastic constants are larger. Hence, to reduce the energy of the system, a dislocation in the softer grain B will be repelled by the interface, while the dislocation in grain A will experience an attractive image force.
(a) Variation of nanohardness and local residual stress as a function of distance from the phase boundary in neighboring BCC and FCC grains; (b) illustration of image forces experienced by lattice dislocations in medium A and medium B in the vicinity of the interface; (c) experimentally observed fracture initiation along the BCC–FCC interphase boundary for larger indentations (higher imparted total strains). Reproduced from Ref. Reference Basu, Ocelík and De Hosson97 (Acta Mater., 2018).

It was found that the experimentally obtained elastic modulus of the BCC–HEA grain is larger than the FCC–HEA grain, as measured by indentation ( $E_{{\rm{BCC}} - {\rm{HEA}}}^{{\rm{indentation}}} = 275\;{\rm{GPa}}$ vis-à-vis
 $E_{{\rm{FCC}} - {\rm{HEA}}}^{{\rm{indentation}}} = 252\;{\rm{GPa}}$), whereby dislocations in the BCC grain would experience attraction toward the interface. This is unlike the values observed for conventional FCC and BCC crystal structures where the former typically shows larger stiffnessReference Tian, Delczeg, Chen, Varga, Shen and Vitos139 and was attributed to the presence of ordered B2 phases in the BCC grain that resulted in an additional increment of elastic modulus. The difference in elastic moduli values nicely explains the observed phenomenon of absorption of BCC lattice dislocations into the boundary and subsequent emission in the FCC grain (see Sec. III.B). On the other hand, the FCC grain experiences a repulsive force between the incoming dislocations and the grain boundary resulting in local increase in hardness since the generated dislocations are unable to move away from the indent toward the grain boundary. This also explains the local decrease in dislocation densities in the vicinity of the grain boundary and appearance of local minimum in internal stress values observed for the FCC grain [see Figs. 11 and 12(a)] that arise due to repulsive interactions between the grain boundary dislocations and incoming dislocations. Note that the appearance of such local stress minimum is not seen for the BCC grain, wherein the image forces exert an attractive pull on the grain boundary.
Figure 12(a) also indicates that for larger compressive residual stresses, the recorded hardness values are also higher. This outcome is quite intuitive considering that during indentation, as the indenter penetrates into the substrate it simultaneously pushes out the material in the lateral direction. A compressive stress state in the lateral direction would therefore resist such deformation, hence a higher hardness value. In the case of a tensile residual stress, the lateral forces exerted during indentation will constructively superpose with the internal stresses and the corresponding plastic deformation will initiate earlier leading to relatively low hardness values. With respect to fracture response, a tensile stress and low hardness value at the interphase boundary would promote preferential crack nucleation and propagation along the boundaries in Al0.7CoCrFeNi HEAs, as depicted in Fig. 12(c), wherein an indentation performed at higher loads near a BCC–FCC phase boundary leads to crack propagation along the interphase. The outcomes and trends highlight the crucial role of interphase boundary crystallography and internal strain on the subsequent mechanical response and damage behavior not only across Al0.7CoCrFeNi interphase boundaries but also with regards to generic BCC–FCC interfaces existing in HEA alloys.
These observations stimulate the need for more detailed experimental studies on the size effects on plasticity in the presence of interface in multiphase HEAs. More importantly, it provides crucial information with regards to grain boundary engineering in HEA alloys that remains a topic yet to be explored.
V. SUMMARY AND CONCLUSIONS
The above review focused upon the small scale deformation characteristics of HEAs in context with composition, crystallography, and material microstructure. It puts forth a clear overview of the existing HEA research in this avenue as well as the critical knowledge gaps that need to be addressed. The following key aspects of small scale deformation in HEAs were considered:
(1) Small scale plasticity at ambient temperature in HEAs shows a delayed onset owing to distinct dislocation nucleation mechanisms as indicated by larger activation enthalpies and activation volumes in comparison with conventional alloys. It is predicted that the process of dislocation formation is vacancy mediated but the associated vacancy migration involves larger atomic volumes, compared to those related to the typically observed site-exchange mechanism. Further work is required to gain an in-depth understanding of the mechanism of vacancy diffusion in HEAs at room temperature.
(2) Serrations in HEAs, especially during deformation at submicron scales, are a common phenomenon. It was shown that serrated flow could arise from various sources, i.e., local dislocation strengthening mechanisms, mechanical twinning, plasticity induced phase transformation as well as solute–dislocation interactions. The observations highlight the importance of correlating specific microstructure types to the serration characteristics along with statistical quantification of the serrations in HEAs. Moreover, the review throws light upon the dearth of studies correlating serration behavior with deformation twinning, which is frequently observed in FCC–HEAs. Additionally, size effects of twinning during small scale deformation of HEAs still need to be explored.
(3) Finally, the role of interfaces between crystallographically dissimilar phases on the size-dependent plasticity in multiphase HEAs is an area that has not been studied at all. It is shown that the nature of dislocation-phase boundary interactions can play a crucial role in local stress gradients near the interface as well as influence grain boundary plasticity. The implications of these observations are significant in engineering damage resistant multiphase HEAs.
ACKNOWLEDGMENTS
This research was carried out under project number T61.1.14545 in the framework of the Research Program of the Materials innovation institute (M2i) (www.m2i.nl).