

1. Introduction
Financial literacy is a critical skill for effective personal financial management and long-term economic decision-making. It empowers individuals to make informed financial decisions, plan for their future, and protect themselves against financial fraud (Lusardi and Mitchell Reference Lusardi and Mitchell2011, Reference Lusardi and Mitchell2014). With financial matters becoming increasingly complex, the importance of a financially literate population has never been greater and the need to raise personal financial knowledge has captured the attention of academics, practitioners, and policymakers worldwide (OECD 2022).Footnote 1
Understanding the levels and possible heterogeneities in financial literacy in Switzerland, a nation known for its robust financial services and high standard of living, is crucial, as it is a perfect case study for understanding how financial literacy may impact wealth and well-being-enhancing economic decision-making in advanced economies. Despite its prominence as a very successful global financial hub and wealthy country, empirical research on financial literacy in Switzerland remains surprisingly sparse.Footnote 2 This gap in the literature presents a unique opportunity to explore financial literacy in a context characterized by a highly developed financial sector, significant wealth, and intricate pension system, possibly demanding a high level of financial savvy from individuals. Moreover, the Swiss setting is distinct, not only due to its economic characteristics but also because of its unique multilingual and cultural composition, which allows to study the impact of such differences on financial behaviors across regions.
Thus, the paper has two main aims: first, to measure the levels of financial literacy on average and across different demographic groups in Switzerland, and second, to explore the factors that influence these levels to understand the implications for financial behavior and economic outcomes. We present results from a novel and large representative survey of the Swiss population that we conducted in the summer of 2023, assessing financial knowledge by applying concepts developed in the The Big Three financial literacy questions that are the root of financial decision-making (knowledge on interest rate, inflation, and risk diversification, Lusardi and Mitchell Reference Lusardi and Mitchell2011). Our three financial literacy questions and the survey instrument in general were carefully designed to also align with international standards set by the Organisation for Economic Co-operation and Development (OECD 2022), incorporating both traditional financial literacy questions and specific items adapted to the Swiss context. This approach not only facilitates comparison with international data but also provides insights unique to the Swiss setting, such as the role of language heterogeneity within a given institutional setting on financial literacy.
Our paper presents five sets of results and, in doing so, provides not only important descriptive but also analytical contributions, to the international comparative financial literacy discussion. First, we show that average financial literacy in Switzerland is relatively high, compared with other developed countries. Slightly more than 50 percent of respondents in our representative survey could answer the three financial literacy questions correctly. These results are substantially higher than in other wealthy nations, such as the USA (where Lusardi and Streeter Reference Lusardi and Streeter2023 find below 30% of correct answers) or Japan (where Sticha and Sekita Reference Sticha and Sekita2023 find 36% of correct answers), but they are in line with the levels in Germany as documented by Bucher-Koenen et al. (Reference Bucher-Koenen, Janssen, Knebel and Tzamourani2023) who find about 60 percent of correct answers. Second, this overall high average financial literacy is accompanied by significant disparities in financial knowledge across different demographic groups, also echoing trends observed in global financial literacy studies (Klapper et al. Reference Klapper, Lusardi and Van Oudheusden2015). Younger people, females, and individuals with low education attainment (finishing no more than compulsory, lower-secondary education) have lower financial literacy. Third, we also find systematic differences in results across the three official languages in Switzerland, which hints at an interesting methodological question for international comparative financial literacy research; our three financial literacy questions show significantly lower scores among French- and Italian-speaking respondents than among German-speaking respondents, although they all live under the same legal, institutional, and educational frameworks. This may hint at cultural differences related to the spoken language, or at issues regarding the comparability of financial literacy questions across countries with different languages and should be further analyzed in future research.
Fourth, some financial literacy gaps are mirrored in gaps in self-perception of own financial knowledge. For example, women report much lower self-assessed knowledge compared with men, in line with the finding that women’s financial literacy levels are lower than that of men. However, some groups, such as Italian-speaking respondents, overestimate their financial knowledge, indicating a larger discrepancy between actual knowledge and self-perception in these groups. This finding raises concerns that the disconnect between actual financial knowledge and one’s perception of it may lead to over- or under-confidence in making important financial decisions. Fifth, the study delves into the link between financial literacy and self-reported financial and economic behaviors and shows that higher financial literacy is also associated with economic well-being and vice versa. We find that higher financial literacy corresponds with a reduced likelihood of living in circumstances of financial instability and that less financially literate respondents are less likely to save, less likely to be able to face income shocks, or to be able to cover their living expenses.
By situating the Swiss experience within the wider global context, this paper aims to contribute to the ongoing dialogue on financial education and its role in fostering more resilient economic systems. Moreover, this study contributes to the empirical studies aiming at representatively assessing financial literacy in Switzerland. Although several country-level studies and initiatives have measured financial knowledge in most Western countries (see Lusardi and Mitchell Reference Lusardi and Mitchell2014), the empirical evidence on financial literacy in Switzerland is scarce so far.Footnote 3 We add to this literature by providing a representative sample for all language regions and all age groups (from adolescents before entering the labor market to adults after retirement) and by using the standard international financial literacy measures.
The paper is structured as follows. Section 2 describes our survey design and methodology, Section 3 presents the empirical results on the levels of financial literacy in Switzerland, Section 4 links financial literacy to economic behavior and real outcomes, and Section 5 concludes.
2. Survey design and methodology: measuring financial literacy in a multilingual and educationally diverse country
For this study, we designed and conducted a survey on financial literacy in Switzerland that aimed at assessing the financial knowledge and financial behaviors among the whole population and across diverse educational pathways and levels. The survey was conducted online between June 1st and June 15th, 2023. It was run by a professional survey company, intervista AG, which uses a large stratified random sample to ensure representation across the three large language regions in Switzerland: German-, French-, and Italian-speaking parts of Switzerland.Footnote 4 The survey company intervista AG has an ongoing panel of respondents for whom they have important individual information and who are regularly surveyed. Respondents are rewarded for participating in the surveys by collecting credit points based on the length of each survey they participate in. To identify and exclude unreliable respondents, intervista AG carries out extensive data quality checks.
The final sample of respondents includes slightly more than 4,000 Swiss residents between 15 and 79 years of age, and – based on our request – oversamples the youngest age group from 15 to 30 years old. All descriptive results presented in the forthcoming sections are based on the full sample and weighted data; thus, all the results reported in this paper are representative of Switzerland in terms of age distribution, sex, education level, and language region.
The survey instrument was developed to align with international standards set by the OECD and included variants of the Big Three as well as the OECD/INFE financial literacy questions (OECD 2022). For the three official languages, we used the respective country version of the OECD, i.e., the German, French, and Italian versions. We added specific questions related to the Swiss educational and institutional setting (particularly, to better capture its unique educational pathways and occupational differences). This approach not only allows for a comparison with international data, but it also addresses unique aspects of the Swiss context. Descriptive statistics, including the distribution of demographic characteristics and responses to key survey questions, are provided in Appendix Table A.1.
3. Levels of financial literacy in Switzerland
First, we present descriptive results using variants of the Big Three financial literacy questions by Lusardi and Mitchell (Reference Lusardi and Mitchell2011), which aim to evaluate the understanding of interest rates, inflation, and risk diversification. We slightly amended the original questions of Lusardi and Mitchell to make them compatible with the OECD financial literacy questionnaire for our country comparisons.
3.1 Three financial literacy questions used in the Swiss survey
3.1.1 Understanding of interest rate
Imagine that someone puts CHF100 into a no-fee, tax-free savings account with a guaranteed interest rate of 2 percent per year. They do not make any further payments into this account, and they do not withdraw any money. How much would be in the account at the end of five years, once the interest payment is made?
-
i) More than CHF110 (correct answer)
-
ii) Exactly CHF110
-
iii) Less than CHF110
-
iv) It is impossible to know given the information provided
-
v) Don’t know
3.1.2 Understanding of inflation
Five brothers are going to be given a gift of CHF1,000 in total to share between them.
Now imagine that the brothers have to wait for one year to get their share of the CHF1,000 and inflation stays at 5 percent. In one year’s time will they be able to buy:
-
i) More with their share of the money than they could today
-
ii) The same amount
-
iii) Less than they could buy today (correct answer)
-
iv) Do not know
3.1.3 Understanding of risk and diversification
Is the following statement true or false? “It is usually possible to reduce the risk of investing in the stock market by buying a wide range of stocks and shares.”
-
i) True (correct answer)
-
ii) False
-
iii) Do not know
As pointed out in a Finland-specific study by Vaahtoniemi et al. (Reference Vaahtoniemi, Buturak, Kalmi and Ruuskanen2023), the interest rate question is slightly more difficult than in the Big Three version, as the respondent needs to understand both the concept of interest rate and the one of compound interest rates, besides providing an additional answer option (“it is impossible to know given the information provided”), which will likely reduce the share of correct answers. Moreover, in the OECD inflation question, a monetary value is provided, and the rate paid to inflation is double that compared with the original Big Three. Finally, in the risk diversification question, the statement is constructed to be true and not false.Footnote 5
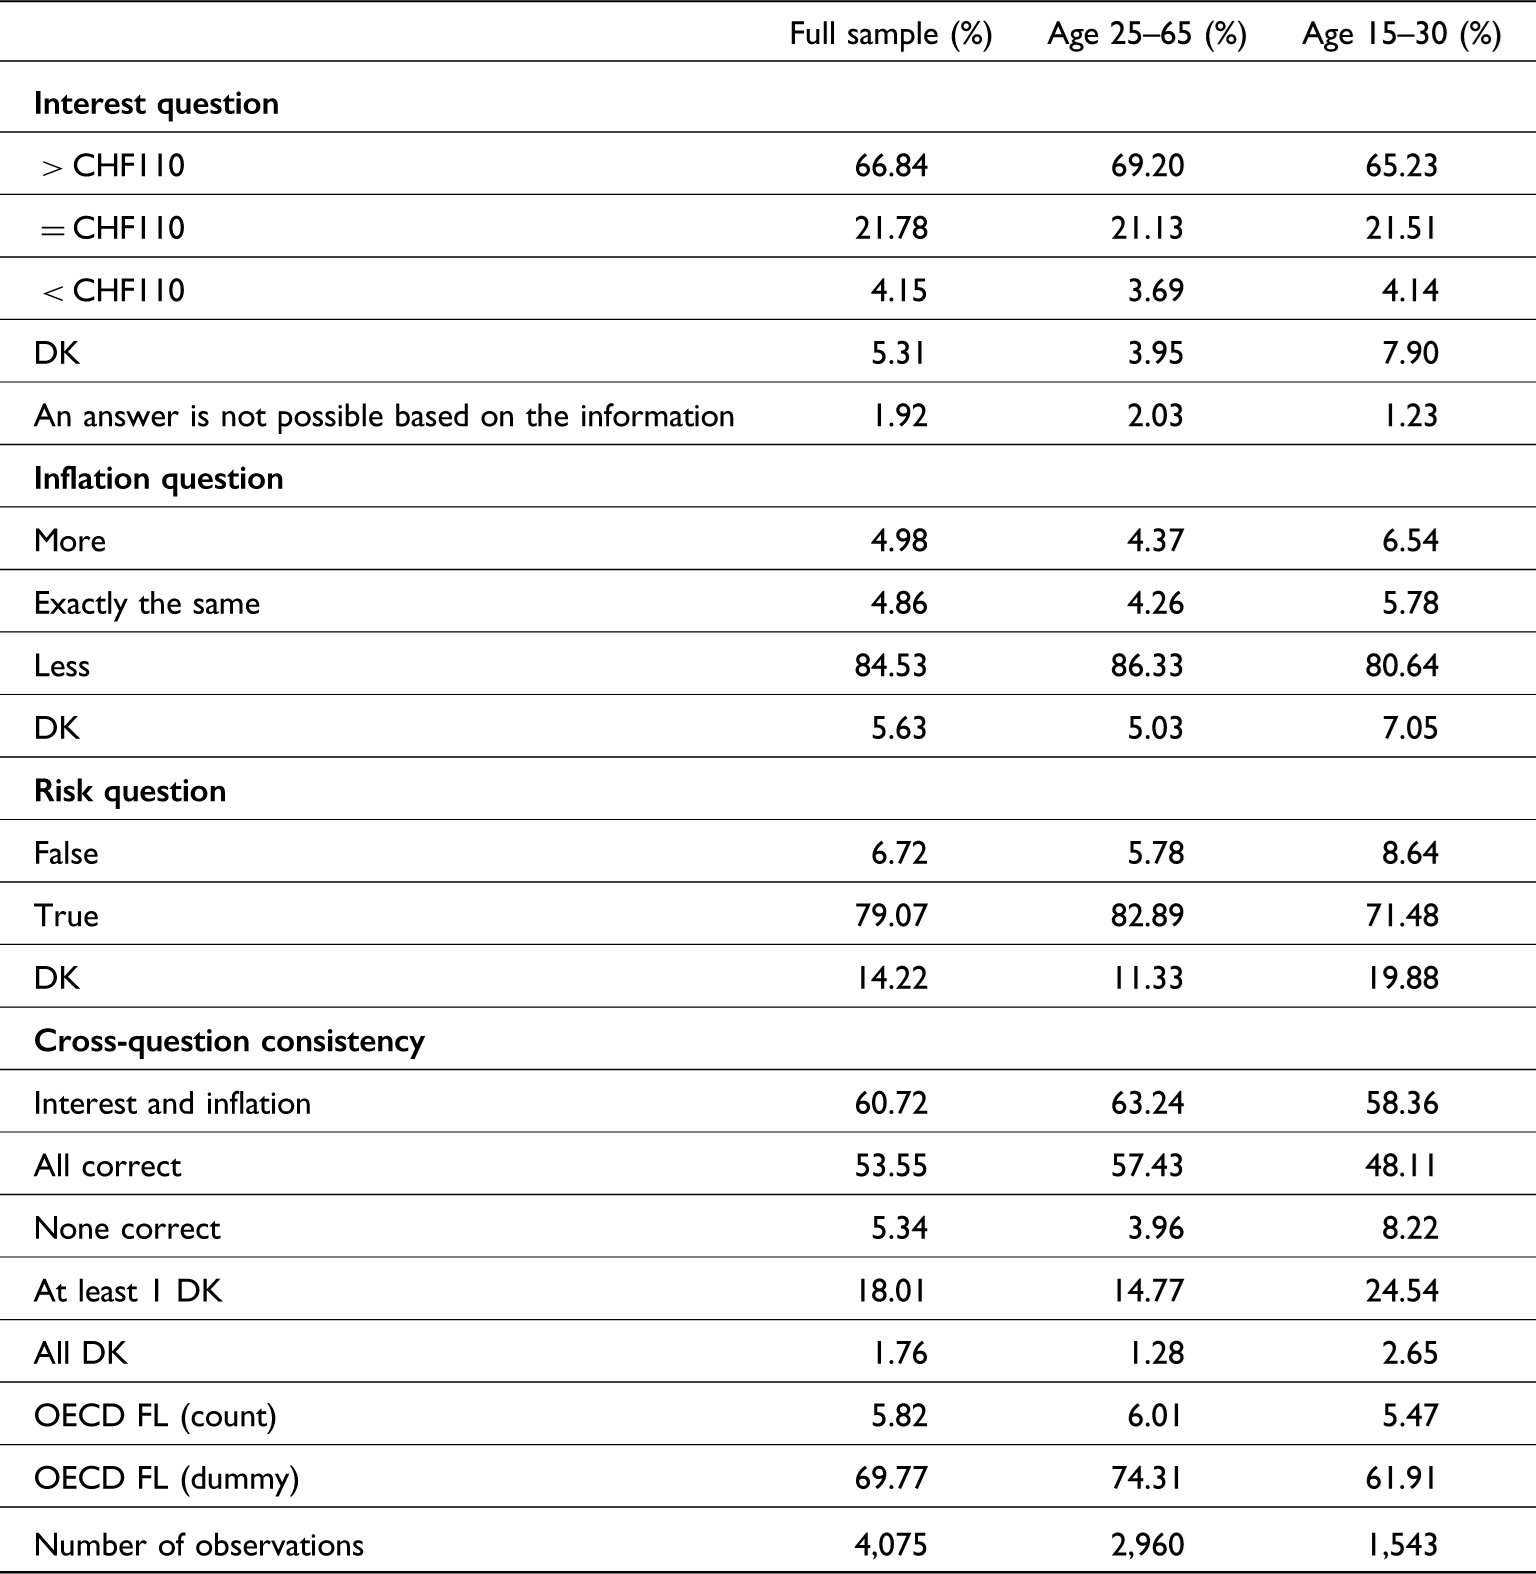
The answers to these financial literacy questions are presented in Table 1; it provides averages for the full sample and a breakdown for a subsample of the working-age population (ages 25–65 years) and another subsample of the oversampled younger respondents close to labor market entry (15–30 years old). Results reveal that the question on inflation has the highest share of correct answers (about 84% in the whole sample), followed by the question on risk diversification with 79 percent of respondents answering correctly. In contrast, understanding of interest compounding is significantly lower, with only 66 percent of correct responses.
Summary statistics of the answers to the financial literacy questions (%)

Table 1. Long description
The table presents summary statistics of the answers to financial literacy questions, broken down by full sample, age 25-65, and age 15-30. It includes percentages for responses to interest, inflation, and risk questions, as well as cross-question consistency. The table has 15 rows and 4 columns. Column headers are Full sample (%), Age 25-65 (%), and Age 15-30 (%). Row labels include categories such as Interest question, Inflation question, Risk question, and Cross-question consistency, with subcategories for each. Notable trends include higher percentages of correct answers in the age 25-65 group compared to the age 15-30 group. The table also includes notes explaining the distributions and the OECD financial literacy (dummy) variable.
Notes: Distributions of responses to financial literacy questions in the full sample, for those aged 25–65 years (working age population), and for younger respondents (oversampled in our survey). OECD FL (dummy) is a categorical variable that takes the value 1 if a respondent has answered correctly at least 5 out of the 7 questions in the OECD financial literacy questionnaire. All percentages are weighted. DK indicates respondents who do not know the answer.
It is noteworthy that a considerable share of respondents selects the “don’t know” option, in addition to those giving incorrect answers. The question on risk-diversification, in particular, displays a 14 percent rate of “don’t know” answers, which is again consistent with earlier, small sample, evidence for the German speaking part of Switzerland by Brown and Graf (Reference Brown and Graf2013). These patterns suggest that low financial literacy is not only driven by a high share of incorrect answers, but it is also reflected in respondents’ uncertainty or lack of confidence when confronted with financial concepts. Although interpretations of “don’t know” responses must be made with care, existing literature offers several plausible and empirically supported interpretations. It may signal generally low self-confidence or uncertainty, which is especially common among women and younger respondents, as shown by e.g., Bucher-Koenen et al. (Reference Bucher-Koenen, Alessie, Lusardi and Van Rooij2025). It may also signal low familiarity or exposure to financial concepts in daily life, suggesting not only a lack of factual knowledge but also a deeper disengagement with financial matters, or it may signal task avoidance, particularly when questions are perceived as too technical or unfamiliar. Thus, although “don’t know” responses reflect uncertainty, they are not necessarily equivalent to a lack of cognitive ability – they can also signal self-perceived inadequacy or limited financial socialization, which are all important in understanding financial behavior.
Results also show that the share of correct responses varies substantially across age, with the younger labor market entrants (aged 15–30) showing lower understanding of all three concepts, likely due to the limited exposure of these respondents to financial decision-making so far in their life. The share of respondents who reported that they do not know the answer is also considerably higher in this age groups. In contrast, the total working-age individuals exhibit higher comprehension across all categories, possibly reflecting greater life experience and financial knowledge that was acquired in a learning by doing fashion.
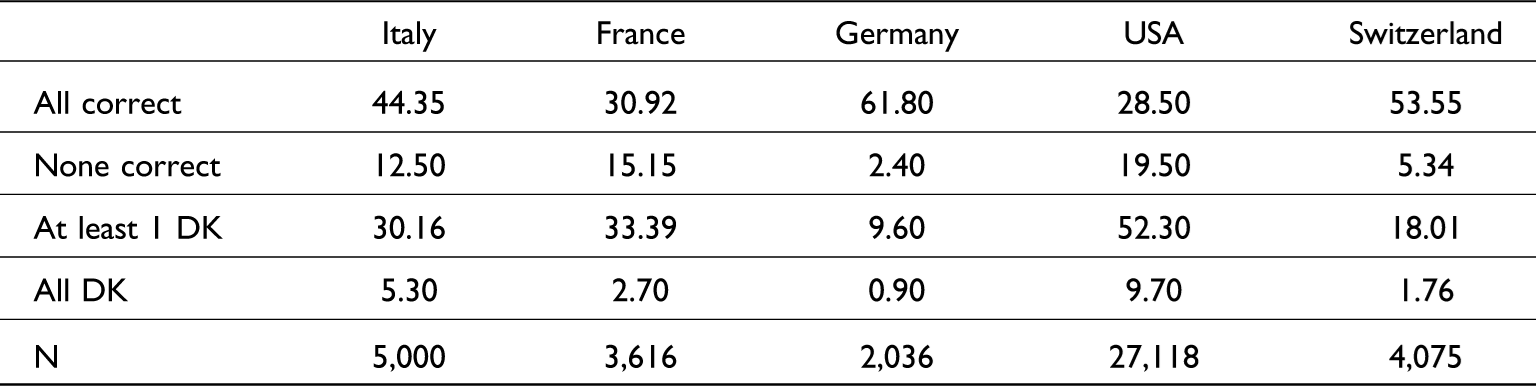
If we look at the share of individuals who answered our three financial literacy questions correctly, we find that about 54 percent of respondents in the full sample were correct in all three answers. These results place Switzerland among the top-performing countries in the world, but are generally in line with an earlier, small sample study of Brown and Graf (Reference Brown and Graf2013),Footnote 6 which was however limited to the German-speaking regions of Switzerland. Regarding its international ranking, Switzerland, with 54 percent of all correct answers, ranks well above the developed countries such as the USA, where, according to Lusardi and Streteer (Reference Lusardi and Streeter2023), less than 30 percent of the respondents got all three answers correct. Compared to its European neighboring countries, Switzerland performs better than Italy and France, in terms of both the share of individuals correctly answering our three financial literacy questions and the share of individuals who “do not know” the correct answers, whereas it is placing slightly below the financial literacy scores of Germany (see Table 2).Footnote 7 As suggested by Brown and Graf (Reference Brown and Graf2013), these generally high levels of financial literacy are aligned with overall high levels of literacy in the country, showed in the Program for International Student Assessment (PISA). For example, the latest PISA results from 2022 rank Switzerland eight worldwide on the mathematics scale, with mathematics skills being highly correlated with financial literacy (see, e.g., Skagerlund et al Reference Skagerlund, Lind, Strömbäck, Tinghög and Västfjäll2018).Footnote 8
Financial literacy in Italy, France, Germany, the USA, and Switzerland

Table 2. Long description
A table comparing financial literacy across Italy, France, Germany, the USA, and Switzerland. The table has five columns and five rows, including headers. Column headers are Italy, France, Germany, USA, and Switzerland. Row labels are All correct, None correct, At least 1 DK, All DK, and N. Row 1: All correct, Italy 44.35, France 30.92, Germany 61.80, USA 28.50, Switzerland 53.55. Row 2: None correct, Italy 12.50, France 15.15, Germany 2.40, USA 19.50, Switzerland 5.34. Row 3: At least 1 DK, Italy 30.16, France 33.39, Germany 9.60, USA 52.30, Switzerland 18.01. Row 4: All DK, Italy 5.30, France 2.70, Germany 0.90, USA 9.70, Switzerland 1.76. Row 5: N, Italy 5,000, France 3,616, Germany 2,036, USA 27,118, Switzerland 4,075.
Notes: The reported percentages are taken from Bottazzi and Oggero (Reference Bottazzi and Oggero2023) for Italy, Arrondel et al. (Reference Arrondel, Debbich and Savignac2013) for France, Bucher-Koenen et al. (Reference Bucher-Koenen, Janssen, Knebel and Tzamourani2023) for Germany, Lusardi and Streeter (Reference Lusardi and Streeter2023) for the USA, and our own calculations for Switzerland. Figures are weighted. DK indicates respondents who do not know the answer.
However, although Switzerland scores high for international standards, still around half of the population is not able to answer three relatively simple questions on financial matters, and the country performs below the highest-ranking countries such as Norway and Sweden, with about 70 percent of all correct answers (see Klapper et al. Reference Klapper, Lusardi and Van Oudheusden2015, World Report). Thus, it is important to study which groups are particularly weak and may therefore drive these results.
3.2 Who knows the least? Differences across sociodemographic groups and languages
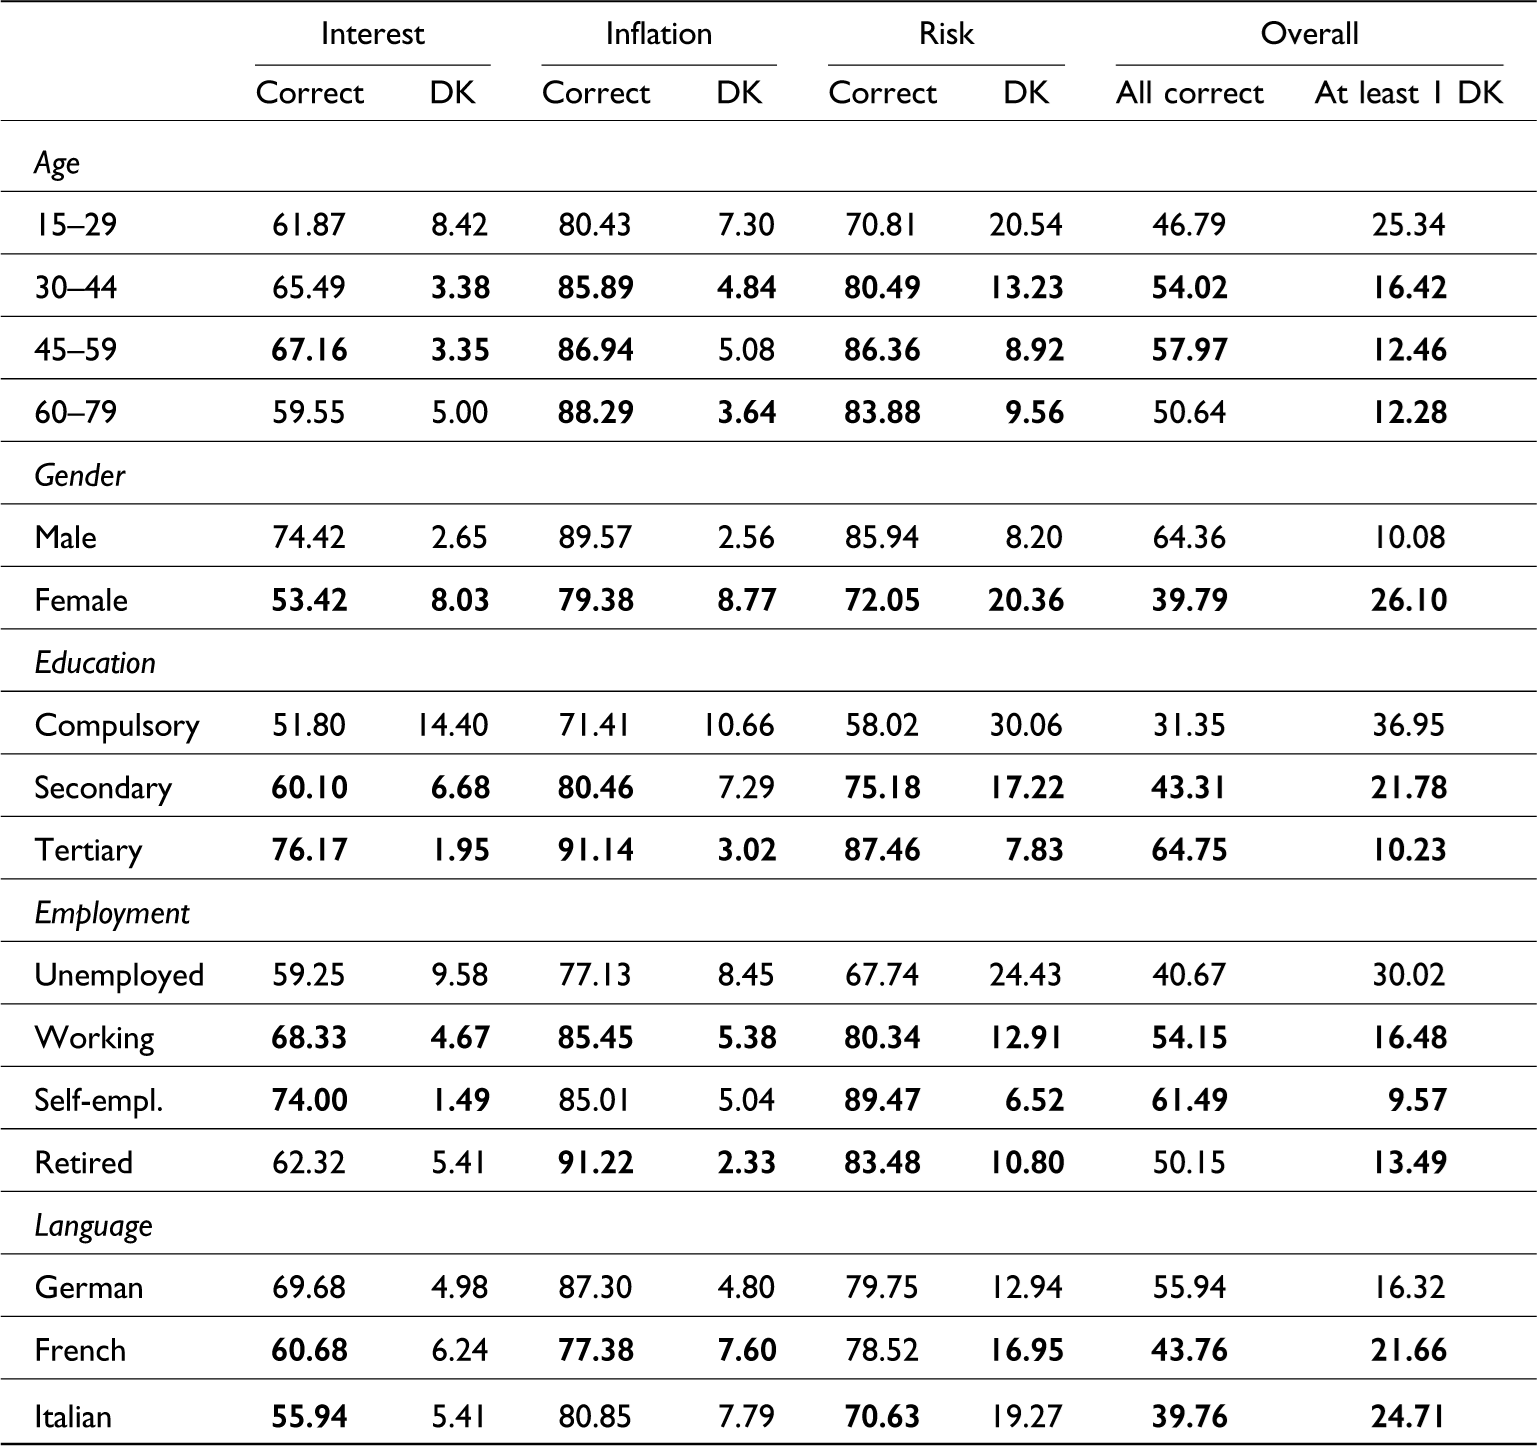
Next, we look at the heterogeneity in financial literacy, to understand how the level of financial literacy differs across sociodemographic groups. Table 3 reports the shares of correct answers, and the share of “do not know” answers to the three financial literacy questions. Results are broken down by age, gender, education level, employment status, and language of the respondent, and significant differences are underlined in bold. The findings are consistent not only with results from other studies (e.g., Lusardi and Mitchell Reference Lusardi and Mitchell2014), but we also find some peculiarities of the Swiss setting.
Distribution of responses to financial literacy questions by individual characteristics (%)

Table 3. Long description
The table presents the distribution of responses to financial literacy questions by individual characteristics, broken down by age, gender, education level, employment status, and language. It includes percentages of correct answers and do not know (DK) responses for three topics: interest, inflation, and risk. The table has 21 rows and 10 columns. Column headers are Interest Correct, Interest DK, Inflation Correct, Inflation DK, Risk Correct, Risk DK, Overall All correct, and Overall At least 1 DK. Row labels include age groups (15-29, 30-44, 45-59, 60-79), gender (Male, Female), education level (Compulsory, Secondary, Tertiary), employment status (Unemployed, Working, Self-employed, Retired), and language (German, French, Italian). Each row provides specific percentages for correct and DK responses in each category, along with overall percentages for all correct answers and at least one DK response.
Notes: All percentages are weighted. DK indicates respondents who do not know the answer, at least 1 DK indicates respondents who answered at least one don’t know in the three questions. Numbers in bold denote a coefficient that is statistically different from the reference group (t-tested), with p < 0.01. Reference groups are, respectively: the 15–29 cohort, males, individuals with at most compulsory education, unemployed, and German-speaking.
As in all major advanced economies, financial literacy shows a nonlinear, U-shaped relationship with age (Lusardi and Mitchell Reference Lusardi and Mitchell2014); knowledge is the highest among individuals of prime working age, with a share of 54–57 percent of correct answers among respondents between 30 and 59 years of age, whereas it is the lowest among the labor market entrants, 15–29 years old.Footnote 9 Although the interest question shows the lowest response rate among Generation Z and Millennials, the gap in knowledge between the young cohort and the rest of the population is most pronounced (and statistically significant) for the risk diversification question – both in terms of correct responses and “don’t know” answers. Overall, although the lower knowledge could be due to a lack of experience in financial decisions, it is concerning that more than half of the young Swiss in our sample are unable to correctly answer three basic financial literacy questions, despite being at an age where early financial decisions are already taken and can have long-term consequences.
Relevant differences in financial literacy also emerge across genders: men significantly outperform women in all three questions, often by a large margin. Although this is a trend consistently confirmed by global findings in financial literacy studies (Lusardi and Mitchell Reference Lusardi and Mitchell2014, Bucher-Koenen et al. Reference Bucher-Koenen, Lusardi, Alessie and Van Rooij2017, Davoli and Rodriguez-Planas Reference Davoli and Rodriguez-Planas2025a), the gender gap in financial knowledge in Switzerland appears wider than in countries with comparable financial literacy levels, like Germany (Bucher-Koenen et al. Reference Bucher-Koenen, Janssen, Knebel and Tzamourani2023). The share of women answering correctly our three financial literacy questions is 20 percentage points below that of men, and the percentage of women declaring they “do not know” to at least one question is also staggering, potentially suggesting a particular lack of confidence in financial decision-making (Bucher-Koenen et al. Reference Bucher-Koenen, Alessie, Lusardi and Van Rooij2025).
The level of financial knowledge is also strongly correlated with individuals’ education. For example, the share of correct answers among individuals with a “tertiary education” is about 65 percent, more than double the share of correct answers by those with “no education beyond compulsory education.” This gap by educational level is even wider for the answers on inflation and risk diversification. Moreover, as it clearly emerges from Table 3, all the differences across educational levels are statistically significant. However, this positive correlation is not surprising and cannot be interpreted as a causal effect because the education level may just be a proxy for differences in individuals’ cognitive abilities and different individuals’ backgrounds, which should thus be studied more in-depth in future research.
In addition, we observe differences in financial literacy by employment status; employed and self-employed respondents are more likely to correctly answer the three questions and less likely to choose “don’t know” compared with the unemployed. This possibly reflects greater financial confidence or exposure through work experience. However, caution is warranted in interpreting the results for self-employed as the group is only 5 percent of the whole sample (see Appendix Table 1) compared with approximately 10 percent in the broader Swiss labor market according to official statistics (see FSO 2024). Given this underrepresentation and the small absolute sample size, the findings for the self-employed should be viewed as suggestive rather than conclusive evidence.
Finally, a specific characteristic of Switzerland is its multilingual composition. Prior studies document long-standing cultural and economic differences across the three main language groups (German, French, and Italian), affecting attitudes toward work, international trading behaviors, gender norms, social preferences, and fertility (e.g., Eugster et al. Reference Eugster, Lalive, Steinhauer and Zweimüller2017; Egger and Lassmann Reference Egger and Lassmann2015; Steinhauer Reference Steinhauer2018). In the financial literacy domain, Brown Henchoz and Spycher (Reference Brown, Henchoz and Spycher2018) find significantly lower levels of financial literacy among French-speaking secondary students, likely reflecting differences in parental financial socialization. Our results show differences along the language borders as well, as respondents from the German-speaking regions generally show significantly higher levels of financial literacy compared with their French- and Italian-speaking counterparts. The German speakers are also the ones least likely to answer “do not know” to any of the questions. Overall, these stark differences in financial literacy across survey language are surprising, given that the respondents are all living and working in the same country, with the same legal framework, the same overall schooling systems, the same labor market regulations, and many other commonalities.
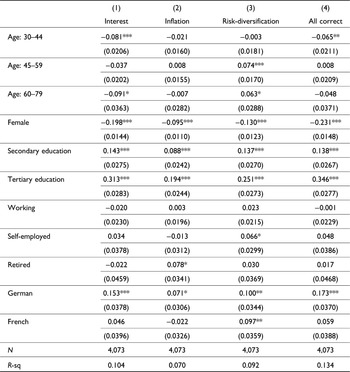
To better explore financial literacy and clarify the relative importance of different determinants, we perform multivariate analysis. Table 4 reports results from Ordinary Least Squares (OLS) regressions separately for the three financial literacy questions and for all three questions together. The dependent variables are dummies that take the value 1, if the respondent answers the respective financial literacy questions correctly (columns 1–3) or all three questions correctly (column 4). In all regressions, the explanatory variables are a set of demographic characteristics, including age, gender, educational attainment, employment status, and survey language.
OLS of financial literacy determinants

Table 4. Long description
A table with the results of OLS regressions for financial literacy determinants. The table has 12 rows and 4 columns. The columns are labeled as Interest, Inflation, Risk-diversification, and All correct. The rows are labeled with different demographic characteristics: Age: 30-44, Age: 45-59, Age: 60-79, Female, Secondary education, Tertiary education, Working, Self-employed, Retired, German, French. Each cell contains regression coefficients with standard errors in parentheses. Notable trends include significant coefficients for Tertiary education across all columns, and negative coefficients for the Female category. The table also includes the number of observations (N) and the R-squared value for each regression.
Notes: Results are weighted. The dependent variable is a dummy variable taking the value 1 if the respondents answered correctly to the corresponding financial literacy question (columns 1–3) or all the three questions (column 4). The reference categories are 15–29 years old, male, compulsory education, unemployed, and Italian. Robust standard errors in parentheses. ***p < 0.01, **p < 0.05, *p < 0.1.
The results show mixed findings on the relationship between age and financial literacy. The positive coefficient for age shows that the older the individual, the higher the score on risk diversification knowledge (the reference group here being individuals 15–30 years of age), whereas for the interest and inflation question, the relationship goes in the opposite direction. Surprisingly, on the one hand, given the evidence presented in Table 3, the coefficient for age is only weakly significant. On the other hand, both gender and education display a strong link to financial literacy, both in magnitude and statistically. For upper secondary and tertiary education levels we find higher financial literacy results compared with lower secondary education level, suggesting that higher educational levels correlate with a better understanding of all financial literacy concepts. Unlike the coefficient for age, the coefficients on educational level are highly statistically significant. The negative and significant coefficient for the female dummy indicates that women have lower knowledge than men even after accounting for other demographic variables.Footnote 10
Finally, from the perspective of the respondents’ language the German-speaking individuals – except for the risk-diversification question – perform significantly better than Italian-speaking ones, whereas there is no noticeable difference between the Italian- and French-speaking individuals. This variance by language region may reflect different factors, spanning from differences in educational trajectories, economic environments, and social norms across cantons. A possible explanation for the observed differences in financial literacy across the survey language could be related to the language as such, respectively the translations of survey questions. Although efforts are made to ensure that survey questions are consistent across languages (OECD 2022), subtle semantic differences might arise due to the nuances of each language. Differences in phrasing or interpretation could influence the way respondents understand and answer financial literacy questions, leading to slightly varied understandings of the questions among respondents from German-, French-, and Italian-speaking regions (Lenzner et al. Reference Lenzner, Kaczmirek and Lenzner2010). For example, certain financial terms or concepts might not translate perfectly or carry the same connotations across languages. Furthermore, certain linguistic structures may inherently make it easier or harder to grasp complex financial concepts, which could lead to discrepancies in the responses (Harkness et al. Reference Harkness, Villar and Edwards2010, Davoli Reference Davoli2023). These factors could thus partially account for the lower financial literacy scores among French- and Italian-speaking respondents and might explain the patterns observed in the survey, beyond cultural and economic differences.
An alternative explanation for the observed differences in financial literacy across the Swiss language regions relates to the role of cultural factors. Although there is a growing interest in the cultural determinants of household financial behavior,Footnote 11 less is known about whether culturally rooted social norms also affect individuals’ financially knowledge. Recent studies have begun exploring this link, finding evidence that culture influences literacy outcomes across both gender (Bottazzi and Lusardi Reference Bottazzi and Lusardi2021; Rink et al. Reference Rink, Walle and Klasen2021; Davoli and Rodriguez-Planas Reference Davoli and Rodriguez-Planas2025a) and broader national or linguistic contexts (Davoli and Rodriguez-Planas Reference Davoli and Rodríguez-Planas2020; Brown et al Reference Brown, Henchoz and Spycher2018; Davoli and Rodriguez-Planas Reference Davoli and Rodríguez-Planas2025b). In our survey, spoken language might proxy for such cultural factors, reflecting internalized beliefs and values regarding the importance of gathering information to make informed financial decisions.
Although these are only some of the possible explanations behind this linguistic variation, it is surely worth a deeper investigation as these language differences would likely also apply to cross-country comparisons, which could also suffer from semantic differences.
Further regressions, presented in Appendix Table A.3, include additional explanatory variables, but they all show in general similar result. Interestingly, from the estimation with additional controls, it emerges that both the socio-economic background of the family (proxied by the mother’s education) and a low risk aversion are highly correlated with individuals’ financial literacy, which may hint at the importance of not only socio-economic backgrounds but also personal characteristics.
3.3 Objective versus self-assessed financial literacy
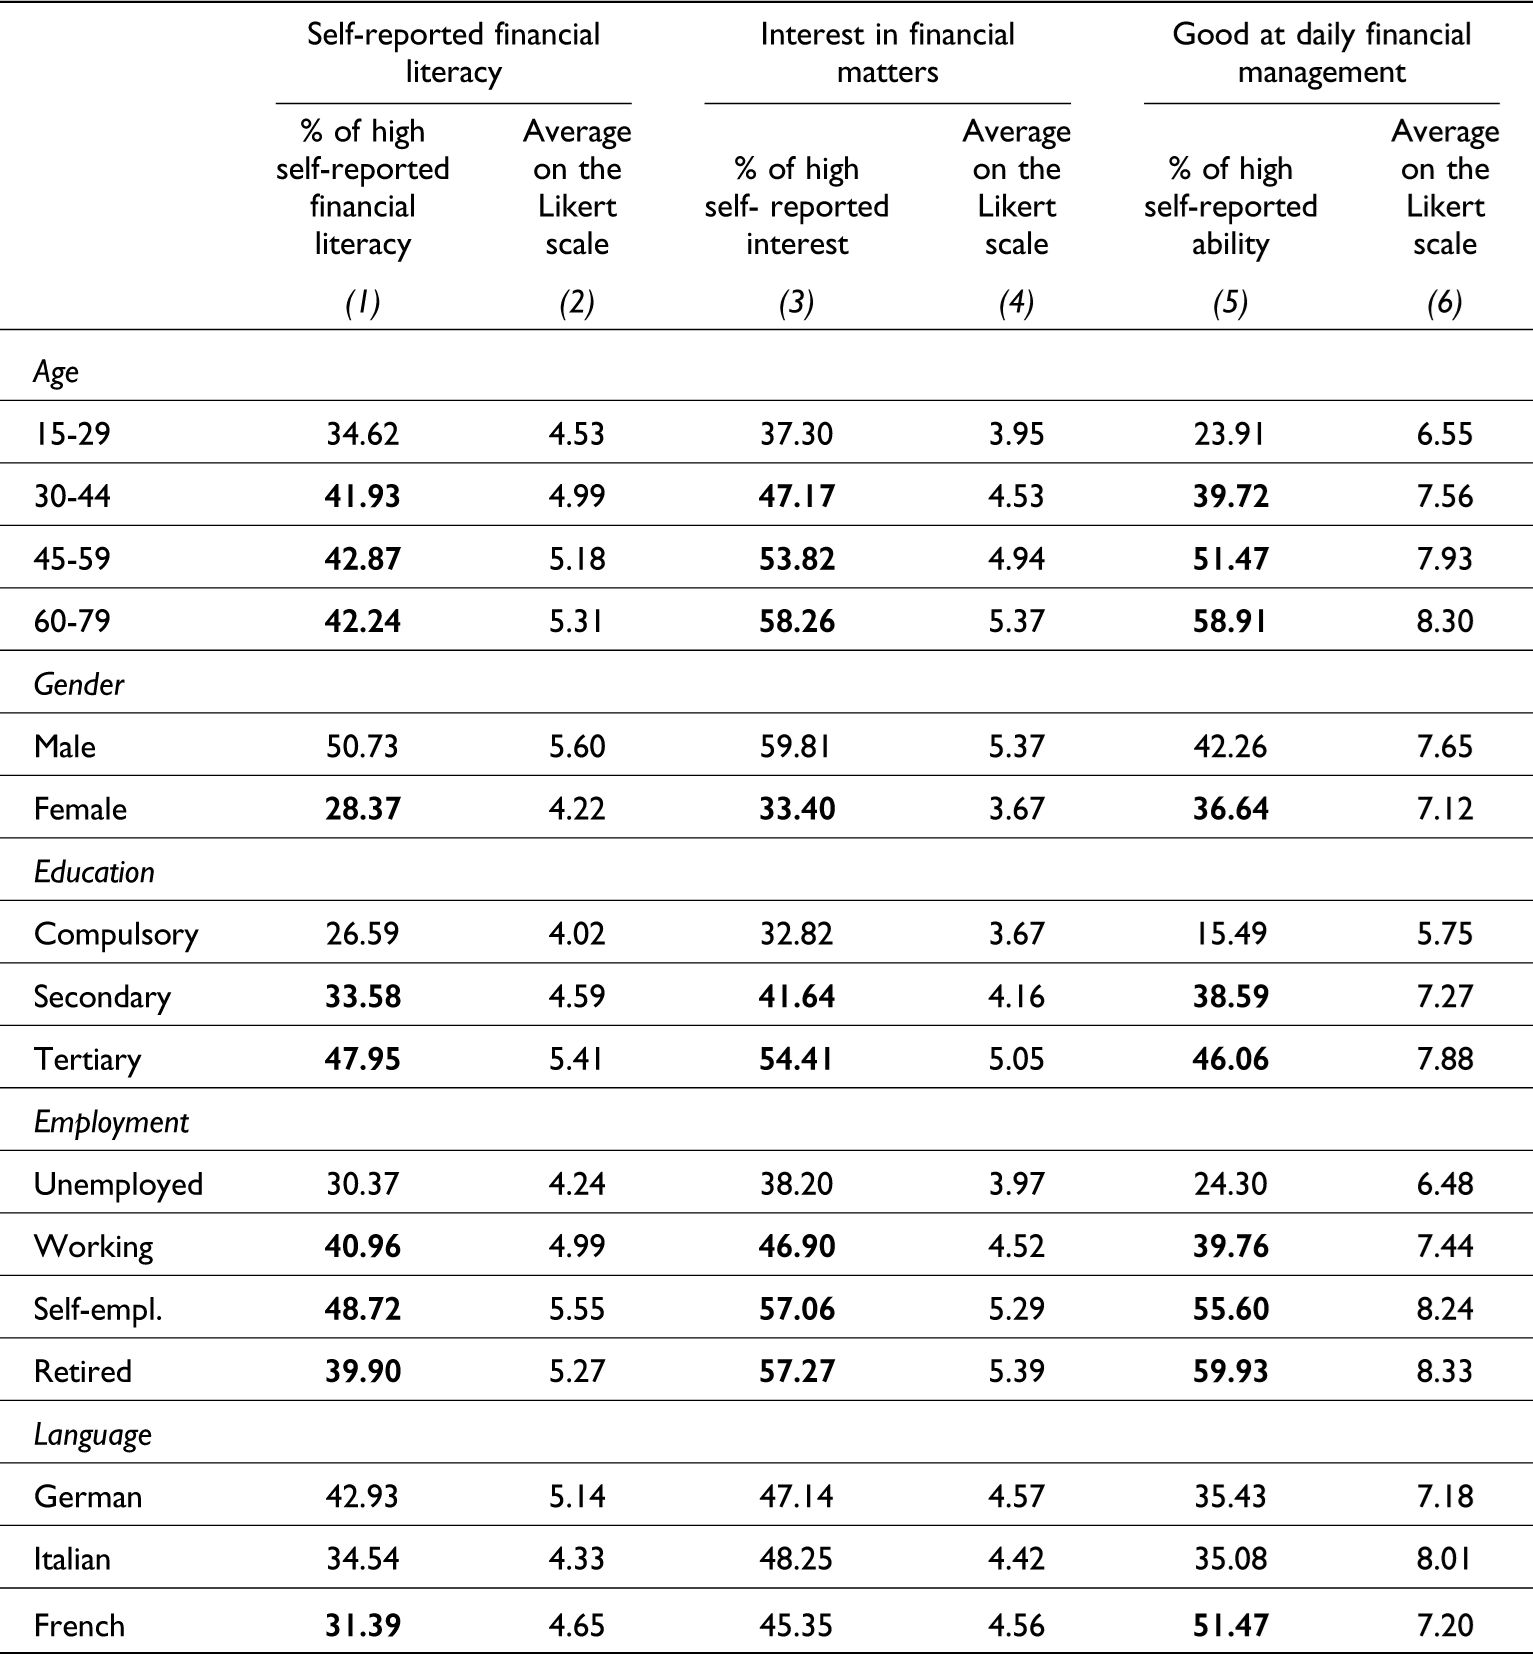
To examine how people perceive their financial literacy and how these perceptions compare with their actual knowledge, we asked survey respondents three questions. First, respondents were asked to rate whether their financial literacy is higher than the average financial literacy in Switzerland, on a scale from 1 (very low) to 10 (very high). Then, respondents were asked to rate their interest in financial matters (“I regularly keep up with economic and financial news”) and whether they are good at dealing with day-to-day financial matters, such as credit and debit cards, again on a scale from 1 (very low) to 10 (very high). The average self-reported level of financial literacy for the full sample is at the value 5, indicating neither particularly bad nor good knowledge, and similarly reported values can be seen for the question on interest in financial matters (see Appendix Table A.1 for summary statistics on the variable). To the contrary, the average answer to the question about familiarity with daily financial issues is 7, pointing to a generally high confidence of the respondents in their ability to deal with their day-to-day financial matters.
In Table 5, we show that the wide gender gaps in actual financial knowledge are confirmed by significant gender gaps in perceived financial knowledge, whether we measure perceived financial knowledge in terms of interest or self-reported familiarity with financial matters.Footnote 12 Women have a considerably lower level of self-reported financial knowledge than men. Less than 30 percent of women assess their financial knowledge to be high, whereas this figure is over 50 percent for men. A similar pattern emerges for the reported interest in financial matters. Hence, women’s perception of own financial literacy relates strongly with the financial literacy objectively measured by our three financial literacy questions.
Distribution of self-reported financial literacy, interest in, and familiarity with financial matters by individual characteristics (%)

Table 5. Long description
The table presents data on self-reported financial literacy, interest in financial matters, and daily financial management across various demographics. It includes six columns: percentage of high self-reported financial literacy, average on the Likert scale for financial literacy, percentage of high self-reported interest, average on the Likert scale for interest, percentage of high self-reported ability in daily financial management, and average on the Likert scale for daily financial management. The rows are categorized by age, gender, education, employment, and language. Each row provides specific percentages and average Likert scale values for these categories. For example, the age group 15-29 has 34.62 percent high self-reported financial literacy with an average Likert scale value of 4.53, while the age group 60-79 has 42.24 percent high self-reported financial literacy with an average Likert scale value of 5.31. The table highlights variations in financial literacy and interest across different demographics.
Notes: All percentages are weighted. The first two columns correspond to answer to the question “I rate my overall knowledge about financial matters extremely high, as compared with other adults in Switzerland.” Columns (3) and (4) to the question: “I regularly keep up with economic and financial news,” and columns (5) and (6) to the question “I am good at dealing with day-to-day financial matters such as checking accounts, credit and debit cards, and tracking expenses.” Columns (1), (3), and (5) report the percentage of individuals for each subgroup who declare a high financial literacy/interest/ability to deal with financial matters. Numbers in bold denote a coefficient that is statistically different from the reference group (t-tested), with p < 0.01. Reference groups are, respectively: the 15–29 cohort, males, individuals with at most compulsory education, unemployed, and German-speaking. Columns (2), (4), and (6) report the average Likert scale value for each subgroup.
We also find important differences in self-reported knowledge across the three spoken languages. The Italian- and French-speaking respondents had lower actual financial literacy levels than the German-speaking ones (see Table 3), yet their self-rating of financial literacy is comparable with that of German speakers. The average self-rating of French and Italian speakers is 4.6 and 5.1 among German speakers, and this difference is not statistically different from 0, as far as German and Italian speakers are concerned. Similar to Lusardi and Streeter (Reference Lusardi and Streeter2023), these results, while showing simple correlations, raise concerns that when it comes to critical financial decision-making some Swiss may be overconfident, given this observed gap between perception (of own financial knowledge) and reality (objectively measured financial knowledge).
4. Does financial literacy matter for economic well-being?
In this section, we analyze the link between financial literacy and economic well-being, measured with three questions adapted from the OECD (2022) toolkit. The associations between the economic well-being indicators and our three financial literacy questions can be seen in Table 6.
Distribution of financial literacy for different levels of economic well-being (%)

Table 6. Long description
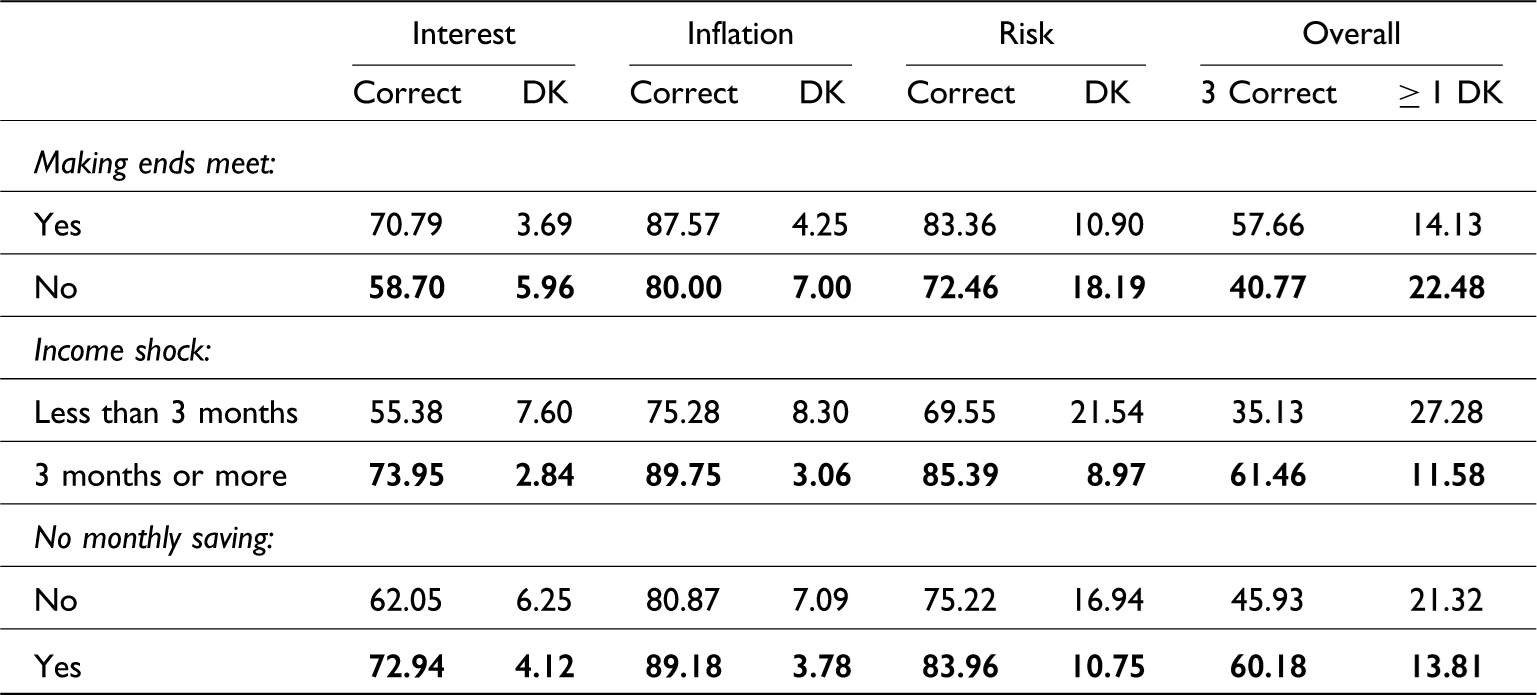
A table comparing financial literacy across different economic well-being levels. The table has 12 rows and 8 columns. Column headers are Interest Correct, Interest DK, Inflation Correct, Inflation DK, Risk Correct, Risk DK, Overall 3 Correct, and Overall >= 1 DK. Row labels are grouped under Making ends meet, Income shock, and No monthly saving. Each group has subcategories: Making ends meet (Yes, No), Income shock (Less than 3 months, 3 months or more), and No monthly saving (No, Yes). Row 1: Making ends meet, Yes, Interest Correct 70.79, Interest DK 3.69, Inflation Correct 87.57, Inflation DK 4.25, Risk Correct 83.36, Risk DK 10.90, Overall 3 Correct 57.66, Overall >= 1 DK 14.13. Row 2: Making ends meet, No, Interest Correct 58.70, Interest DK 5.96, Inflation Correct 80.00, Inflation DK 7.00, Risk Correct 72.46, Risk DK 18.19, Overall 3 Correct 40.77, Overall >= 1 DK 22.48. Row 3: Income shock, Less than 3 months, Interest Correct 55.38, Interest DK 7.60, Inflation Correct 75.28, Inflation DK 8.30, Risk Correct 69.55, Risk DK 21.54, Overall 3 Correct 35.13, Overall >= 1 DK 27.28. Row 4: Income shock, 3 months or more, Interest Correct 73.95, Interest DK 2.84, Inflation Correct 89.75, Inflation DK 3.06, Risk Correct 85.39, Risk DK 8.97, Overall 3 Correct 61.46, Overall >= 1 DK 11.58. Row 5: No monthly saving, No, Interest Correct 62.05, Interest DK 6.25, Inflation Correct 80.87, Inflation DK 7.09, Risk Correct 75.22, Risk DK 16.94, Overall 3 Correct 45.93, Overall >= 1 DK 21.32. Row 6: No monthly saving, Yes, Interest Correct 72.94, Interest DK 4.12, Inflation Correct 89.18, Inflation DK 3.78, Risk Correct 83.96, Risk DK 10.75, Overall 3 Correct 60.18, Overall >= 1 DK 13.81.
Notes: Making ends meet expenses is a dummy variable taking the value 1 if the respondents answered that their income does not cover their living expenses. Income shock is a dummy variable taking the value 1 if the respondents state they could cover their living expenses for a maximum of three months if they lost their source of income. No monthly saving is a dummy variable taking the value 1 if the respondents state they do not have money left over at the end of the month. All percentages are weighted. DK indicates respondents who do not know the answer, ≥ 1 DK indicates respondents who answered at least one don’t know in the three questions. Numbers in bold denote a coefficient that is statistically different from the reference group (t-tested), with p < 0.01. Reference groups are, respectively: income covering living expenses, covering living expenses for less than three months in case of an income shock, not having monthly saving.
To analyze the economic well-being of the respondents, we asked three distinct questions. First, to measure respondents saving behavior, we asked individuals to rate on a Likert scale from 1 to 10 whether the statement “I have money left over at the end of the month” applies to their situation. This question is a good proxy for wealth accumulation (OECD 2022). Altogether, the average response on the Likert scale is 7 (see Appendix Table A.1), meaning that respondents declare a high ability to save.Footnote 13 For those individuals who save less, the share of correct answers is significantly lower in all three questions, indicating a somewhat stronger financial literacy for those with higher savings (Table 6).
Then, respondents were asked two questions to measure their financial fragility (OECD 2022). First, we ask about their ability of making ends meet, i.e., their ability to cover daily expenses.Footnote 14 Twenty-one percent of respondents stated they cannot cover their living expenses, at least sometimes. We show in Table 6 that financial literacy is significantly higher among those who stated they never found themselves in such a situation. Further, we ask: “If you lost your main source of income, how long could you continue to cover your living expenses, without borrowing any money or moving house or similar?” This variable measures how long the individual could cope with losing their main source of income, and it can therefore be seen as a measure of financial fragility.Footnote 15 Considering this income shock variable, about 30 percent of respondents were classified as financially fragile. Financial literacy among the ones more exposed to income shock is significantly lower than for those not so highly exposed, as only 35 percent of the financially fragile individuals responded correctly to our three questions, compared with a share of 61 percent correct answers for the ones not classified as fragile (Table 6).
These findings thus point to the direction that individuals with higher financial literacy are possibly best in control of their finances and their daily expenses.
These results are in line with international literature in showing that more financially literate individuals are more likely to be in a situation of economic well-being. The summary statistics presented in Table 6 indicate that financial literacy is significantly higher among those who can better deal with the adverse economic outcomes measured in this study, and hence we would expect financial literacy to play a positive role in increasing economic well-being. When we focus on the financial fragility question (see three country-study results for the USA, Germany, and Italy, in Appendix Table A.4), once again Switzerland appears to be in the upper tail of the financial knowledge distribution, with 35 percent of the financially fragile and 61 percent of the not financially fragile individuals being able to correctly answer the financial literacy questions. The comparison with the share of correct answers in the USA and in Italy is particularly striking; in these two countries less than 15 percent of the financially fragile population can answer the three basic financial literacy questions, whereas in Switzerland the share of correct response is about twice as large. This is not surprising, as Switzerland shows, on average, much higher levels of financial knowledge in an international comparison and suggesting that financially fragile individuals might be better equipped, in Switzerland as compared with elsewhere, to face economic shocks. These results should be, however, interpreted with some caution as the financial fragility questions are not perfectly comparable across studies. Financial fragility in the German, Italian, and US studies (Appendix Table A.4) is defined by the answer to a question about how confident respondents were that they could come up with $2,000 if an unexpected need arose within the next month. Financial fragility in Switzerland is defined with the answer to a question about how long a respondent could cover living expenses if experiencing an income shock. Although similar in spirit, as both questions address the issue of how individuals face economic shocks, the questions are clearly not identical.
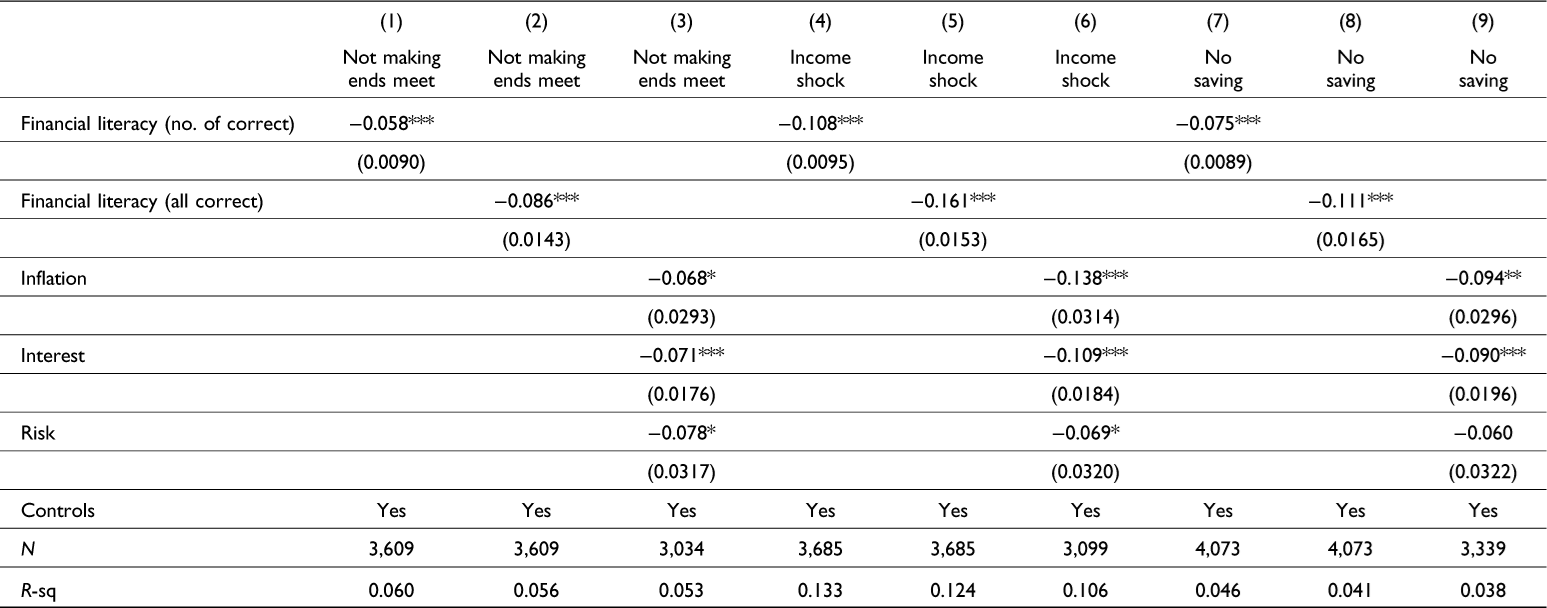
We investigate this further in the regressions reported in Table 7, where we study the link between financial literacy and our measures of economic well-being. Following Lusardi and Mitchell (Reference Lusardi and Mitchell2011), the main explanatory variables include first a continuous variable of the number of questions correctly answered; second, a variable that indicates whether the individuals got all three questions correct; and finally each of the three questions on its own to measure their specific contribution. Other explanatory variables include the respondents’ age, gender, education level indicators, employment status, and language dummies. The results provide evidence of a strong link between the indicators of economic well-being and financial literacy. Only the risk diversification question is weakly significantly related to the three outcome variables. The direction of all estimates is negative, suggesting that being more knowledgeable on the three financial literacy concepts of inflation, interest compounding, and risk-diversification might protect against adverse economic outcomes and put respondents in a position where they are less likely to be financially fragile. These results are – to some extent – comparable with prior results by Estrada-Mejita et al. (Reference Estrada-Mejia, Mejía and Cordoba2023), Bucher-Koenen et al. (Reference Bucher-Koenen, Janssen, Knebel and Tzamourani2023), and Vaahtoniemi et al. (Reference Vaahtoniemi, Buturak, Kalmi and Ruuskanen2023).
Determinants of economic well-being

Table 7. Long description
The table presents the results of regressions analyzing the link between financial literacy and measures of economic well-being. It includes nine columns and several rows, with column headers indicating different economic well-being outcomes: Not making ends meet, Income shock, and No saving. The rows list various financial literacy measures: Financial literacy (number of correct answers), Financial literacy (all correct), Inflation, Interest, and Risk. Each cell contains regression coefficients with standard errors in parentheses. Controls are included in all regressions. The table shows that higher financial literacy is associated with better economic well-being, with negative coefficients indicating a protective effect against adverse economic outcomes. Notable trends include significant negative coefficients for financial literacy measures across all outcomes, with the risk diversification question showing weaker significance.
Notes: Results are weighted. The dependent variables are: a dummy variable taking the value 1 if the respondents answered that their income does not cover their living expenses (columns 1–3); a dummy variable taking the value 1 if the respondents state they could cover their living expenses for a maximum of three months if they lost their source of income (columns 4–6); a dummy variable taking the value 1 if the respondents state they do not have money left over at the end of the month (columns 7–9). All regressions control for age, gender, education, language region, and employment status. Robust standard errors are in parentheses. ***p < 0.01, **p < 0.05, *p < 0.1.
Financial literacy is thus found to play an important role in enhancing individuals’ economic well-being. Having higher financial literacy is correlated with being better able to save, make ends meet, and cope with income shocks. Of the individual financial literacy measures, the understanding of inflation and interest compounding is highly significant in all estimations, whereas the understanding of risk diversification is weakly related to the measures of economic well-being. This is contrary to what Lusardi and Streeter (Reference Lusardi and Streeter2023) find for the USA and Vaahtoniemi et al. (Reference Vaahtoniemi, Buturak, Kalmi and Ruuskanen2023) for Finland.Footnote 16 Specifically, risk knowledge in these studies was found significant in facing major expenses and fragility to income shocks, whereas the inflation and interest questions, although negative, were not significantly related to the economic outcome variables studied.
Focusing on the set of explanatory variables, heterogeneous patterns emerge (see Table A.5 for the full set of estimates). The probability of making ends meet is higher for older individuals, for individuals with higher levels of education, for individuals with the Swiss citizenship, and for German- and French-speaking respondents (columns 1–3). Being older, having tertiary education, as well as individual preferences (risk-loving attitudes and long-term orientation), mother background, and being married are positively related to the ability to cope with income shocks, whereas being a French speaker is negatively related to this outcome (columns 4–6). Relative to being unemployed, being in the active workforce is correlated with a higher likelihood of savings, as well as higher risk-loving attitudes and long-term orientation (columns 7–9). Interestingly, although gender is a strong predictor of financial literacy, confidence, and interest in financial matters, we do not observe significant gender differences for our economic well-being indicators once we control for financial literacy. This indicates that women, while being on average more concerned about financial matters, having on average lower perceived financial literacy, might overall act more carefully with financial matters and, hence, do not display higher probabilities of ending in a financially fragile situation, conditional on their financial literacy.Footnote 17 It should be stressed that these OLS estimates highlight simple correlations among literacy and behaviors. In fact, financial literacy itself might be a choice variable, with people deciding to invest (or not) in financial literacy to be better able to save, face income shocks, and avoid financial fragility. However, although we do not have a feasible instrument to strengthen our claims, it has quite convincingly been observed that OLS appears to underestimate the true effect of financial literacy on behavior (see the discussion in the work of Lusardi and Mitchell Reference Lusardi and Mitchell2014), as compared with Instrumental Variables (IV) estimates, and this might as well be the case in our setting.
5. Conclusion
This article uses data from a novel representative survey to examine financial literacy among the Swiss population. We reveal interesting insights into the financial understanding across various demographics within the Swiss population and provide a comprehensive look at how well individuals in Switzerland comprehend three fundamental financial concepts: interest rates, inflation, and risk diversification. Our findings underscore that the Swiss exhibit, on average, high levels of financial literacy, with over 50 percent of respondents correctly answering questions about interest, inflation, and risk diversification, levels much higher than those observed in the USS (Lusardi and Stretcher Reference Lusardi and Streeter2023), but similar to Germans (Bucher-Koenen et al. 2023).
Despite Switzerland’s high overall financial literacy compared with global standards, there is substantial heterogeneity between groups. We underline the existence of relevant gaps across age groups, gender, and spoken language pointing toward the importance of targeted financial education programs to address these specific gaps. However, causal evidence is needed to be able to make clear predictions of which types of measures are needed for specific socio-economic groups. Educational initiatives could focus on enhancing understanding of complex financial products and the principles of long-term financial planning, which are crucial for making informed financial decisions. An interesting result relates to the linguistic and regional differences observed in financial literacy levels and in financial well-being. These results, pointing at higher financial literacy for German-speaking respondents, suggest on one hand the need for deeper investigations and data collection with the aim of establishing a causal link between culture and financial literacy, and on the other hand that tailored approaches that consider these cultural and regional specificities could enhance the effectiveness of financial education.
Finally, we show that financial literacy is not just an abstract construct, desirable to have, but a crucial skill, as evidenced by its association with economic well-being. Our results suggest that those with higher financial literacy are better able to manage their personal finances, save, and face economic shocks.
Acknowledgments
The authors would like to thank Eric Bettinger, Simon Janssen, Stefan Wolter, two anonymous referees and the Editor Annamaria Lusardi for comments that helped us improve the paper, as well as comments from participants at the Workshop: Personnel Economics and Economics of Education (Zermatt), the Leading House Forschungstag (Zurich), the Leading House Retreat (Marbach), and the Doctoral Seminar at the University of Zurich. This study is partly funded by the Swiss State Secretariat for Education, Research, and Innovation through its “Leading House VPET-ECON: A Research Center on the Economics of Education, Firm Behavior and Training Policies”. All errors are our own.
APPENDIX A
Summary statistics

Table A.1. Long description
A table with summary statistics from a survey aligned with OECD standards. The table has 40 rows and 6 columns. Columns are labeled Obs, Mean, SD, Min, and Max. Rows are categorized by age groups, gender, education level, civil status, employment status, household income, economic well-being, mother education, Swiss citizen, rural area, and language of the test. Each row provides observations, mean, standard deviation, minimum, and maximum values for each category. For example, the age category shows observations of 4075, a mean age of 39.52, a standard deviation of 16.0136, a minimum age of 15, and a maximum age of 79. The table captures detailed demographic and economic data from the survey.
Notes: All statistics are weighted.
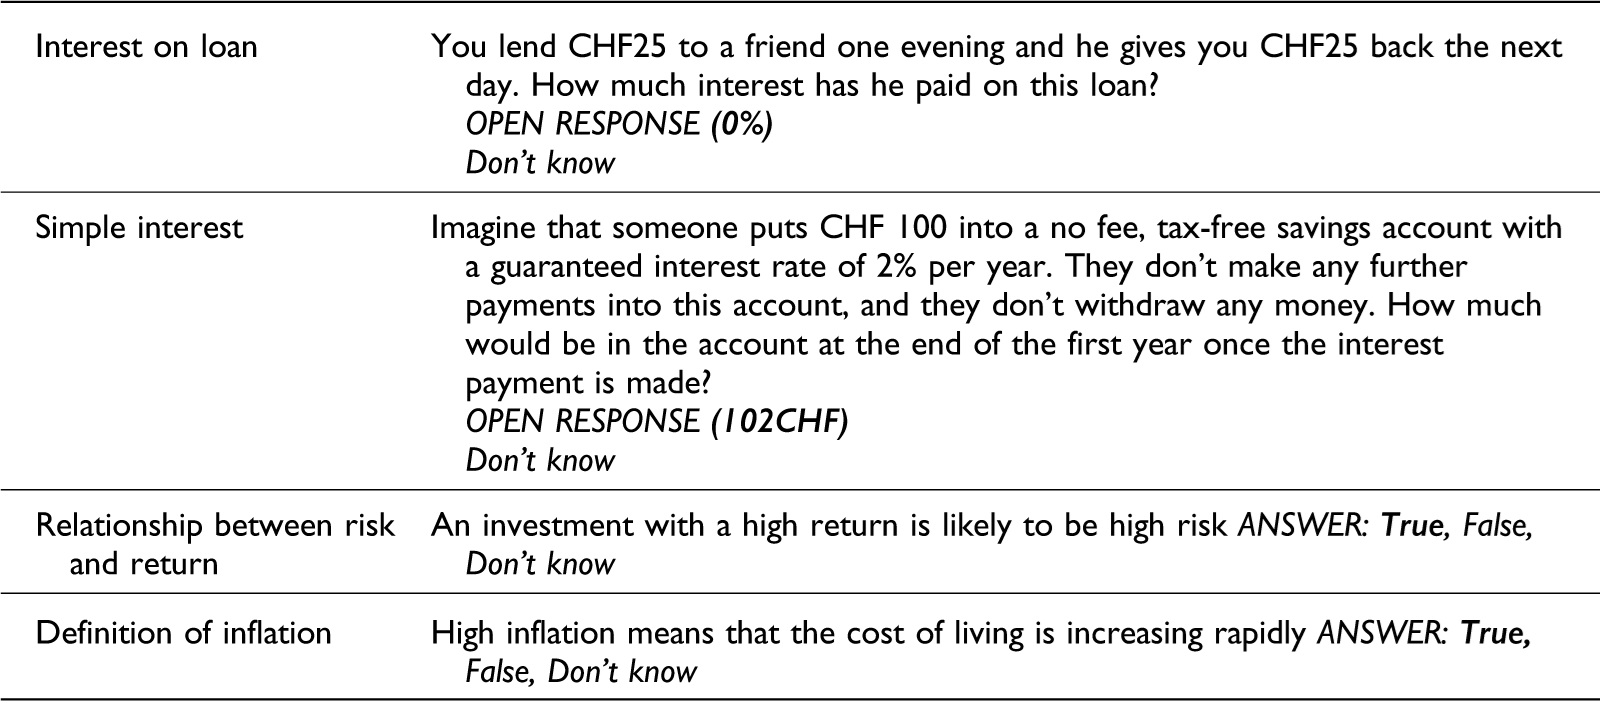
Additional financial literacy questions

Table A.2. Long description
The table has four rows and four columns. The columns are labeled ‘Interest on loan’, ‘Simple interest’, ‘Relationship between risk and return’, and ‘Definition of inflation’. The rows present different financial literacy questions and their possible answers. Row 1: Interest on loan, You lend CHF25 to a friend one evening and he gives you CHF25 back the next day. How much interest has he paid on this loan? OPEN RESPONSE (0 percent) Don’t know. Row 2: Simple interest, Imagine that someone puts CHF 100 into a no fee, tax-free savings account with a guaranteed interest rate of 2 percent per year. They don’t make any further payments into this account, and they don’t withdraw any money. How much would be in the account at the end of the first year once the interest payment is made? OPEN RESPONSE (102 CHF) Don’t know. Row 3: Relationship between risk and return, An investment with a high return is likely to be high risk ANSWER: True, False, Don’t know. Row 4: Definition of inflation, High inflation means that the cost of living is increasing rapidly ANSWER: True, False, Don’t know.
Notes: Additional financial literacy questions are part of the OECD/INFE 2022 Questionnaire.
OLS of financial literacy determinants: further explanatory variables

Table A.3. Long description
A table with four columns and multiple rows, detailing the determinants of financial literacy. The columns are labeled as Interest, Inflation, Risk, and All correct. Each row represents different variables such as age groups, gender, education level, employment status, risk orientation, and geographical location. The table includes coefficients and standard errors for each variable. Notable trends include the significant impact of education level and risk aversion on financial literacy. For example, tertiary education shows a positive correlation with all correct answers, while being female shows a negative correlation. The table also includes variables like long-term orientation and nationality, with Swiss nationality showing a positive correlation with interest and all correct answers.
Notes: Results are weighted. The dependent variable is a dummy variable taking the value 1 if the respondents answered correctly to the corresponding financial literacy question (columns 1–3) or all the three questions (column 4). The reference categories are 15–29 years old, male, compulsory education, unemployed, foreigner, mother with only compulsory education, single, urban, and Italian. Robust standard errors are in parentheses. ***p < 0.01, **p < 0.05, *p < 0.1.
Financial literacy and financial fragility in Italy, Germany, and the USA

Table A.4. Long description
The table presents data on financial fragility and financial literacy in Italy, Germany, the US, and Switzerland. It has four columns and four rows, including headers. The columns are labeled Italy, Germany, US, and Switzerland. The rows are labeled Financially fragile, Not financially fragile, and N. Row 1: Financially fragile, Italy 12.50, Germany 49.20, US 13.40, Switzerland 35.13. Row 2: Not financially fragile, Italy 26.90, Germany 65.30, US 36.60, Switzerland 61.46. Row 3: N, Italy 5000, Germany 2036, US 27118, Switzerland 4075.
Notes: The table report the percentage of respondents within the two groups (respectively: respondents who are financially fragile and respondents who are not financially fragile) who correctly answered to the three questions on financial literacy. The reported percentages are taken from Bottazzi and Oggero (Reference Bottazzi and Oggero2023) for Italy, Bucher-Koenen et al. (Reference Bucher-Koenen, Janssen, Knebel and Tzamourani2023) for Germany, Lusardi and Streeter (Reference Lusardi and Streeter2023) for the USA, and our own calculations for Switzerland. Financial fragility in the Italian and US studies, first three studies, is defined with the answer to a question about how confident respondents were that they could come up with $2,000 if an unexpected need arose within the next month (the proportion of financially fragile individuals in the populations of study is, respectively, 24.1% and 31%), whereas in Germany it is defined as the ability to make ends meet (mean value of the variable in the studied population is 0.20). Financial fragility in Switzerland is defined with the answer to a question about how long a respondent could cover living expenses if experiencing an income shock (mean value of the variable in the population is 0.27).
OLS of financial fragility determinants: additional controls

Table A.5. Long description
A table with 18 rows and 3 columns. The columns are labeled as Not making ends meet, Income shock, and No saving. The rows include variables such as Financial literacy, Age groups, Female, Secondary education, Tertiary education, Working, Self-employed, Retired, Risk-lover, Long-term orientation, Swiss, Mother with secondary education, Mother with tertiary education, Married, Separated, Rural, German, French. Each cell contains numerical values representing the coefficients and standard errors for each variable in relation to the columns. Notable trends include significant negative coefficients for Financial literacy across all columns, varying impacts of age groups, and distinct effects of education levels and language spoken.
Notes: Results are weighted. The dependent variables are: a dummy variable taking the value 1 if the respondents answered that their income does not cover their living expenses (column 1); a dummy variable taking the value 1 if the respondents state they could cover their living expenses for a maximum of three months if they lost their source of income (column 2); a dummy variable taking the value 1 if the respondents state they do not have money left over at the end of the month (column 3). The reference categories are 15–29 years old, male, compulsory education, unemployed, foreigner, mother with only compulsory education, single, urban, and Italian. ***p < 0.01, **p < 0.05, *p < 0.1.
APPENDIX B
Financial literacy questions in the original language
Italian
-
1. Cinque fratelli ricevono oggi in regalo 1.000 franchi svizzeri da dividere tra di loro. Immagini che debbano attendere un anno per poter disporre della loro quota e che il tasso di inflazione annuo sia pari all’5%. Tra un anno, ciascuno con la propria somma, potrà comprare:
-
a) Più di quanto potrebbe comprare oggi
-
b) Le medesime cose;
-
c) Meno di quanto potrebbe comprare oggi
-
d) Non so
-
-
2. Supponga di prestare 25 franchi svizzeri a un suo amico una sera. Il giorno dopo il suo amico le restituisce 25 franchi svizzeri. Quale interesse ha pagato il suo amico sul prestito?
-
___ percento (%)
-
Non so
-
-
3. Supponga di depositare 100 franchi svizzeri in un conto di deposito remunerato a un tasso di interesse garantito del 2% annuo. Su questo conto non sono effettuate altre operazioni, né di deposito né di prelievo. Quanto ci sarà sul conto alla fine del primo anno, dopo il pagamento degli interessi e senza considerare le spese?
-
___ CHF
-
Non so
-
-
4. E dopo 5 anni, quanto sarà la cifra disponibile?
-
a) Più di CHF110
-
b) CHF110
-
c) Meno di CHF110
-
d) È impossibile saperlo con le informazioni disponibili
-
e) Non so
-
-
5. Per ognuna delle seguenti affermazioni, indichi se ritiene che siano vere o false.
-
• Un investimento con un rendimento elevato è probabilmente molto rischioso ANSWER: Vero, Falso, Non so
-
• Inflazione elevata significa che il costo della vita cresce rapidamente ANSWER: Vero, Falso, Non so
-
• Solitamente è possibile ridurre il rischio di investimento acquistando titoli e azioni di molti tipi ANSWER: Vero, Falso, Non so
-
French
-
1. Cinq frères vont recevoir un don à partager d’un montant total de CHF 1 000.
Maintenant, imaginez qu’ils doivent attendre un an pour toucher leur part des CHF 1 000 et que le taux d’inflation se situe à 5 %. Dans un an, seront-ils en mesure d’acheter :
-
a) Plus avec leur part qu’ils ne le pourraient aujourd’hui
-
b) Pour le même montant
-
c) Moins avec leur part qu’ils ne le pourraient aujourd’hui
-
d) Je ne sais pas
-
-
2. Vous prêtez CHF 25 à un ami un soir et il vous rend CHF 25 le lendemain. À combien s’élèvent les intérêts qu’il a payé pour ce prêt?
-
___Pour cent (%)
-
Je ne sais pas
-
-
3. Imaginez que quelqu’un dépose CHF 100 sur un compte d’épargne sans frais, libre d’impôt offrant un taux d’intérêt garanti de 2 % par an. Aucun versement ni aucun retrait n’est effectué sur ce compte. Combien y aura- t-il sur ce compte à la fin de la première année, une fois les intérêts crédités ?
-
_____CHF
-
Je ne sais pas
-
-
4. Quelle somme y aura-t-il sur le compte au bout de cinq ans ? Y aura-t-il:
-
a) Plus de CHF 110
-
b) CHF 110 exactement
-
c) Moins de CHF 110
-
d) Il est impossible de répondre à partir des informations fournies
-
e) Je ne sais pas
-
-
5. Selon vous, les affirmations suivantes sont-elles vraies ou fausses ?
-
• Un investissement avec un rendement élevé est susceptible d’être à haut risque
ANSWER: Vrai, Faux, Ne sais pas
-
• Une inflation élevée signifie que le coût de la vie augmente rapidement
ANSWER: Vrai, Faux, Ne sait pas
-
• Il est généralement possible de réduire le risque des investissements en bourse en diversifiant les actions et les titres
ANSWER: Vrai, Faux, Ne sais pas
-
German
-
1. Fünf Brüder erhalten ein Geschenk in Höhe von insgesamt CHF 1.000, das sie unter sich aufteilen sollen. Die Brüder müssen ein Jahr warten, bevor sie ihren Anteil an den CHF 1,000 erhalten. Die Inflationsrate beträgt konstant 5%. Können sich die Brüder nach diesem Jahr mit ihrem Anteil ….
Mehrfachantworten möglich
-
a) Mehr kaufen, als sie es heute können
-
b) Genau so viel kaufen
-
c) Weniger kaufen, als sie es heute können
-
d) Weiss nicht
-
-
2. Angenommen, Sie leihen einem Freund abends CHF25 und er gibt Ihnen am nächsten Tag CHF 25 zurück. Wie viele Zinsen hat er auf diesen Kredit bezahlt?
-
_____Prozent (%) (0)
-
Weiss nicht
-
-
3. Sie legen CHF 100 auf einem gebührenfreien Sparkonto mit einem garantierten Zinssatz von 2% pro Jahr an. Sie zahlen kein weiteres Geld auf dieses Konto ein und Sie heben auch keines ab. Wie hoch wäre der Kontostand einschliesslich Zinsen am Ende des ersten Jahres?
-
_____CHF (102)
-
Weiss nicht
-
-
4. Und wie hoch wäre der Kontostand nach fünf Jahren? Er wäre:
-
a) Mehr als CHF110
-
b) Genau CHF110
-
c) Weniger als CHF110
-
d) Eine Antwort ist anhand der Informationen nicht möglich
-
e) Weiss nicht
-
-
5. Bitte geben Sie bei den folgenden Aussagen jeweils an, ob diese Ihrer Meinung nach richtig oder falsch sind?
-
• Eine Geldanlage mit hoher Rendite ist wahrscheinlich sehr risikoreich
ANTWORT: Richtig, Falsch, Weiss nicht
-
• Eine hohe Inflation bedeutet, dass die Lebenshaltungskosten rasch steigen
ANTWORT: Richtig, Falsch, Weiss nicht
-
• Normalerweise lässt sich das Anlagerisiko am Aktienmarkt verringern, indem man eine Vielzahl verschiedener Aktien kauft
ANTWORT: Richtig, Falsch, Weiss nicht
-





 Open access

