Implications
Due to the difficulty and high costs of measuring feed efficiency-related traits, association studies for these traits, especially using a crossbred pig population, are still limited. The results of this study help to better understand the genetic background of feed efficiency-related traits showing that these traits are most likely controlled by many genes of small effects rather than a few genes with large effect. The genetic markers with significant association with feed efficiency-related traits identified in this study could be used for establishing marker-assisted selection strategies for accelerating genetic progress of these traits in the evaluated populations.
Introduction
Feed efficiency (FE) is considered one of the most important traits in pig production. The importance of this trait is mainly explained by the fact that costs related to feed represent 60% to 70% of the total cost of pig production (Patience et al., Reference Patience, Rossoni-Serão and Gutiérrez2015). However, besides its economic aspect, a better FE also has a social aspect, because the reduction in production costs can contribute to the reduction of the final cost of products, such as meat, milk and eggs, allowing the world population easier access to high-quality protein sources at lower prices (Hayes et al., Reference Hayes, Lewin and Goddard2013). In addition, improving FE, the environmental impact related to the generated waste is also reduced.
Despite of the importance of FE for the pig industry, the measurement of this phenotype is difficult and costly, limiting the collection of large volume of data to an accurate selection for better FE. Thus, the use of tools that can contribute to increase the prediction accuracy of FE is of great interest of pig breeding programs. One of these tools is the use of genomic information in the prediction models. In this context, some studies (Onteru et al., Reference Onteru, Gorbach, Young, Garrick, Dekkers and Rothschild2013; Howard et al., Reference Howard, Jiao, Tiezzi, Huang, Gray and Maltecca2015) have used dense single-nucleotide polymorphism (SNP) panels to perform genome-wide association studies (GWASs) in order to identify SNPs associated with FE-related traits that can be incorporated into the prediction models. However, due to the difficulty and high costs of measuring these phenotypes, GWASs for FE-related traits are still limited. Therefore, GWASs for these traits are necessary to identify SNPs that can, besides assisting the selection process, also promote a better understanding of the genetic mechanisms involved in the genetic control of these traits.
Additionally, the previously performed GWASs have focused mainly on phenotypes collected on purebred populations raised in high-health environments. However, the final product of pig breeding is a crossbred animal raised in a commercial environment (Hidalgo et al., Reference Hidalgo, Bastiaansen, Lopes, Harlizius, Groenen and de Koning2015), with lower health status environment, using diets with different nutritional levels and, in most cases, undergo very different management conditions compared to the purebred populations.
According to Veroneze et al. (Reference Veroneze, Bastiaansen, Knol, Guimarães, Silva, Harlizius, Lopes and Lopes2014), the use of crossbred populations as reference populations is of great interest because crossbred animals are normally raised in environments similar to those that the other commercial (crossbred) animals will be subjected to. Further, these authors also describe that a crossbred population can be used as a reference population for all purebred populations that originated these crossbreds. Therefore, SNPs associated with FE-related traits identified in crossbred populations could be used in marker-assisted selection strategies to select purebred animals to improve the performance of their crossbred progeny.
In this study, we aimed to identify SNPs with a significant association with FE-related traits: (1) average daily gain (ADG), (2) average daily feed intake (ADFI) and (3) feed conversion ratio (FCR), recorded on a population of crossbred pigs. In addition, we aimed to identify potential candidate genes for these traits.
Material and methods
Animals and collection of phenotypic information
The phenotypic information used in this study is part of the database of a commercial pig breeding program. Data were collected at the Schothorst Feed Research experimental farm (Lelystad, the Netherlands) according to the data collection protocols regularly used in this unit. Animals were fed ad libitum, and the diet composition used in the trial is given in Supplementary Table S1. The health status of this farm resembles the health status of most Dutch commercial farms. The initially phenotypic dataset available for this study contained information from a total of 4981 finishing pigs (2553 castrates and 2428 females), originated from the cross between boars of a synthetic line and F1 (Landrace × Large White) sows. The phenotypic information was collected between August 2012 and November 2016. The animals were weighed at the beginning (23.3 ± 4.8 kg) and at the end (123.6 ± 8.4 kg) of the test period. The average age of the animals at the beginning and at the end of the test period was 62.8 ± 3.2 and 168.3 ± 9.8 days, respectively.
Information on individual feed intake was recorded throughout the test period using IVOG computerized feed stations (http://insentec.eu/en/pig-management/ivog), obtaining individual feed intake at each visit of the animal to the feed station. The ADG of each animal was calculated by the difference between the weight at the end of the test and the weight at the beginning of the test, divided by the number of days of the test period. The ADFI of each animal during the test was obtained by dividing the total feed intake during the test by the number of days of the test period. The FCR of each animal was obtained by dividing its ADFI by its ADG.
During quality control procedures, animals with missing records for the studied traits were excluded from the dataset. Data from animals with outlier phenotypes, for example, with values greater than the average plus 3.5 × SD or lower than the average minus 3.5 × SD, for the studied traits, were also excluded from the final dataset. In addition, data were removed from animals that belonged to contemporary herd–year–week (HYW) groups composed for less than nine animals. Thus, information on 4964 animals remained after quality control, and it was used for the pre-correction of the phenotypes.
Pre-correction of phenotypes
The original phenotype of all animals for all traits was pre-corrected for the non-genetic effects using all available phenotypes, disregarding if the animals were genotyped or not. The non-genetic effects for each studied trait were estimated using the software ASReml v. 3.0 (Gilmour et al., Reference Gilmour, Gogel, Cullis and Thompson2009) and the following animal single-trait model:
 $${\rm{y}}_{{\rm{ijklmno}}} = \mu + {\rm{sex}}_i + {\rm{HYWSt}}_j + {\rm{WSt}}_k + {\rm{T}}_l + {\rm{L}}_m + {\rm{P}}_n + {\rm{animal}}_o + {\rm{e}}_{{\rm{ijklmno}}} $$
(1)
where yijklmno is the phenotype of the animal o; µ is the overall mean; sex
i
is the fixed effect of sex i; HYWSt
j
is the fixed effect of herd, year and week j at the beginning of the test period; WSt
k
is the fixed effect of the weight k at the beginning of the test period; T
l
is the fixed effect of the experiment l which the animal was submitted to in order to account to any small variation in the feed composition given in Supplementary Table S1; L
m
is the random common litter effect m; P
n
is the random effect of pen n; animal
o
is the random additive genetic effect which was assumed to be distributed as
 $ \sim N(0,\bf{A}\sigma _a^2 )$
, where A is the average pedigree-based relationship matrix and
 $\sigma _a^2 $
is the additive genetic variance; and eijklmno is the random residual effect which was assumed to be distributed as
 $ \sim N(0,\bf{I}\sigma _e^2 )$
, where I is an identity matrix and
 $\sigma _e^2 $
is the residual variance. At least four generations for each animal were included in the pedigree file used in these analyses.
Genotyping and quality control
A total of 2386 three-way crossbred animals were genotyped using the GeneSeek Custom 10K SNP chip (GeneSeek Inc., Lincoln, NE, USA). However, for a higher resolution of the GWAS, these crossbred animals had their genotypes imputed toward the Custom 80K SNP chip (GeneSeek Inc.). In order to ensure a high imputation accuracy, the reference population used for this imputation was composed of both parents of the crossbred animals (174 sires and 313 dams). In addition, 8110 other animals from paternal line and 3012 other animals from the maternal line were also genotyped and available as reference population for the imputation. The animals from both parental lines were genotyped using mainly the 80K SNP chip, but some animals were also genotyped using the Illumina Porcine SNP60 BeadChip (60K SNP chip; Illumina, Inc., San Diego, CA, USA). Therefore, before imputing the crossbred genotypes, a within line imputation was performed for each parental line in order to impute the 60K toward 80K genotypes and also to impute any missing genotypes that remained after quality control.
The quality control excluded SNPs with a GenCall lower than 0.15, a call rate lower than 0.95, a minor allele frequency lower than 0.01 and SNPs that deviated significantly from Hardy–Weinberg equilibrium (HWE) with χ2 > 600 (Hayes et al., Reference Hayes, Bowman, Chamberlain and Goddard2009; Lopes et al., Reference Lopes, Silva, Harlizius, Duijvesteijn, Lopes, Guimarães and Knol2013; Do et al., Reference Do, Janss, Jensen and Kadarmideen2015). Although in this study a crossbred population originated from non-random mating of different parental purebred lines with different allele frequencies was evaluated, which may result in some degree of deviation from HWE, a high χ2 threshold was applied to avoid quality problems in the genotyping procedure, such as a tendency to genotype homozygous animals as heterozygous (Veroneze et al., Reference Veroneze, Bastiaansen, Knol, Guimarães, Silva, Harlizius, Lopes and Lopes2014). Further, SNPs located on the sex chromosomes and unmapped SNPs (pig genome build10.2) were also excluded. In a further step, the imputation of the crossbred genotypes was performed using all SNPs that passed the quality control in both parental lines. All imputation analyses were performed using AlphaImpute (Hickey et al., Reference Hickey, Kinghorn, Tier, Wilson, Dunstan and van der Werf2011). In total, 51 468 SNPs were available for further analyses.
Association analysis
For the GWAS, only animals with both phenotypic (pre-corrected phenotypes) and genotypic (imputed 80K genotypes) information were used, as indicated in Table 1. The single-SNP GWAS, where one SNP was fitted in the model per time as a fixed effect, was performed using the following single-trait animal model in ASReml v. 3.0 (Gilmour et al., Reference Gilmour, Gogel, Cullis and Thompson2009):
 $${\rm{y}}_c = \mu + {\rm{SNP}}_i + {\rm{animal}}_j + {\rm{e}}_{ij} $$
(2)
where y
c
is the animal phenotype corrected for all non-genetic effects estimated by model 1; µ is the mean of the corrected phenotype evaluated in the population; SNP
i
is the fixed effect of the SNP i; animal
j
is the random additive genetic effect of the animal j, assuming to be distributed as
 $ \sim N(0,\bf{A}\sigma_a^2 )$
, where A is the pedigree-based average relationship matrix,
 $\sigma _a^2$
is the additive genetic variance; and e
ij
is the random residual effect, assuming to be distributed as
 $ \sim N(0,\bf{I}\sigma_e^2 )$
, where I is the identity matrix and
 $\sigma _e^2$
is the residual variance.
Descriptive statistic of the groups with phenotypic and genotypic information for average daily gain (ADG), average daily feed intake (ADFI) and feed conversion ratio (FCR) during the test period in a crossbred pig (Sus scrofa) population

P=animals with phenotypic information; P+G=animals with phenotypic and genotypic information; All=number of animals from groups P plus P+G.
The genotypes of the SNPs were coded as 0, 1 and 2, being 0 for AA, 1 for AB and 2 for BB. The observed and expected P values of each trait were plotted in quantile–quantile plots using the qqnorm() function in R (R Development Core Team, 2013) for visual analysis of normality and identification of possible P-value inflation (lambda > 1.0). Additionally, using the estlambda() function of the R package GenABEL (Aulchenko et al., Reference Aulchenko, Ripke, Isaacs and van Duijn2007), the inflation factor (lambda) of the P values was estimated.
The genomic control, dividing the F values by the lambda value, according to the procedure used by Bacanu et al. (Reference Bacanu, Devlin and Roeder2000) and Hinrichs et al. (Reference Hinrichs, Larkin and Suarez2009), was applied for all traits where lambda values were higher than 1.0 (Hinrichs et al., Reference Hinrichs, Larkin and Suarez2009). After genomic control, the false discovery rate (FDR) was estimated using the qvalue R package (Dabney et al., Reference Dabney, Storey and Warnes2011), using the corrected P values to avoid false-positive results due to multiple testing. Associations between SNPs and the evaluated traits were declared significant when FDR ≤ 0.005.
Associated regions and candidate genes
All significant SNPs located within 1 Mb from another significant SNP were considered to belong to the same locus of quantitative traits (QTL) region. The linkage disequilibrium (LD) between significant SNPs in the same chromosome was visually inspected using Haploview v4.2 (Barrett et al., Reference Barrett, Fry, Maller and Daly2005). The total variance explained by each QTL region was defined as the variance explained by the most significant SNP (
 $\sigma _{{\rm{SNP}}}^2$
) in each QTL region, being
 $\sigma _{{\rm{SNP}}}^2 = 2pq\alpha ^2 $
, where p and q are the observed allele frequency and α is the allele substitution effect of the most significant SNP in the region. The QTL variance was expressed as a fraction of the total phenotypic variance (
 $\% \sigma _{{\rm{SNP}}}^2 = {\textstyle{{\sigma _{{\rm{SNP}}}^2 } \over {\sigma _p^2 }}} \times 100$
, being
 $\sigma _p^2 $
the summation of the additive and environmental variances) which was estimated based on model 2 without a SNP effect.
The identification of candidate genes 1Mb around the QTL regions identified in this study was performed using Genome Gene Viewer (Sequence Viewer 3.20.4 – https://www.ncbi.nlm.nih.gov/genome/gdv/browser/?context=genome&acc=GCF_000003025.5, accessed on 24 April 2017). Those genes that, in previous studies, were identified as been related to the metabolic processes or molecular mechanisms of the evaluated traits were defined as candidate genes.
Results
Genetic parameters and components of variance
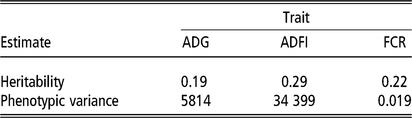
The variance components for all traits are shown in Table 2. The total phenotypic variances for ADG, ADFI and FCR were 5814 (g/day)2, 34 399 (g/day)2 and 0.019 (g/g)2, respectively. The corresponding heritabilities were 0.19 for ADG, 0.29 for ADFI and 0.22 for FCR.
Estimated phenotypic variances and heritabilities for average daily gain (ADG), average daily feed intake (ADFI) and feed conversion ratio (FCR) during the test period in a crossbred pig (Sus scrofa) population

Genomic control
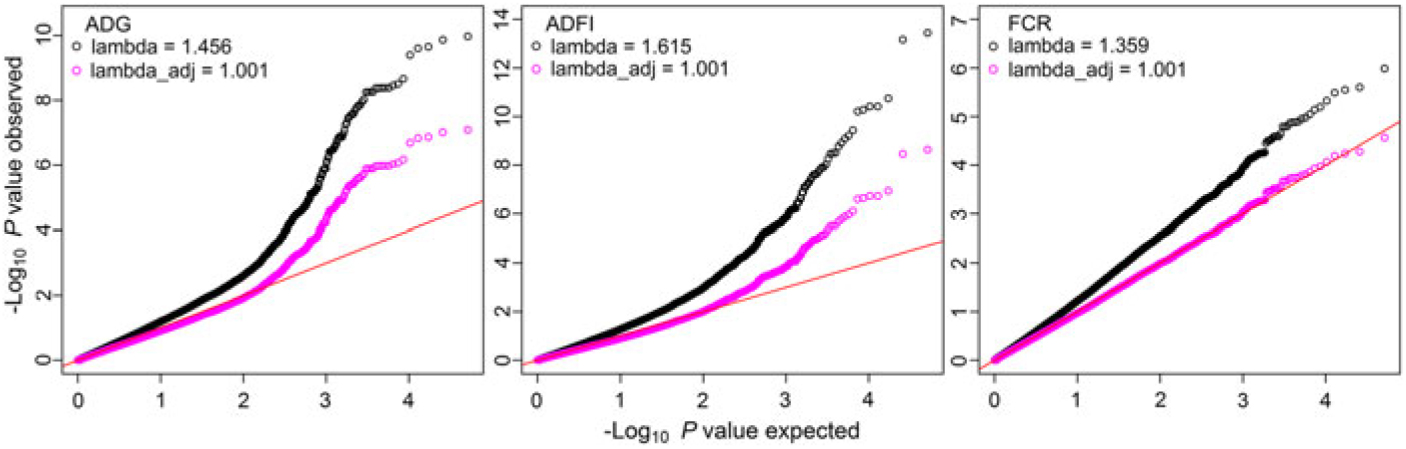
The lambda values for the SNP P values for all traits were greater than the established threshold of 1.0, requiring the need for a genomic control of the P-value inflation, as indicated in Hinrichs et al. (Reference Hinrichs, Larkin and Suarez2009). After genomic control, lambda values changed from 1.456 to 1.001 for ADG, from 1.615 to 1.001 for ADFI and from 1.359 to 1.001 for FCR (Figure 1).
Quantile–quantile plots of the single-nucleotide polymorphism P values for the traits average daily gain (ADG), average daily feed intake (ADFI) and feed conversion ratio (FCR) during the test period in a crossbred (Sus scrofa) pig population. Black circles represent the original P values, magenta circles represent adjusted P values, and red lines represent the expected values by the null hypothesis.

Association results
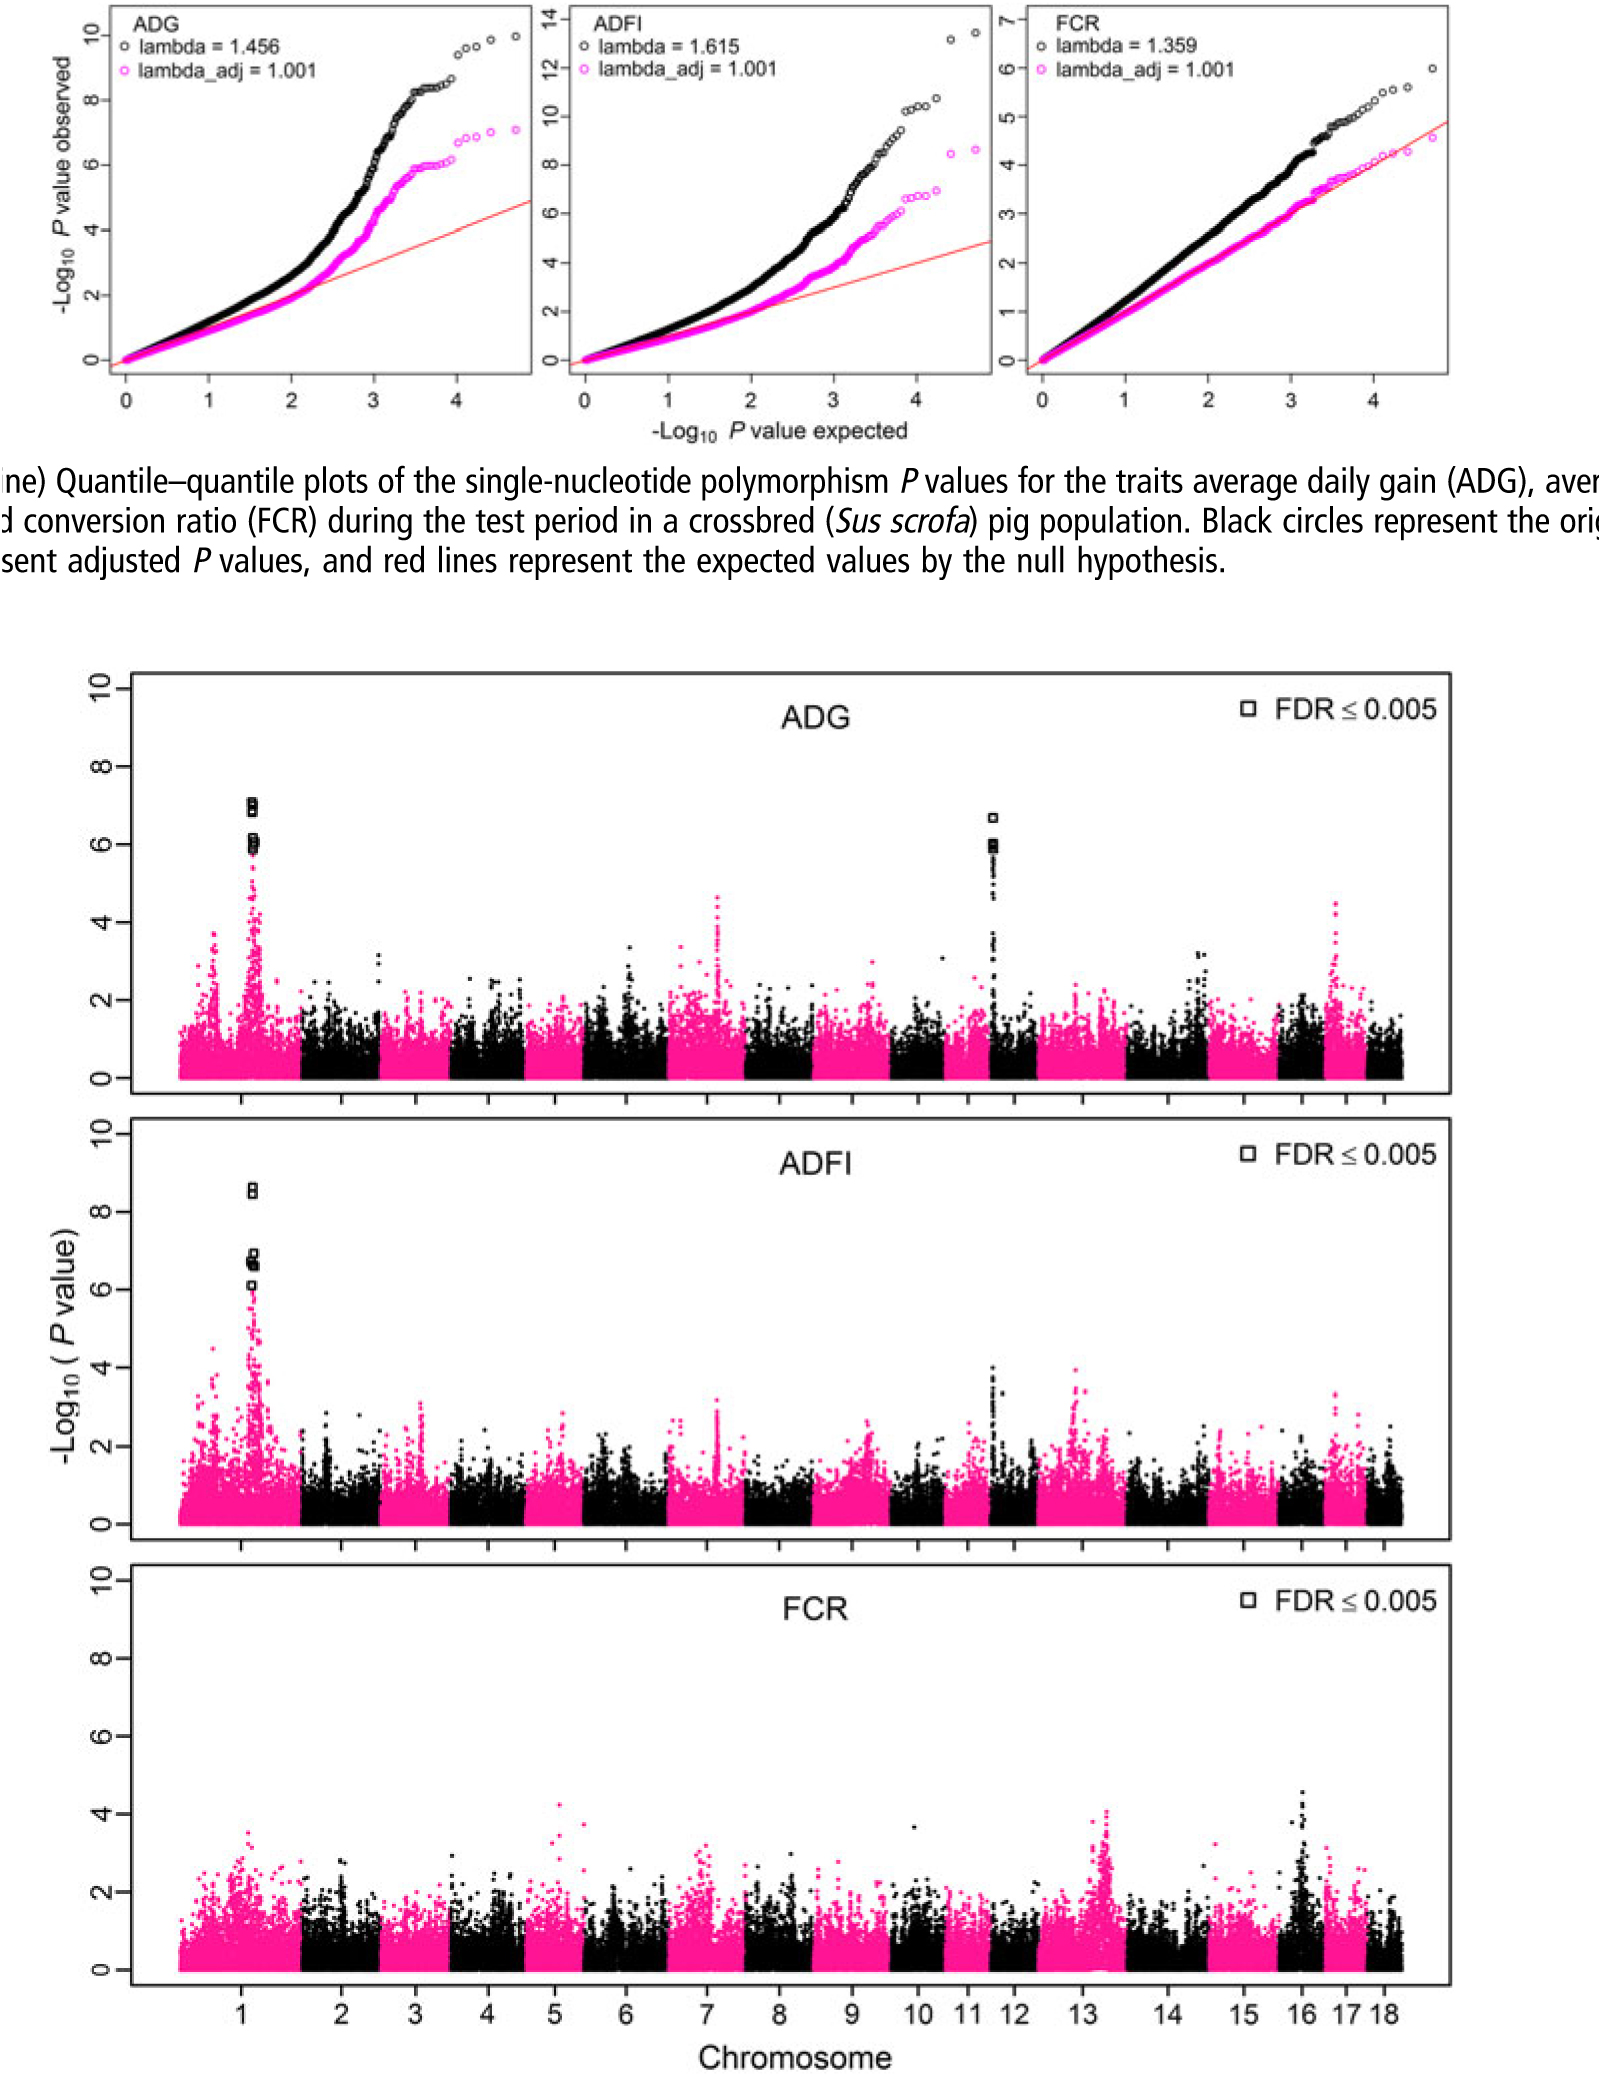
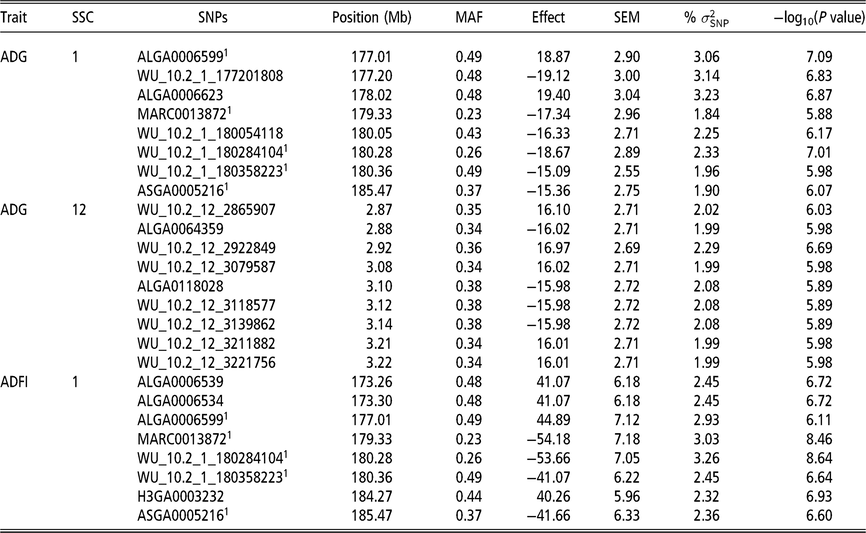
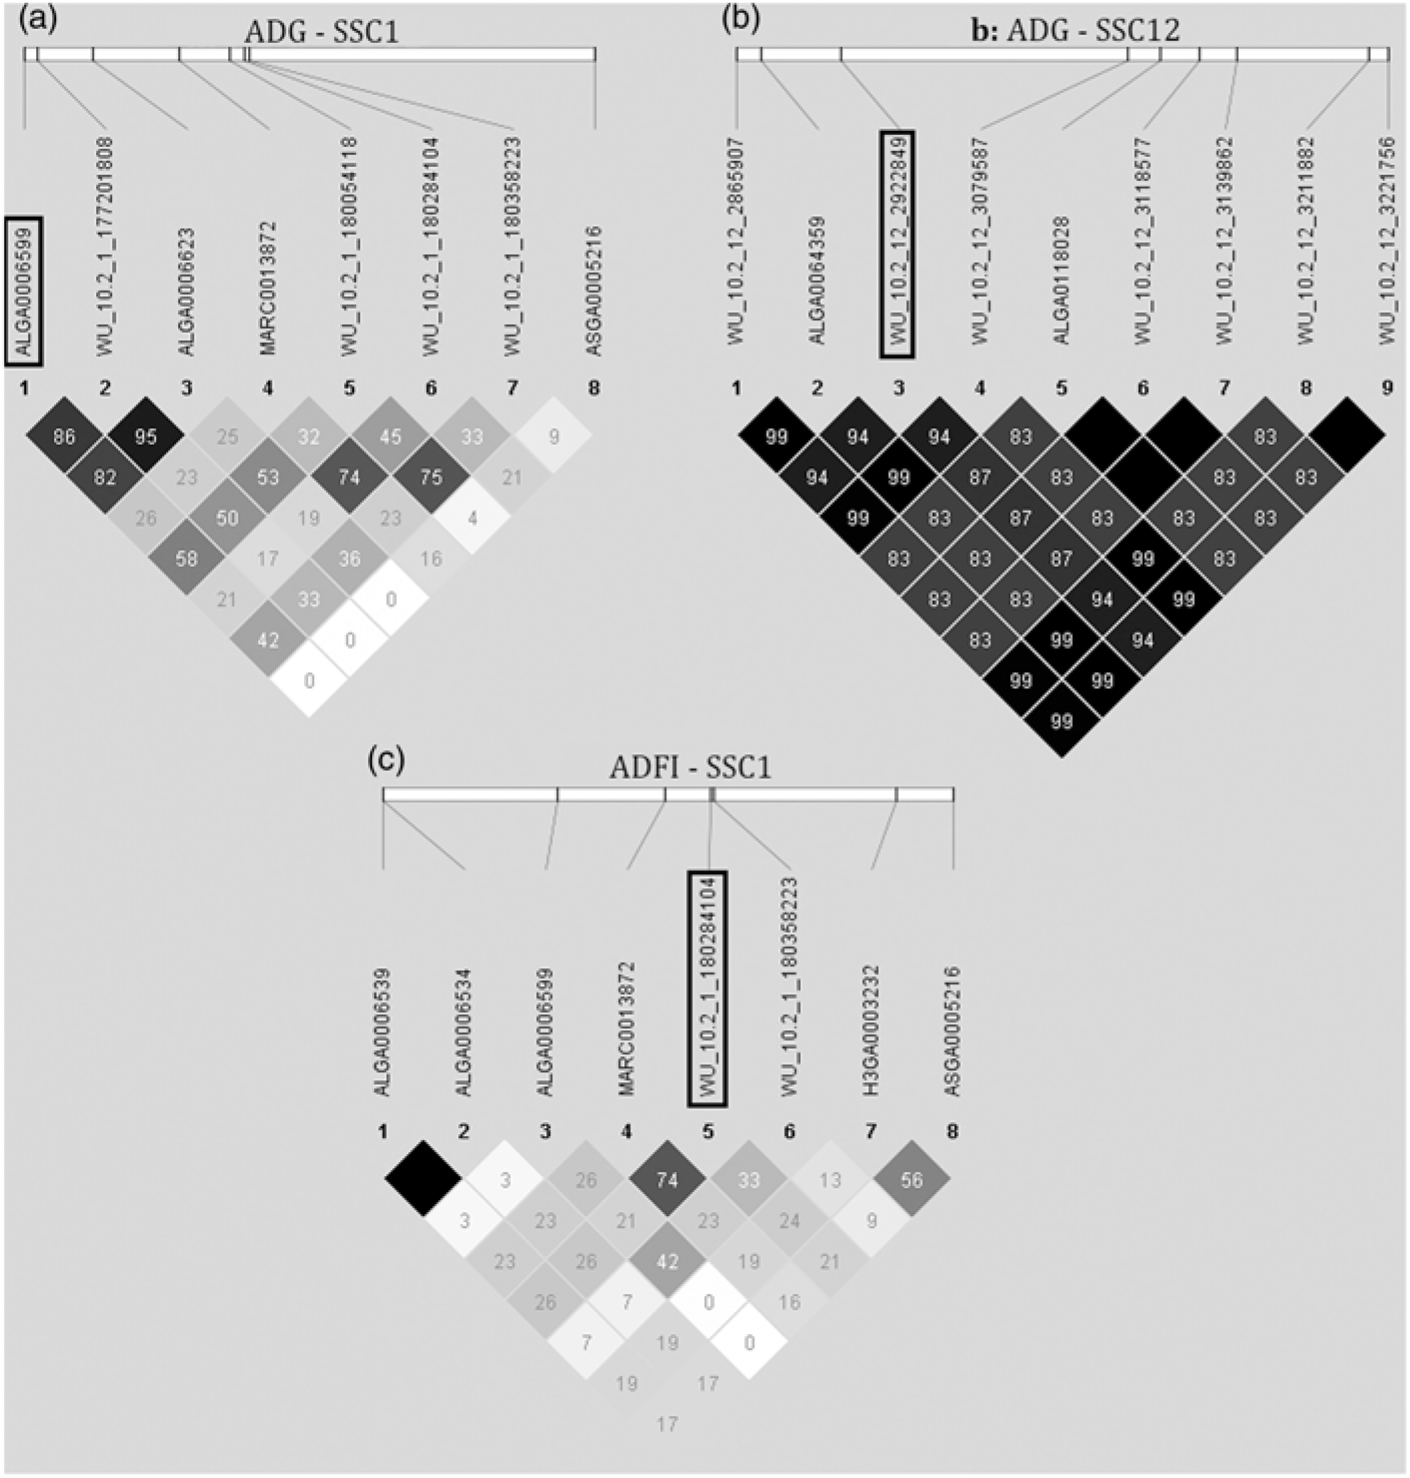
For ADG, two QTL regions were identified on Sus scrofa chromosome (SSC) 1 and one QTL region on SSC12 (Figure 2, Tables 3 and 4). The QTL regions on SSC1 were composed of eight significant SNPs (FDR ≤ 0.005) located between 177.01 and 185.47 Mb, being ALGA0006599 (177.01 Mb) the most significant SNP with a −log10 (P value) of 7.09, an effect of 18.87 g and explaining 3.06% of the phenotypic variance of ADG. The QTL region on SSC12 was composed of nine significant SNPs located between 2.87 and 3.22 Mb, being WU_10.2_12_2922849 (2.92 Mb) the most significant SNP with a −log10 (P value) of 6.69, an effect of 16.97 g and explaining 2.29% of the phenotypic variance of ADG. The LD between the SNPs in these regions is shown in Figure 3.
Genome-wide association study for feed efficiency-related traits during the test period in a crossbred pig (Sus scrofa) population, represented by −log10 (P values) single-nucleotide polymorphism (SNP) association with the traits average daily gain (ADG), average daily feed intake (ADFI) and feed conversion ratio (FCR) (axis y), on physical SNP position on 18 autosomal chromosomes (axis x). Little squares (□) represent the SNPs associated with respective trait considering a false discovery rate (FDR) ≤ 0.005.

Characterization of the single-nucleotide polymorphisms (SNPs) with significant effect on average daily gain (ADG) and average daily feed intake (ADFI) during the test period in a crossbred pig (Sus scrofa) population

SSC=Sus scrofa chromosome; Position=position in mega basis (Mb); MAF=minor allele frequency; Effect=allele substitution effect; SEM=standard error of mean; %
 $\sigma _{{\rm{SNP}}}^2$
=percentage of phenotypic variance explained by the SNP.
1 SNPs with significant effect for both ADG and ADFI.
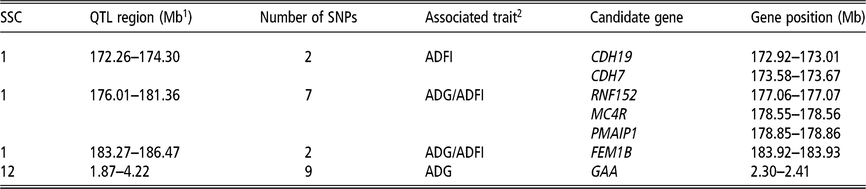
Description of the loci of quantitative traits (QTL) regions and candidate genes for the evaluated traits during the test period in a crossbred pig (Sus scrofa) population

SSC=Sus scrofa chromosome; Number of SNPs=number of single-nucleotide polymorphisms (SNPs) in the QTL region; CDH19=cadherin 19; CDH7=cadherin 7; RNF152=Ring finger protein 152; MC4R=melanocortin-4 receptor; PMAIP1=phorbol-12-myristate-13-acetate-induced protein 1; FEM1B=fem-1 homolog B; GAA=alpha-glucosidase.
1 Mega basis (Mb).
2 Average daily gain (ADG) and average daily feed intake (ADFI).
Linkage disequilibrium (LD) between the significant single-nucleotide polymorphisms (SNPs) for (a) average daily gain (ADG) on Sus scrofa chromosome (SSC) 1, (b) ADG on SSC12 and (c) average daily feed intake (ADFI) on SSC1 during the test period in a crossbred pig (Sus scrofa) population. The most significant SNP in each chromosome is surrounded by a square. Numbers inside the diamonds are the LD measurements (r 2) on a scale of 0% to 100%.

For the ADFI, three QTL regions on SSC1 were identified (Figure 2, Tables 3 and 4). These QTL regions were composed of eight significant SNPs located between 173.26 and 185.47 Mb, being WU_10.2_1_180284104 the most significant SNP with a −log10 (P value) of 8.64, an effect of −53.66 g/day and explaining 3.26% of the phenotypic variance of ADFI. On SSC1, five SNPs were significant for both ADG and ADFI. However, no significant SNPs were identified for FCR, which is a ration between ADFI and ADG, even when using a less critical FDR threshold (FDR ≤ 0.20).
Discussion
In this study, we identified QTL regions associated with ADG (SSC1 and SSC12) and ADFI (SSC1). The QTL regions for ADFI partly overlap with the QTL regions for ADG (five significant SNPs in common) on SSC1. However, no significant association was found for FCR. Figure 3 clearly shows a low LD between the neighboring significant SNPs spread in different QTL regions on SSC1 (Table 4) according to their physical distance on the genome (see the ‘Material and methods’ section for QTL region definition). This could be an indication that different genes are influencing these traits in this region. Although these SNPs on SSC1 do not show high LD between them, they are probably in some degree of LD with the causative mutation(s), being that such causative mutations are not part of the set of SNPs evaluated. On the other hand, Figure 3 also clearly shows that the significant SNPs for ADG on SSC12 belong indeed to one single QTL region probably influenced by one single gene.
Further, the genomic control was applied in this study to avoid false-positive results. However, one could argue that if this inflation was due to unadjusted population structure not accounted by the pedigree-based relationship matrix, the use of a genomic relationship matrix would be a better strategy. To evaluate the power of the strategy used in this study, an additional single-SNP GWAS was performed in GCTA software (Yang et al., Reference Yang, Lee, Goddard and Visscher2011) using model 2 replacing the pedigree-based genomic relationship matrix by a genomic relationship matrix. As shown in Figure 2, Table 3, Supplementary Figure S1 and Table S2, the results of both GWAS were very similar. No additional QTL region was identified, and the most significant SNP in each QTL region was the same using both relationship matrices, which indicates that the power of this study was sufficient in its conditions.
Associated regions and candidate genes
The QTL regions found on SSC1 that contains SNPs associated with both ADG and ADFI have been identified as well in previous studies. Onteru et al. (Reference Onteru, Gorbach, Young, Garrick, Dekkers and Rothschild2013) identified SNPs for ADG in the same region using data from a purebred Yorkshire pig population. In the study by Onteru et al. (Reference Onteru, Gorbach, Young, Garrick, Dekkers and Rothschild2013), where a Bayesian approach was used, the most significant 1 Mb window explained 2.4% of the phenotypic variance of ADG. In this study, using crossbred data and a single-SNP approach, the most significant SNP located in the same region found by Onteru et al. (Reference Onteru, Gorbach, Young, Garrick, Dekkers and Rothschild2013) explained 3.06% of the phenotypic variance of ADG.
In previous studies, candidate genes with functions related to ADG and ADFI have also been described in the window of 1 Mb around the QTL regions described on SSC1 in this study (Table 4). The genes CDH19 and CDH7 (cadherin 19 and cadherin 7), located, respectively, between 172.92 and 173.01 Mb and between 173.58 and 173.67 Mb, have been extensively studied in humans. The members of the cadherin family are responsible for a group of calcium-dependent molecules that allow binding and promote adhesion between neighboring cells (Kools et al., Reference Kools, Van Imschoot and Van Roy2000), playing an important role in the formation and maintenance of the integrity of various tissues. In broilers, CDH7 was found to be involved in the development of the spinal cord in early embryonic stages (Lin et al., Reference Lin, Wang and Redies2014).
The genes RNF152 (Ring finger protein 152) and PMAIP1 (phorbol-12-myristate-13-acetate-induced protein 1), located, respectively, between 177.06 and 177.07 Mb and between 178.85 and 178.86 Mb, were previously related to the increased intramuscular fat in pigs (Rothschild et al., Reference Rothschild, Kim and Plastow2014) and are also located within the 1Mb window around the QTL regions on SSC1 (Table 4).
Several studies have associated the gene MC4R (melanocortin-4 receptor) with ADG, ADFI and fat (Kim et al., Reference Kim, Larsen, Short, Plastow and Rothschild2000; Davoli et al., Reference Davoli, Braglia, Valastro, Annarratone, Comella, Zambonelli, Nisi, Gallo, Buttazzoni and Russo2012). This gene is located within a QTL region identified in this study for both ADG and ADFI on SSC1 and plays an important role in controlling ADFI and energy homeostasis (Chao et al., Reference Chao, Wang, Deng, Wei, Sun, Liu, Liu and Zheng2012). Based on studies conducted with various breeds and lines of pigs, the significance of the effect of MC4R on growth and fat may vary, depending on the evaluated breed or line (Chao et al., Reference Chao, Wang, Deng, Wei, Sun, Liu, Liu and Zheng2012). Houston et al. (Reference Houston, Cameron and Rance2004) evaluated the effect of the MC4R in several Large White lines that had different selection objectives regarding the traits FCR, lean ADG with ad libitum feed, and lean ADG with restricted feed and ADFI during seven generations. These authors investigated the association and the effect of the Asp298Asn polymorphism (aspartic acid substitution by asparagine at position 298 of MC4R in pigs) within high and low group of animals for the traits that they were selected for. They concluded that the level of significance and the effect, as well as the allele frequency of this locus, varied across the different groups. Nevertheless, when they analyzed all genetic lines together, this polymorphism was significantly associated (P≤0.05) with backfat, ADG and ADFI.
Our findings corroborate the previous findings that indicated the association of MC4R with these traits. However, none of the significant SNPs identified in this study are located within MC4R. Because of MC4R-related intellectual property, the commercial chips used in this study lack the causal mutation and not even SNPs with strong LD with MC4R (Fan et al., Reference Fan, Onteru, Du, Garrick, Stalder and Rothschild2011; Onteru et al., Reference Onteru, Gorbach, Young, Garrick, Dekkers and Rothschild2013). If there were markers available in commercial chips closer to MC4R, probably even more significant associations with this gene and even greater allele substitution effects would be identified. On the other hand, while the effect of the QTL may be underestimated due to the lack of LD between the SNPs and the causative mutation, the SNP effects estimated in this study could be overestimated due to, for example, the population size, number and size of families present in the population and the Beavis effect (Beavis, Reference Beavis and Paterson1998). In addition, it is also important to mention that the identification of candidate genes in such a large QTL region is very speculative. Although MC4R seems to be the most promising candidate gene for SSC1 for both ADG and ADFI, Figure 3 shows low LD between the significant SNPs, which could also be an indication of different causal variants segregating in this region, as previously discussed. Therefore, for more conclusive and less speculative results, association analyses using the causal variants of the genes in this region should be performed. However, such data are not yet available for this population.
The H3GA0003232 SNP (184.27 Mb in SSC1), which demonstrated a significant association with the ADFI, is located less than 0.5 Mb from the position of the FEM1B gene (Fem-1 Homolog B) (between 183.92 and 183.93 Mb). In mammals, FEM1 genes are expressed in tissues involved in the physiology of glucose, including pancreas and skeletal muscle. In a previous study with mice, there was evidence that FEM1B may be involved in glucose homeostasis (Lu et al., Reference Lu, Ventura-Holman, Li, McMurray, Subauste and Maher2005).
A significant association was also found in the QTL region located between 2.87 and 3.22 Mb on SSC12 with the ADG, with WU_10.2_12_2922849 being the most significant SNP accounting for 2.29% of the phenotypic variance of the trait. To our knowledge, this region has not been identified in previous studies, except in a study conducted by Rohrer (Reference Rohrer2000) using microsatellites. This author evaluated a Meishan–White backcross pigs and mentioned an association of a region on SSC12 with ADG between 8 and 18 weeks of age. However, the author does not present in detail the findings for this trait in this chromosome.
The GAA (alpha-glucosidase) gene, located between 2.30 and 2.41 Mb in SSC12, was one of the genes that remained within the 1Mb window of the QTL region associated with ADG. In humans, this gene encodes the alpha-glucosidase acid enzyme, and its essential function is the degradation of glycogen to glucose in lysosomes (Reuser et al., Reference Reuser, Kroos, Elferink and Tager1985).
Although QTL regions were identified for the traits ADG and ADFI, which are directly involved in the calculation of the FCR, no QTL region was found for FCR, even with the attempt of a less critical threshold (FDR ≤ 0.20). One hypothesis that may explain this situation is the fact that the same SNPs that were significant for both ADG and ADFI showed effects in the same direction for these traits (e.g. ALGA0006599 with an effect of 18.87 g/day for ADG and 44.89 g/day for ADFI; MARC0013872 with effect of −17.34 g/day for ADG and −54.18 g/day for ADFI) (Table 3), and therefore, when dividing ADFI by ADG for estimating FCR, this significant effect for the original traits is diluted. The results obtained in this work suggested that ADG and ADFI are controlled by several QTL regions with small effects. This observation may also explain the fact that we found no significant association of any SNP with FCR, considering FDR ≤ 0.005 or even at less critical thresholds.
Growth is a complex trait that is defined through various biological processes that take place in the animal. Understanding the genetic aspects that involve the components associated with body growth (muscle content, fat, bones, viscera, among others) and its dynamics of growth throughout life are essential. In addition, more than one third of the variation in feed consumption and FE are related to processes that are independent of growth and body composition (Knap and Wang, Reference Knap, Wang and Patience2012).
Complex traits as growth and consumption are usually the result of dynamic systems (Howard et al., Reference Howard, Jiao, Tiezzi, Huang, Gray and Maltecca2015). According to Knap and Wang (Reference Knap, Wang and Patience2012), the use of the traits that compose FCR within the selection objectives (e.g. ADG, ADFI and backfat thickness) allows greater control over each relevant element of the system, separating the FCR in their characteristic functional components so that they can be manipulated independently. The precise measurement of the traits that compose FCR has demonstrated to be able to help in the understanding of the mechanisms involved with the primary traits that compose the FCR. In this context, the use of non-invasive methods, such as computed tomography, magnetic resonance and dual energy radiographic absorptiometry, has been used as tools to investigate genetic aspects related to growth (Kušec et al., Reference Kušec, Scholz, Baulain, Kušec and Bernau2016). Using these tools, it is possible to estimate, through the use of images and with the aid of adequate statistical tools, the body content of the animals in an accurate way. Kongsro (Reference Kongsro, Maltin, Craigie and Bünger2014) reported a 30% extra genetic progress for lean meat percentage in pigs when using computed tomography scan for the evaluation of the carcasses of live animals compared to the use of traditional methods, such as ultrasound.
A large number of studies on genomic selection have demonstrated several possibilities to the use of this new tool in breeding (Jonas and Koning, Reference Jonas and Koning2015). However, there are still many possibilities to be exploited. In this study, we identified QTL regions strongly associated with ADG and ADFI. Due to the relevance of the traits evaluated in this study for pig breeding programs, further studies should be conducted in order to evaluate the potential use of the significant SNPs identified for ADG and ADFI in prediction models that ally marker-assisted selection with genomic selection (GBLUP, Genomic best linear unbiased linear prediction), as described by Lopes et al. (Reference Lopes, Bovenhuis, van Son, Nordbø, Grindflek, Knol and Bastiaansen2017).
Final considerations
In this study, we identified three QTL regions for ADG (on SSC1 and SSC12) and three for ADFI (on SSC1). These regions were previously described in purebred pig populations; however, to our knowledge, this is the first study to confirm the relevance of these QTL regions in a crossbred pig population. The non-identification of QTL regions for FCR can be justified by the complexity of this trait. This result indicates that GWAS for more refined phenotypes (such as ADG and ADFI) has greater power than GWAS for traits that correspond to a function of two other traits (such as FCR). The potential use of the SNPs and genes identified in this study in prediction models that combine genomic selection and marker-assisted selection should be evaluated for increasing the prediction accuracy of these traits in this population.
Acknowledgements
The authors thank Topigs Norsvin Research Center (Beuningen, the Netherlands) for providing the phenotypic and genomic datasets, as well as the support in data analysis. Especial thanks to Rob Bergsma and Claudia Sevillano for their valuable discussion regarding the data and models.
Declaration of interest
The authors declare that the research was conducted in the absence of any commercial or financial relationships that could be construed as a potential conflict of interest.
Ethics statement
The data used for this study were obtained as part of routine data recording in a commercial breeding program. Samples collected for DNA extraction were only used for routine diagnostic purposes of the breeding program. Data recording and sample collection were conducted strictly in line with the rules given by the Dutch Animal Research Authorities.
Software and data repository resources
The data that support the findings of this study are available from Topigs Norsvin, but restrictions apply to the availability of these data, which were used under license for the current study and thus are not publicly available. However, data are available from the authors upon reasonable request and with permission of Topigs Norsvin.
Supplementary material
To view supplementary material for this article, please visit https://doi.org/10.1017/S1751731119000910