I. INTRODUCTION
At the core of designing advanced materials for harsh environments involving high temperatures, extreme stresses, and aggressive irradiation conditions lies unprecedented thermal stability. Reference Schuster, Ligda, Pan and Wei1–Reference Beyerlein, Caro, Demkowicz, Mara, Misra and Uberuaga3 Nanocrystalline metals have gained a significant interest for extreme environment applications due to their advantageous mechanical properties despite their propensity to undergo grain growth even at moderate homologous temperatures. Reference Dake and Krill4,Reference Ames, Markmann, Karos, Michels, Tschope and Birringer5 For example, heating nanocrystalline Ni with an average grain size of 20 nm to 40% of its melting point produced an order of magnitude increase in its grain size after only 30 s. Reference Hibbard, McCrea, Palumbo, Aust and Erb6 Alloying has been pursued for suppressing nanostructural instabilities via solute stabilization of grain boundaries. Reference Chookajorn, Murdoch and Schuh7,Reference Darling, Tschopp, VanLeeuwen, Atwater and Liu8 Thermodynamic models argue that the segregated solute effectively reduces or eliminates the energetic penalty of grain boundaries, Reference Darling, Tschopp, VanLeeuwen, Atwater and Liu8–Reference Trelewicz and Schuh11 whereas kinetic treatments focus on the role of solute drag in limiting grain boundary mobility. Reference Koch, Scattergood, Saber and Kotan12,Reference Michels, Krill, Ehrhardt, Birringer and Wu13 Despite the mechanistic underpinnings, nanocrystalline alloys have demonstrated enhanced thermal stability relative to their single component counterparts. Reference Clark, Hattar, Marshall, Chookajorn, Boyce and Schuh14
Refractory metals have gained attention to enhance the operating temperatures of nanocrystalline materials due to their high melting points. Reference Schuster, Ligda, Pan and Wei1 Tantalum in particular offers a good combination of microstructural stability and mechanical properties Reference Mathaudhu and Hartwig15,Reference Bischof, Mayer, Leitner, Clemens, Staron, Geiger, Voiticek and Knabl16 and consequently has been implemented in a myriad of applications spanning electronics, ballistics, and biomedical devices. Reference Levine, Sporer, Poggie, Della Valle and Jacobs17–Reference Yoo, Sudarshan, Sethuram, Subhash and Dowding19 Refinement of the characteristic microstructural length scales in tantalum has led to precipitous enhancements in its mechanical properties. Reference Zhang, Yang, Chu and Nieh20–Reference Guisbiers, Herth, Buchaillot and Pardoen22 This reduction in grain size, particularly to the nanocrystalline regime, is attended by a transition in the deformation mechanisms from classical dislocation dynamics in body centered cubic (BCC) metals (e.g., screw dominated regime) to grain boundary-mediated dislocation plasticity, Reference Pan, Li and Wei23 grain rotation coupled to shear localization, Reference Ligda, Schuster and Wei24 and deformation twinning. Reference Wang, Hodge, Biener, Hamza, Barnes, Liu and Nieh25 The transition to grain boundary-mediated deformation mechanisms in nanocrystalline tantalum is particularly advantageous for high strain rate applications as it deforms via adiabatic shear localization under dynamic conditions Reference Wei, Pan, Wu, Schuster, Kecskes and Valiev26 while exhibiting homogenous plastic flow under quasistatic loading. Reference Schuster, Ligda, Pan and Wei1
Like many other nominally pure nanocrystalline metals, tantalum is plagued by thermal instabilities when the grain size is refined to the nanocrystalline regime. Annealing of sputtered nanocrystalline tantalum thin films at only 25% of its melting point produced a 3-fold increase in grain size, which had implications for both the mechanical and electrical properties. Reference Javed, Durrani and Zhu27 What is more, nanocrystalline tantalum exhibits multiple polymorphs with the most notable relating to the reversible transition between the stable α-BCC and metastable β-tetragonal structures over the temperature range of 755–775 °C. Reference Read and Hensler28 In the aforementioned thermal stability study, the as-sputtered tantalum films exhibited a two-phase α–β nanostructure, which transformed to single-phase α-Ta upon annealing at 750 °C. Single-phase α and β nanostructures were also accessible in sputtered tantalum films with the resulting phase depending on the impurity content during deposition. Reference Navid and Hodge29 The ability to control the reversible α-to-β phase transformation varies with the impurity state of the material Reference Clevenger, Mutscheller, Harper, Cabral and Barmak30 and nanocrystalline grain size. Reference Zhang, Zhang, Rack, Miller and Nieh31 Consequently, stabilizing nanocrystalline grains in tantalum necessitates design against grain growth collectively with phase separation and is commensurate with thermodynamic arguments for nanostructure stability. Reference Murdoch and Schuh32
A highly effective technique for characterizing microstructural evolution in nanomaterials is in situ transmission electron microscopy (TEM) as it enables real-time analysis of grain growth Reference Dannenberg, Stach, Groza and Dresser33 and phase instabilities. Reference Brewer, Follstaedt, Hattar, Knapp, Rodriguez and Robertson34 This is particularly beneficial for nanocrystalline metals where microstructural coarsening often transpires through abnormal grain growth processes, Reference Brons and Thompson35 which are difficult to detect via traditional ex situ measurements. Reference Hibbard, McCrea, Palumbo, Aust and Erb6 Grain growth rates have been quantified through in situ TEM observations of grain boundary migration, Reference Kacher, Robertson, Nowell, Knapp and Hattar36 and further described in the context of grain boundary misorientation and mobility to delineate different stages of abnormal grain growth in nanocrystalline metals. Reference Brons and Thompson35 The role of grain boundary segregation state in inhibiting microstructural instabilities has also been understood through in situ techniques where the segregated solute has been confirmed to hinder grain boundary mobility during annealing. Reference Choi, da Silva, Klement, Al-Kassab and Kirchheim37 Donaldson et al. Reference Donaldson, Hattar and Trelewicz38 recently applied in situ TEM to explicate the phase transformation sequence during the devitrification of amorphous tantalum thin films containing oxygen impurities, thus demonstrating the utility of these methods for characterizing microstructural evolution in refractory metals.
In this study, nanostructure stability in pulsed laser deposited (PLD) tantalum films is explored through in situ TEM experiments at temperatures up to 1200 °C. Focus is initially placed on the competition of grain growth with the α-to-β phase transition near 800 °C. Microstructural evolution is then probed up to 40% the melting point of tantalum with grain size distributions acquired during in situ TEM annealing from 800 to 1200 °C. Molecular dynamics (MD) simulations are used to quantify the grain growth dynamics in pure nanocrystalline tantalum for comparison with the thermal stability analysis. In light of disparities between the simulation and experimental results, electron energy loss spectroscopy (EELS) measurements are conducted to characterize the impurity state of the films. Based on the collective results from in situ TEM annealing, MD simulations, and EELS analysis, extrinsic stabilization mechanisms are proposed to explain the unusual thermal stability of PLD nanocrystalline tantalum films.
II. METHODS
Nanocrystalline Ta films were synthesized using PLD in the Ion Beam Laboratory at Sandia National Laboratories following the procedures described in the work of Hattar et al. Reference Hattar, Follstaedt, Knapp and Robertson39 A 248 nm wavelength Kr-F excimer laser was used with the raster stage tuned to its pulse rate, and the chamber was maintained at a pressure of 10−7 Torr during deposition. Films nominally 100–150 nm thick were deposited for the thermal stability studies onto 13 × 1 mm polished NaCl substrates acquired from International Crystal Laboratories (Garfield, New Jersey; #0002A-4549) through ablation of a Ta target (99.995% purity) provided by Alfa Aesar (Haverhill, Massachusetts; 10,357, CAS#7440-25-7). The NaCl substrate was selected to limit film–substrate interactions and expedite removal of the films for the TEM studies. Identical procedures were used to synthesize 20–30 nm thick Ta films for EELS measurements.
Freestanding films were achieved by dissolving the NaCl substrate in water and floated onto molybdenum TEM grids for in situ annealing using a Gatan heating holder (Model #628, Gatan Inc., Pleasanton, California). The films did not exhibit warping, curling, or tearing following removal from the substrates or postannealing, indicating that residual stress did not play a major role in the experiments. The EELS measurements used copper TEM grids since in situ heating was not required in this analysis. A Philips CM30 300 kV TEM (FEI Company, Hillsboro, Oregon) at Sandia National Laboratories was used for in situ heating to 1200 °C while in situ isothermal anneals at 800 °C were conducted in a JEM 2100F TEM (JEOL Ltd., Tokyo, Japan) at Brookhaven National Laboratory’s Center for Functional Nanomaterials (CFN). Image acquisition and temperature monitoring were accomplished using the Gatan Digital Micrograph software package. The presence of impurities was determined via EELS (Gatan Tridiem, Gatan Inc.) using the aforementioned TEM at the CFN. Image analysis and indexing of the electron diffraction patterns were accomplished using Adobe Photoshop and ImageJ software packages.
Phase identification was accomplished using radial intensity profiles ascertained from the electron diffraction patterns. The pattern intensity is integrated over all azimuthal angles as a function of the distance from the center of the direct beam, which can be converted to a Bragg angle assuming a wave length of 0.0273 Å. Reference Detor and Schuh40 Following the method described by Edington, Reference Edington41 phases were indexed by comparing the ring spacing ratio with the reciprocal of the known d-spacing ratios for all possible crystal structures of interest. This technique permits clear identification of the phases present in the polycrystalline samples, but like most electron diffraction techniques are limited to qualitative analysis of the peak intensities. In this study, particular emphasis was placed on distinguishing metallic Ta polymorphs from various phases of tantalum oxide and a range of other potential Ta-rich phases that can form in the presence of impurities.
MD simulations were used to model grain growth in pure nanocrystalline tantalum using the Large-scale Atomic/Molecular Massively Parallel Simulator (LAMMPS) platform. Reference Plimpton42 Columnar nanocrystalline structures were selected for their exceptional computational efficiency combined with their ability to capture 3D grain growth dynamics. Reference Haslam, Phillpot, Wolf, Moldovan and Gleiter43 A planar Voronoi construction Reference Froseth, Van Swygenhoven and Derlet44 applied within the x–y plane was used to produce 2D nanocrystalline templates containing 25 grains with an average grain size of 10 nm. From a total of 60 individual Voronoi tessellations, 5 polycrystal templates free of polygons with a very small number of sides were selected. The 3D columnar nanocrystalline structures were produced from these 2D polycrystal templates with the 〈001〉 crystallographic direction aligned with the z-axis, thereby producing a 〈001〉 textured grain structure containing 〈001〉 tilt boundaries with a distribution of misorientation angles. This texture combined with the application of periodic boundary conditions enabled the thickness of the simulation cell to be assigned based on the cutoff radius of 1.69 × a 0 for the potential described below. Consequently, the total size of the simulation cells was 44.40 × 44.40 × 1.32 nm (i.e., 4 × a 0) and they contained an average of 142,000 atoms.
The embedded-atom method (EAM) potential developed by Ravelo et al. Reference Ravelo, Germann, Guerrero, An and Holian45 for Ta was used with an isobaric–isothermal (NPT) thermostat and a time-step of 2 fs. Energy-minimized structures were achieved using a conjugate gradient (CG) relaxation to achieve a final relative energy convergence of 10−12. The nanostructures were then evolved through a 0.2 ns relaxation at 25 °C followed by simulated anneals for 25 ns over the temperature range of 225–1225 °C in increments of 250 °C. The Ovito package Reference Stukowski46 was used for visualization and analysis with grains distinguished using the common neighbor analysis (CNA) method, Reference Stukowski47 which indexes each atom according to its local atomic coordination. In the absence of Ta polymorphs, grain volumes were demarcated for BCC coordinated atoms and used to estimate the grain size under a spherical grain assumption. Grain size statistics were ascertained through collective analysis of all simulations results from the multiple unique Voronoi constructions.
III. THERMAL STABILITY OF NANOCRYSTALLINE TANTALUM FILMS
Microstructural stability and grain growth in nanocrystalline tantalum films synthesized via PLD are described in this section. Isothermal annealing near the α-to-β transition temperature is first discussed in the context of competing phase transformations and their influence on thermal stability. The effect of temperature on nanostructure stability is then investigated up to 1200 °C, which represents roughly 40% of tantalum’s melting point. While the temperatures considered fall within the known recrystallization range for tantalum of 900–1350 °C, Reference Mathaudhu and Hartwig15 no evidence of recrystallization was detected in the thin film samples. Bright-field imaging and electron diffraction analysis was performed in situ at temperature, which enabled an analysis of metastable phase transformations collectively with grain growth in the nanocrystalline tantalum films.
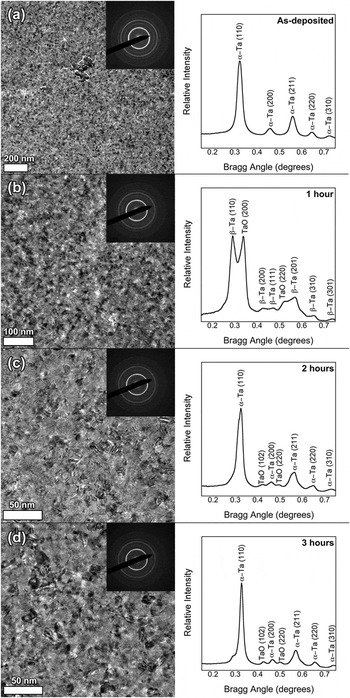
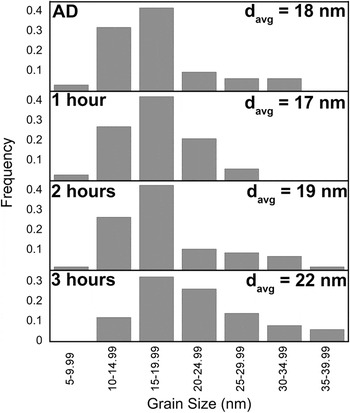
Heat treatments were initially conducted at 800 °C to investigate whether nanostructure instabilities derive from the α-to-β transition, which occurs in coarse-grained tantalum over the temperature range of 755–775 °C. Reference Read and Hensler28 The annealing temperature was selected just beyond this range to account for any small thermal gradients that develop due to the offset between the measurement area and heating element where the temperature is actually recorded. The as-deposited film exhibited an equiaxed nanocrystalline structure as evident in the bright-field image shown in Fig. 1(a), and indexing of the electron diffraction pattern confirmed that the films were single-phase α-Ta. The normalized integrated intensity profile, which provides a spectrum of the intensities from the electron diffraction pattern, did not exhibit peaks corresponding to any phase of tantalum oxide. Grain size analysis used the distribution shown in Fig. 2, which was determined from measurements conducted on the bright-field image and indicated the as-deposited film had an average grain size of 18 nm.
Bright-field images and integrated radial intensity profiles for (a) as-deposited nanocrystalline tantalum and following the 800 °C isothermal anneal for (b) 1 h, (c) 2 h, and (d) 3 h; all images were acquired at temperature. Minimal grain growth was observed in the bright-field images despite the reversible α-to-β transition and appearance of TaO after the 1 h anneal.

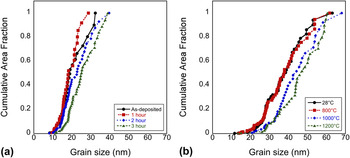
Grain size distributions for the heat treatment at 800 °C determined from the bright-field images in Fig. 1. While subtle shifts are evident in the distributions, the mean grain size remained constant through annealing within the error of the measurement.

Annealing of the film for 1 h at 800 °C induced a phase transition to β-Ta but did not produce discernible changes in the nanocrystalline structure and grain size distribution in Figs. 1(b) and 2, respectively. However, the transformation to β-Ta was accompanied by the appearance of the metastable TaO phase, which was attributed to the formation of a surface oxide layer based on the absence of distinguishable precipitates in the bright-field images. A transition back to α-Ta occurred after 2 h of annealing at 800 °C despite the consistent nanocrystalline structure in Fig. 1(c). This β-to-α-transition was attended by a substantial reduction in the intensity of the primary TaO peak in the integrated radial intensity profile, although the presence of higher angle TaO peaks indicated a thin surface oxide remained on the film. Continued heating for 3 h had no effect on the phases present in the film with α-Ta and TaO reflections evident in the integrated radial intensity profile. Conversely, coarsening of the nanostructure became apparent in the bright-field image shown in Fig. 1(d), and manifested as an increase in the average grain size to 22 nm. Despite this minor shift in grain size, the distribution was consistent with prior measurements in Fig. 2, confirming that grain growth at 800 °C in nanocrystalline tantalum was minimal and not influenced by the α-to-β transition.
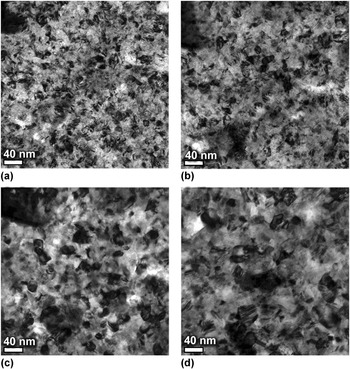
Results from in situ heating to 1200 °C of a separate tantalum film are shown in Fig. 3 with images presented at identical magnifications. This film in the as-deposited state also exhibited an equiaxed nanocrystalline structure in Fig. 3(a), and electron diffraction analysis confirmed that the films were single-phase α-Ta. Annealing to 800 °C produced no distinguishable change in the grain structure from the bright-field image shown in Fig. 3(b). The onset of grain growth was detected at 1000 °C where coarsening of the nanostructure became evident in Fig. 3(c). However, a further increase in the annealing temperature to 1200 °C produced no discernable change in the grain structure in Fig. 3(d). Electron diffraction analysis indicated that the film remained single-phase α-Ta throughout the entire in situ annealing experiment, which suggests that the minor TaO peaks derived from a thin surface oxide film and phase transformations did not influence nanostructure stability for the temperature and time combinations used in these measurements.
Bright-field images for (a) as-deposited nanocrystalline tantalum and following sequential annealing at (b) 800 °C, (c) 1000 °C, and (d) 1200 °C; all images were acquired at the respective temperatures. While grain growth is evident with increasing temperature, it plateaued at 1000 °C with nanostructure remaining stable up to the highest temperature of 1200 °C.

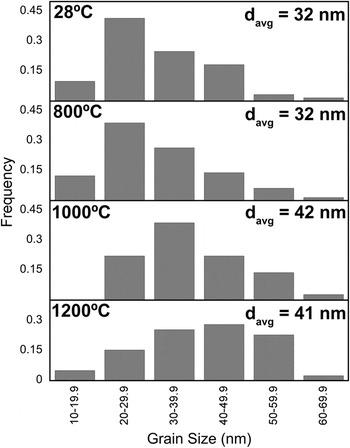
Grain size distributions were ascertained from the bright-field images and shown in Fig. 4 as a function of temperature. The as-deposited film exhibited a lognormal distribution with a mean grain size of 32 nm and range from 10 to 60 nm. The grain size distribution at 800 °C was nearly identical with a similar mean and range, thus confirming the qualitative observations from bright-field imaging. An increase in temperature to 1000 °C produced a subtle shift in the mean grain size to approximately 37 nm, which corresponded only to a 15% increase at roughly 33% the melting temperature of tantalum. While the final increase to 1200 °C was attended by a subtle broadening of the grain size distribution, no change was discernible in the mean grain size relative to the measurements at 1000 °C. As compared to a range of nanocrystalline metals, Reference Dake and Krill4–Reference Hibbard, McCrea, Palumbo, Aust and Erb6 the nanocrystalline Ta films synthesized by PLD exhibited unprecedented thermal stability, especially at 40% of the melting point where coarsening usually transpires at accelerated rates.
Grain size distributions as a function of temperature from the bright-field images in Fig. 3. The distribution stabilized above 1000 °C resulting in less than a 20 % change in the mean grain size relative to the as-deposited film.

IV. MOLECULAR DYNAMICS SIMULATIONS OF GRAIN GROWTH
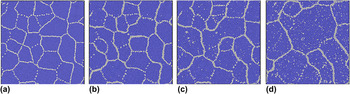
The exceptional thermal stability of the nanocrystalline tantalum films at 40% of their melting point conflicts with a wide range of literature on grain growth in nanocrystalline metals, where instabilities have been attributed to their thermodynamically unfavorable state and accommodated by mechanisms such as grain boundary migration and grain rotation. Reference Haslam, Phillpot, Wolf, Moldovan and Gleiter43 To gain a better understanding of the grain growth characteristics in pure nanocrystalline tantalum, MD simulations were conducted on 5 unique columnar nanocrystalline tantalum samples. One particular simulation structure is depicted in Fig. 5 following a 25 ns evolution at 25 °C [Fig. 5(a)] and 25 ns simulated anneals at elevated temperatures [Figs. 5(b)–5(d)].
Snapshots of the nanocrystalline tantalum structure with an average starting grain size of 10 nm following evolution for 25 ns at (a) 25 °C, (b) 725 °C, (c) 975 °C, and (d) 1225 °C. Abnormal grain growth initiated at 975 °C followed by extensive coarsening at 1225 °C after 25 ns of annealing. Atoms are colored according to their CNA values where blue represents BCC and gray other coordination numbers.

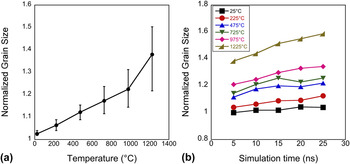
The average grain size of the structures evolved at room temperature remained within 2% of the initial 10 nm grain size used for the simulations. However, local structural reconfigurations were apparent particularly in low-angle grain boundaries as evidenced by the dislocation core structures that appeared in Fig. 5(a). The grain boundary network remained intact after evolution at 725 °C, but instabilities began to form in the high-angle grain boundaries as evident in Fig. 5(b) due to their enhanced mobility. These instabilities became accentuated at 975 °C with a number of boundaries being annihilated in Fig. 5(c) through grain boundary migration. At the highest temperature of 1225 °C shown in Fig. 5(d), grain rotation coupled to grain boundary migration contributed to the coalescence process and is commensurate with the mechanisms uncovered by Haslam et al. Reference Haslam, Phillpot, Wolf, Moldovan and Gleiter43 on columnar nanocrystalline palladium. The normalized grain size from the five simulation structures is compiled as a function of the evolution temperature in Fig. 6(a).
Normalized grain size plotted as a function of (a) temperature and (b) simulation time where the mean grain size and distributions in (a) were determined from the five different simulations. The trends plotted in (b) for the structure that exhibited an increase in grain size of greater than 50% at 1225 °C are indicative of positive grain growth rates at and above 975 °C.

As temperature was increased to 475 °C, a gradual increase in grain size up to approximately 10% was detected. The minimum and maximum values over this temperature range as captured by the error bars were less than ±1.5%, indicating that the grain structure evolved continuously at these temperatures. The normalized grain size continued to increase with increasing annealing temperature and exhibited a 22% increase following the 25 ns anneal at 975 °C with a broadened distribution of approximately ±6.5%. At the greatest relaxation temperature of 1225 °C, the average grain size increased by nearly 40% with a ±10% distribution of the mean. The broadened distributions signaled a transition to abnormal grain growth in the coalescence process, which is also apparent from the simulation snapshots shown in Fig. 5. Grain growth rates are directly related to the slopes of the grain size-evolution time data in Fig. 6(b), and the monotonically increasing trends indicate that the tantalum simulation structures will continue to coarsen over time especially above 775 °C. This extensive grain coalescence in nanocrystalline tantalum is in good agreement with the simulations on nanocrystalline palladium Reference Haslam, Phillpot, Wolf, Moldovan and Gleiter43 and substantiates that nanocrystalline structures in tantalum should be thermally unstable.
V. THE ROLE OF IMPURITIES IN STABILIZING PLD NANOCRYSTALLINE Ta FILMS
The MD simulations demonstrated the proclivity for nanocrystalline tantalum to experience extensive structural coarsening at temperatures comparable to the annealing conditions used for the PLD films. The grain size measurements described in Sec. III are summarized using the cumulative area fraction plotted for each annealing condition in Fig. 7. The steep slopes of the time series data in Fig. 7(a) were characteristic of sharp grain size distributions, and a slight shift in the overall grain size distribution was only apparent after the 3 h anneal at 800 °C. The film heat treated to higher temperatures in Fig. 7(b) exhibited a broader grain size distribution in the as-deposited state that was unaffected by annealing up to 800 °C, and consistent with the time series trends. At 1000 °C, an appreciable shift was evident in the grain size distribution, which stabilized with increased heating to 1200 °C. Grain growth in the experimental films was thus insignificant especially given the expectations from simulations and conflicting results relative to other thermal stability studies on nominally pure nanocrystalline refractory metals. Reference Chookajorn, Murdoch and Schuh7 Collectively, these findings point to an extrinsic stabilization mechanism unique to nanocrystalline tantalum films synthesized via PLD.
Cumulative area fraction distributions for the nanocrystalline tantalum films annealed at (a) 800 °C for up to 3 h and (b) varying temperatures up to 1200 °C. Shifts in the distributions to larger nanocrystalline grain sizes were only detected at 1000 °C, which produced a stable nanostructure at 1200 °C.

Oxygen incorporation in PLD films is known to occur during processing Reference Lowndes, Geohegan, Puretzky, Norton and Rouleau48 and given tantalum’s high affinity for oxygen, Reference Chopra49 the as-deposited films can be expected to contain oxygen in solid solution. A recent study on amorphous PLD tantalum films underscored the role of oxygen impurities in the formation of metastable oxides through devitrification. Reference Donaldson, Hattar and Trelewicz38 The appearance of a presumptive surface oxide accompanying the α-to-β transition in Fig. 1(b) suggests that the films either inherently contained oxygen or absorbed oxygen during processing. In addition to any oxygen that might be trapped during deposition, additional oxygen is likely incorporated via surface diffusion during annealing. On this data alone, it cannot be inferred that the surface oxides necessarily formed due to oxygen impurities initially present in the as-deposited films.
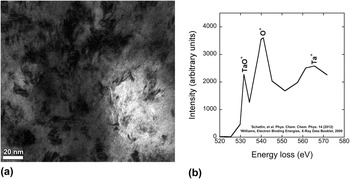
To address the initial impurity state, the as-deposited tantalum was characterized using EELS. The bright-field image of the region analyzed is shown in Fig. 8(a), and the EEL spectrum is depicted in Fig. 8(b) following a power-law background removal from the core-loss edge. The three peaks in the EELS pattern were attributed to TaO, Reference Schaltin, D’Urzo, Zhao, Vantomme, Plank, Kothleitner, Gspan, Binnemans and Fransaer50 O, Reference Williams51 and Ta, Reference Williams51 and indicate that the as-deposited films contained oxygen in solid solution as well as in a thin surface oxide layer prior to annealing. Two minor caveats are noted in the EELS analysis. First, identification of the TaO peak used the analysis conducted by Schaltin, et al., Reference Schaltin, D’Urzo, Zhao, Vantomme, Plank, Kothleitner, Gspan, Binnemans and Fransaer50 which considered simulated patterns for four different forms of tantalum oxide including Ta2O, TaO, TaO2, and Ta2O5. The latter two oxides exhibited doublet peaks and were thus neglected in this analysis. Of the remaining two oxides, only the TaO peak at approximately 533 eV aligned with the data in Fig. 8(b). Second, the presence of a copper oxide peak was considered since copper TEM grids were used. Although CuO has a peak at 531 eV, the TaO peak aligned more closely with the experimental data and agreed with the electron diffraction analysis in Fig. 1. Consequently, the peaks deriving from copper oxide and the other phases of tantalum oxide were ruled out in the analysis.
(a) Bright-field electron micrograph of the nanocrystalline tantalum film used for the EELS analysis and (b) EEL spectrum following a power-law background removal from the core-loss edge with peaks indexed for TaO, Reference Schaltin, D’Urzo, Zhao, Vantomme, Plank, Kothleitner, Gspan, Binnemans and Fransaer50 O, Reference Williams51 and Ta. Reference Williams51

The design of stable nanocrystalline alloys has focused predominantly on the addition of metallic elements that have a propensity to segregate to grain boundaries; however, impurity atoms can also inhibit grain growth Reference Michels, Krill, Ehrhardt, Birringer and Wu13 and thus have important implications for the stability of nanocrystalline metals. This has been demonstrated by Tang et al. Reference Tang, Gianola, Moody, Hemker and Cairney52 in magnetron-sputtered nanocrystalline Al where films containing greater amounts of oxygen in solid solution exhibited enhanced stability against mechanical and thermal grain growth, which was attributed to oxygen enrichment at the grain boundaries limiting their mobility. A similar finding was reported by Marvel et al. Reference Marvel, Yin, Cantwell and Harmer53 on electrodeposited nanocrystalline Ni–W alloys using aberration-corrected scanning transmission electron microscopy (STEM). In contrast to previous atom probe tomography measurements of tungsten segregation to grain boundaries, Reference Detor, Miller and Schuh54 high-angle annular dark-field (HAADF) imaging identified nanoscale tungsten oxide particles distributed along grain boundaries and triple points. Thermal stability was therefore ascribed to a Zener pinning effect deriving from nanoscale oxide formation at the grain boundaries, which represents a complementary mechanism to thermodynamic arguments for grain boundary energy reduction based on solute segregation to the grain boundaries. Reference Detor and Schuh55 Although nanoscale grain boundary oxides were not detected in our analysis, the presence of oxygen in solid solution and strong inclination for oxide formation in tantalum indicate that kinetic and thermodynamic driving forces collectively contribute to nanostructure stability in PLD tantalum films.
A final nanostructure destabilization mechanism particularly relevant to the PLD tantalum films relates to the competition between the nanocrystalline state and other equilibrium and/or metastable phases that become thermodynamically favorable depending on variables such as the temperature and impurity content. Reference Murdoch and Schuh32 For example, the formation of metastable β-Ta has been associated with the presence of oxygen during the nucleation stages of sputter deposition. Reference Feinstein and Huttemann56 The PLD tantalum films were initially single-phase α-Ta in their as-deposited state, but transformed to β-Ta during the 800 °C anneal and subsequently back to α-Ta upon continued heating. While these results were consistent with other annealing studies on nanocrystalline tantalum, Reference Navid and Hodge29 Javed et al. Reference Javed, Durrani and Zhu27 demonstrated that a 3-fold increase in the nanocrystalline grain size accompanied the β-to-α transition. The PLD tantalum films exhibited only subtle changes in the grain size distribution during annealing at 800 °C despite undergoing a reversible phase transformation. Therefore, the absence of grain growth during the α-to-β transition further substantiates the role of oxygen in stabilizing nanocrystalline grains in tantalum.
VI. CONCLUSIONS
Nanocrystalline tantalum films synthesized via PLD with as-deposited grain sizes in the range of 20–40 nm exhibited exceptional thermal stability at 40% of their melting point during in situ TEM annealing. The nanocrystalline grain size was also stable through the reversible α-to-β phase transition near 800 °C, and collectively these results conflict with a range of literature on grain growth in nanocrystalline metals. MD simulations of nanocrystalline tantalum demonstrated that extensive grain coalescence transpires at the temperatures used for the in situ TEM measurements. Oxygen impurities were identified in the films through EELS analysis of the as-deposited films, which indicated the presence of oxygen in solid solution as well as in a metastable form of tantalum oxide. The unusual thermal stability exhibited by the PLD nanocrystalline tantalum films was thus attributed to extrinsic stabilization mechanisms involving the suppression of grain boundary instabilities via impurities.
ACKNOWLEDGMENTS
Support for this work was provided for OKD, WW, and JRT by the National Science Foundation through Grant DMR-1410941. The authors gratefully acknowledge Michael Marshall of the Radiation–Solid Interaction Group at Sandia National Laboratories for his assistance in the preparation of the PLD samples and Dr. Eric Stach of the Center for Functional Nanomaterials at Brookhaven National Laboratory for his help with the EELS measurements. The authors would also like to thank Dr. Stephen Foiles of Sandia National Laboratories for valuable feedback on the MD simulations. Analytical TEM and atomistic simulations were conducted at the Center for Functional Nanomaterials, Brookhaven National Laboratory, which is supported by the U.S. Department of Energy, Office of Basic Energy Sciences, under Contract No. DE-SC0012704. Sandia National Laboratories is a multiprogram laboratory managed and operated by Sandia Corporation, a wholly owned subsidiary of Lockheed Martin Corporation, for the US Department of Energy’s National Nuclear Security Administration under contract DE-AC04-94AL85000.