INTRODUCTION
In response to global warming and the expectation of reduced fossil energy resources, the European Union has adopted ambitious goals to combat climate change: a reduction of greenhouse gas (GHG) emissions to 20% below 1990 levels and an increase in the share of energy consumption from renewable resources to 20% by 2020 (European Parliament 2009). In Germany, the introduction of the Renewable Energy Sources Act (EEG 2012), aiming to promote the development of renewable energy supply, and especially its amendments in 2004 and 2009 have led to a substantial expansion of biogas production with an estimated number of 7772 biogas plants (3530 MW installed electrical capacity) by 2013 (Fachverband Biogas 2013). Most biogas plants grow crops specifically for the purpose of mono- or co-digestion and it therefore has to be questioned whether the saving of fossil energy input (EI) can offset the GHG emissions resulting from crop production and substrate processing (Reinhardt Reference Reinhardt1993). This is especially challenging since silage maize, which is supposed to be more harmful to the environment than alternative energy crops such as grassland, is the dominating substrate supplied due to its higher dry matter and methane yield potential. Maize production, for instance, is assumed to cause considerable carbon loss by soil organic matter degradation (VDLUFA 2004). Furthermore, maize was shown to cause 20–30% higher nitrous oxide (N2O) fluxes (Senbayram Reference Senbayram2009) and higher nitrate leaching losses than grassland (Svoboda Reference Svoboda2011).
Since biogas production is not distributed evenly throughout the country, the environmental impact is of special concern. For instance, in the federal state of Schleswig–Holstein, northern Germany, a high density of biogas plants and dairy farms coincide on light sandy soils, characterized by a high risk of nitrate contamination of the groundwater.
Life-cycle assessment provides a suitable tool for a comprehensive evaluation of the environmental impact of products or processes along the whole supply chain (Cherubini et al. Reference Cherubini, Bird, Cowie, Jungmeier, Schlamadinger and Woess-Gallasch2009). When investigating the global warming mitigation potential of renewable energy systems, the GHG balance is of special importance. Available studies have shown that biogas use for the production of electricity and heat produces fewer GHG emissions compared with fossil fuels (Edelmann et al. Reference Edelmann, Baier and Engeli2005; Börjesson & Berglund Reference Börjesson and Berglund2006; Scholwin et al. Reference Scholwin, Michel, Schröder and Kalies2006; Plöchl et al. Reference Plöchl, Heiermann, Linke and Schelle2009; Jury et al. Reference Jury, Benetto, Koster, Schmitt and Welfring2010). However, the GHG balance of biogas production may vary substantially depending on a variety of factors such as the feedstock used (Plöchl et al. Reference Plöchl, Heiermann, Linke and Schelle2009), the choice of the reference system (Börjesson & Berglund Reference Börjesson and Berglund2006), the system boundaries (Jury et al. Reference Jury, Benetto, Koster, Schmitt and Welfring2010) and feedstock transport distances (Gerin et al. Reference Gerin, Vliegen and Jossart2008). This diversity of system boundaries and processes involved hampers a comparison among the environmental analyses. In addition, these studies are mainly based on average crop yields and default values obtained from literature, e.g. for N2O emissions, which do not reflect the variation caused by climate, site and crop management.
To overcome these limitations, a 2-year trial was conducted at two sites, representing two major landscapes of Schleswig–Holstein, northern Germany, aiming to quantify the methane yield potential and the environmental impact of different biogas substrate cropping systems (continuous maize, maize–cereal–grass rotation, perennial ryegrass ley), in terms of emission of climate relevant gases and nitrate leaching. This sound database then allowed (i) the quantification of GHG savings for the tested cropping systems and (ii) the derivation of optimization strategies.
MATERIALS AND METHODS
The field experiment
A 2-year trial was conducted at two experimental sites, Hohenschulen (HS) (E9°59′, N54°19′, 30 m a.s.l.), and Karkendamm (KD) (E9°57′, N53°55′, 17 m a.s.l.), of Kiel University in Schleswig–Holstein representing the eastern upland and the Geest, respectively. The annual precipitation in HS averages 750 mm and average daily temperature is 8·3 °C. The soil is classified as a pseudogleyic Luvisol of sandy loam structure (Sponagel et al. Reference Sponagel, Grottenthaler, Hartmann, Hartwich, Janetzko, Joisten, Kühn, Sabel and Traidl2005). The annual precipitation in KD averages 844 mm, with average daily temperature of 8·3 °C. The soil is classified as a gleyic Podzol of sandy structure (Sponagel et al. Reference Sponagel, Grottenthaler, Hartmann, Hartwich, Janetzko, Joisten, Kühn, Sabel and Traidl2005).
Altogether three cropping systems were investigated: (i) continuous maize in both HS and KD (R1), (ii) a maize–whole crop wheat–Italian ryegrass (intercrop) rotation (R2) in HS and (iii) a 4-cut perennial ryegrass ley (R3) in KD. Each crop of the rotation was grown in each year. All crops were harvested for silage. The investigations were carried out in a randomized block design with four replicates. To analyse the impact of fertilizer level on cropping system performance, crop fertilization treatments included four different N levels (N1–N4): 0, 120, 240 and 360 kg N/ha for wheat and maize and 0, 160, 320 and 480 kg N/ha for the perennial ryegrass sward. This approach allowed coverage of a reasonable range from unfertilized to oversupply and to estimate efficiencies and N losses also for oversupplied treatments, as in practice oversupply for maize often is the case. The effect of fertilizer type was examined for calcium ammonium nitrate (CAN) and biogas residue from co-fermentation (BR). For further details concerning the experimental design and crop management see Sieling et al. (Reference Sieling, Herrmann, Wienforth, Taube, Ohl, Hartung and Kage2013).
To project the trial data to typical regional farming conditions, a farm size of 100 ha, an average field size of 20 ha and a field–fermenter transport distance of 8 km were assumed. A contractor survey allowed identification of the type of machines generally used in the field for farms of similar size. The diesel fuel consumption of agricultural machinery was determined according to the KTBL-database (KTBL 2011). Upstream processes for machinery use were calculated to their expected useful life according to Gaillard et al. (Reference Gaillard, Hausheer and Crettaz1997), based on KTBL (2011) and Scholz (Reference Scholz1995). For conversion, a heat and power plant (500 kW, mono-fermentation) with a pilot injection engine, an electric efficiency of 0·40, a thermal efficiency of 0·415 and a heat utilization of 0·45 was assumed. Energy demand for plant operation was assumed to be 0·20 of the generated thermal energy for heat and 0·075 of the electric energy for electricity (Poeschl et al. Reference Poeschl, Ward and Owende2010). Methane slip was assumed to be 0·016 of the produced biogas amount (Felten et al. Reference Felten, Fröba, Fries and Emmerling2013).
Method of greenhouse gas balancing
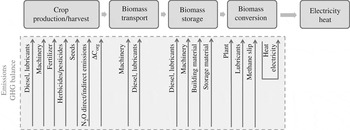
The present study provides a full chain analysis of GHG emissions and of the GHG mitigation potential of biogas production compared with fossil energy resources. The life-cycle inventory included four main segments: (i) crop production and harvest, (ii) biomass transport, (iii) biomass storage and (iv) the conversion of the biomass (Fig. 1). Based on the EI and output (EO), the net energy yield (NEY) was determined (Eqn 1), which was the underlying asset for the conversion into CO2 equivalents (kg CO2 eq). The analysis takes into account the production of the energy and material inputs into the system. Since the process analysis method was applied (Hülsbergen et al. Reference Hülsbergen, Feil, Biermann, Rathke, Kalk and Diepenbrock2001), the fossil energy inputs included were both direct and indirect. Direct (EIdir) energy use was defined as the EI in the crop production process, which can directly be converted into energy units, as for instance diesel-fuel, lubricants and electricity. The indirect energy use (EIind) comprises the EI arising from the provision of fuels, engine oils and lubricants, seeds, fertilizers, pesticides, equipment and buildings (Hülsbergen et al. Reference Hülsbergen, Feil, Biermann, Rathke, Kalk and Diepenbrock2001). As storage and conversion to biogas are included in the GHG balance, upstream processes for buildings (e.g. construction of the silo) and PE foil have also been considered. The EO was defined as the energy yield of a given cropping system after conversion to electricity and heat.
 $${\rm NEY} = {\rm EO} - (\Sigma ({\rm EI}_{{\rm dir}} ) + \Sigma ({\rm EI}_{{\rm ind}} ))$$
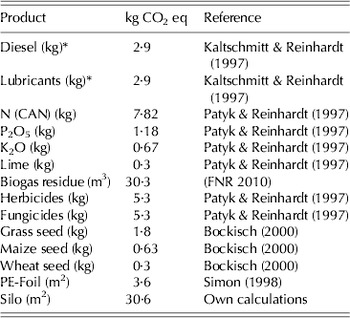
All emissions related to plant cultivation, transport, storage of energy crops and the conversion in a biogas plant were completely allocated to the biogas production process. Biogas residue from co-fermentation was considered to be a waste product from biogas production, therefore only emissions from its storage (90 days) were accounted for. As for the EI, all above-mentioned emissions caused by energy crop production, transport, storage and conversion were considered as CO2-equivalent (CO2 eq) emissions and obtained by multiplying the inputs with CO2 emission coefficients (Table 1). In addition, direct and indirect N2O emissions as well as emissions due to the loss of soil organic C and methane slip at the biogas plant were included in the GHG balance. To estimate the GHG mitigation potential of the different cropping systems, GHG emissions caused by biogas production were compared with a reference system for electricity and heat generation, based on the emissions of the German fossil grid mix for electricity (0·72 kg CO2 eq/kWhel) and natural gas for heat (0·31 kg CO2 eq/kWhth). Both components represent the average specific mix for energy generation based on fossil and nuclear sources (Öko Institut 2008).
System boundaries applied in the greenhouse gas balance.

Basic conversion factors for the calculation of indirect energy input in biogas production

* Diesel and Lubricants were considered to have the same CO2 eq.
Direct and indirect nitrous oxide emissions
Since direct N2O emissions from managed soils due to fertilization and denitrification play an important role in GHG balancing (Adler et al. Reference Adler, Del Grosso and Parton2007; Meyer-Aurich et al. Reference Meyer-Aurich, Schattauer, Hellebrand, Klauss, Plöchl and Berg2012), corresponding emissions were measured in the field trial (Senbayram Reference Senbayram2009) and considered in the analysis. Indirect N2O emissions were calculated according to IPCC (Reference Eggleston, Buendia, Miwa, Ngara and Tanabe2006) referring to data for N leaching (0·75% of N leaching loss) and ammonia volatilization (1% of NH3−N emissions), which were also quantified in the field trial (Gericke Reference Gericke2009; Svoboda Reference Svoboda2011).
Humus balance
The CO2 emissions or credits caused by an increase or decrease in soil carbon stocks were considered according to the humus balance approach (VDLUFA 2004), as established in the German Cross-Compliance regulation. In this approach, forage maize cultivation was assumed to cause a loss of 560–800 kg humus C/ha/yr (soil organic matter C). The application of cattle slurry can decrease the loss to 290–530 kg humus C when assuming a typical amount of 30 m3/ha. An optimal humus C balance is assumed to lie between −75 and 100 (VDLUFA 2004). Although this approach is questioned, since the impact of soil and climatic conditions is not taken into consideration, simulations for the KD site showed annual soil organic C losses of 660 and 270 kg C/ha for treatments highly supplied with mineral N or cattle slurry (Bleken et al. Reference Bleken, Herrmann, Haugen, Taube and Bakken2009), which is in agreement to the VDLUFA approach. Therefore, annual losses of 560 kg humus C/ha/yr for maize and 280 kg humus C/ha/yr for whole crop wheat were assumed. In contrast, cultivation of the Italian ryegrass cover crop and the perennial ryegrass ley was assumed to sequester 120 and 600 kg humus C/ha/yr, respectively. The carbon to be accounted for in the application of animal slurry and biogas residues varied between 4 and 6 kg humus C/t/yr, depending on the dry matter content.
Statistical analysis
The actual amounts of N applied as organic fertilizers unfortunately differed from the targeted N amounts, which did not allow conduction of analysis of variance. A regression analysis was applied to investigate the relationship between fertilizer N input and the emissions released by the biogas production and the reference system. The data were averaged over both years before analysis for better comparability.
To describe the relationship between GHG emissions and N input, as well as between the reference system and N input, a three-parameter exponential function was assumed. The relationship between the reference system and N-input is given, since the reference system describes the emissions arising from production of energy from fossil sources compared with those from the same amount of energy from biogas production at a certain N amount. The function is specified by the parameters a 1, a 2 and a 3 as follows:
 $$y(x) = a_{\rm 1} + (a_{\rm 2} - a_{\rm 1} ) \times ({\rm 1} - {\rm e}^{ - {\rm a3x}} )$$
where y denotes the emissions (kg CO2 eq/ha) caused by biogas or the reference system, x is the fertilizer N input (kg/ha), a 1 is the intercept, a 2 is the upper bound and a 3 determines the shape of the function.
Using the unfertilized plots as control for all N fertilizer types a curve was fitted separately for each combination of cropping system and N-type. Function parameters were obtained by applying a generalized reduced gradient method by means of MS Excel. Based on the estimated functions, the GHG mitigation potential (GMP) was obtained as the difference of the emissions from biogas production (EBP) and of the reference system.
RESULTS
Emissions of energy production by biogas
Since the GMP was obtained by subtracting the EBP from the emissions caused by the reference system, EBP first had to be determined for the different combinations of cropping systems (R1, R2 and R3) and N fertilizer types (CAN, BR).
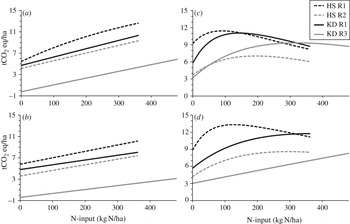
The results reveal that EBP generally increased with N-input (Figs 2 a and b). The highest EBP was seen for R1 at both sites. The EBP of R1 at HS increased to 12·5 and 11·1 t CO2 eq/ha for CAN and BR, respectively, i.e. increases with increasing N input of 132 and 74% for CAN and BR, respectively. The EBP of R1 grown at KD increased to 10·2 and 8·0 t CO2 eq/ha when fertilized with CAN and BR, corresponding to increases of 118% (CAN) and 66% (BR). The emissions for cropping system R2 were noticeably lower than for R1 at site HS for both N fertilizer types, where EBP ranged from 8·4 kg CO2 eq/ha (BR) to 9·3 kg CO2 eq/ha (CAN). Increases of 125% for crops fertilized with CAN and 130% for those fertilized with BR were seen. The lowest EBP was found for R3, with emissions ranging from −0·2 to 5·8 t CO2 eq/ha (CAN) and −0·4 to 3·1 t CO2 eq/ha (BR) (Figs 2 a and b). Thus a clear ranking with respect to EBP was identified, i.e. HSR1>KDR1>HSR2>KDR3. Furthermore, CAN application generally caused higher EPB than BR.
Relationships between total N-input (kg N/ha) and CO2 eq emissions for the production of energy via biogas (EBP) (a, b) and CO2 eq emission mitigation potential (GMP) (c, d) of three crop rotations: HSR1 (continuous maize; black dashed), HSR2 (maize–wheat–Italian ryegrass rotation, grey dashed), KDR1 (continuous maize; black solid), KDR3 (4-cut perennial ryegrass ley, grey solid). Fertilized with CAN (a, c) and biogas residue (b, d).

Greenhouse gas mitigation potential of energy production by biogas
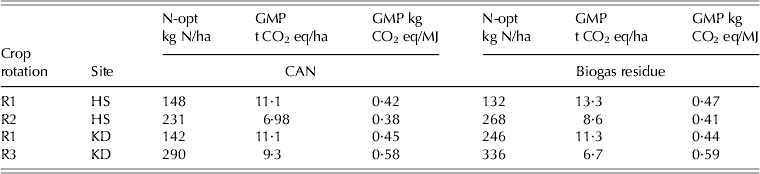
The GMP of the cropping systems at optimal N input is provided in Table 2. When relating GHG savings to the unit area of cropland, the energy production of R1 resulted in GHG savings of 11 t CO2 eq/ha for the CAN treatment at both sites. Considerably higher savings were achieved by the BR treatment at site HS. Cropping system R2 showed a similar N fertilizer effect, with BR outperforming CAN by 1·6 t CO2 eq/ha, but CO2 savings were generally lower compared with R1. The GMP of R3 was also lower compared with R1, but in contrast to R1 and R2, R3 exhibited an opposite response to N fertilizer type, where GMP for CAN supply exceeded that for BR by 2·6 t CO2 eq/ha. In summary, R1 shows the highest GMP at both sites, followed by R2 at HS and R3 at KD.
GHG mitigation potential (GMP) for optimal N supply (N-opt) (kg N/ha), i.e. N-supply for achieving the maximum net energy yield for fertilizer types Calcium ammonium nitrate (CAN) and biogas residue (BR)
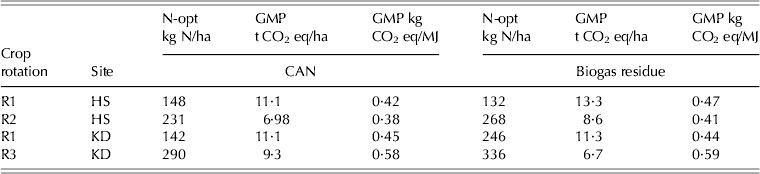
Carbon dioxide savings related to the unit of energy produced (electricity and heat) varied from 0·38 to 0·59 kg CO2 eq/MJ. At site HS, cropping system R1 performed slightly better than R2. At site KD, R1 resulted in a considerably lower CO2 saving potential than R3, which contrasts with the results found for the area-related GMP.
Emission sources from energy production by biogas
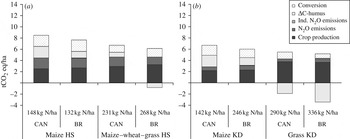
Apart from the total EBP, the composition of the emissions produced by energy generation via biogas at the optimal N input was investigated, which was defined as the N-supply for achieving the maximum net energy gain. These emissions were clearly dominated by the provision of substrates, i.e. crop production, direct and indirect N2O emissions and CO2 emissions from changes in soil C stocks (Figs 3 a and b). Negative emissions (△C-humus), i.e. CO2 savings, in R3 were due to an assumed soil C sequestration, as noted previously. Direct N2O emissions, which had been hypothesized to show an effect of N fertilizer type, revealed no clear differences between the CAN and BR treatments. In contrast to N fertilizer type, a clear site effect became evident for R1, where the direct N2O emissions at site HS exceeded those at site KD by c. 2·0 t CO2 eq/ha for both the CAN and the BR treatments. Emissions related to conversion reflected the methane yield potential of the tested cropping systems.
Components included in the GHG emission calculation for (a) R1 and R3 at KD (b) and R1 at HS and KD, based on the net energy yields at optimal N input.

The calculation of the indirect N2O emissions due to nitrate leaching was based on the findings of Svoboda (Reference Svoboda2011), showing that (i) nitrate-N load increased non-linearly with N input, (ii) CAN application caused higher N leaching loss than biogas residues, (iii) R1 grown at the KD site resulted in considerably higher N loss than R3; at the HS site R1 and R2 caused similar nitrate leaching at optimal N input, whereas losses increased more sharply for R1 in case of N oversupply. The indirect N2O emissions from leaching, however, gave an overall low contribution to total GHG emissions, as indicated by values ranging from 40 to 42 kg CO2 eq/ha for R3, 122 to 329 kg CO2 eq/ha for R2, and 137 to 249 kg CO2 eq/ha for R1, fertilized with CAN and BR, respectively.
DISCUSSION
Emissions and greenhouse gas mitigation potential of energy production by biogas
All cropping systems investigated in the current study revealed net CO2 savings for electricity and heat produced via biogas compared with fossil fuels. The type of N fertilizer and in particular the N amount as well as the choice of crop substrate clearly affected the GHG mitigation potential, which has also been reported by Gerin et al. (Reference Gerin, Vliegen and Jossart2008) and Plöchl et al. (Reference Plöchl, Heiermann, Linke and Schelle2009). A high GMP, however, does not necessarily imply a low EBP, as became evident when comparing the different cropping systems. This was reflected by R1 in particular, where despite having the highest EBP at both sites, it was able to outperform R2 (site HS) and R3 (site KD) in terms of GMP. The high EBP for R1 was mainly caused by a higher loss of soil carbon and higher N2O emissions (Eder et al. Reference Eder, Papst, Darnhofer, Eder, Schmid and Hülsbergen2009; Senbayram Reference Senbayram2009). In addition, R1 was characterized by high emissions for conversion, which are known to be closely related to substrate methane yield (Scholwin et al. Reference Scholwin, Michel, Schröder and Kalies2006; Eder et al. Reference Eder, Papst, Darnhofer, Eder, Schmid and Hülsbergen2009). The better performance of R1 with respect to methane yield and NEY thus could offset its higher GHG emission level. The unexpectedly lower performance of R2 may be attributed to specific experimental conditions, i.e. a low winter wheat yield due to negative effects from preceding crops and a suboptimal management of the Italian ryegrass (Sieling et al. Reference Sieling, Herrmann, Wienforth, Taube, Ohl, Hartung and Kage2013). The fertilizer effect for R3, showing a noticeably lower GMP for BR than for the treatment with CAN, can probably be explained by a higher ammonia emission after BR application and a lower short-term N availability of BR.
Differences in the ranking among the cropping systems with respect to the area and energy unit-based evaluation indicate that, depending on the environmental conditions, agricultural structures and policy conditions, the preference of farmers for substrate cropping systems may vary. Grassland was superior with respect to GMP per unit of energy produced, but had a low area-based GMP. Considering the high pressure on land and the ongoing food or fuel discussion in western Europe, this may be regarded as a disadvantage. Under such conditions, maize-based substrate cropping systems seem more favourable for many regions.
Emission sources from energy production by biogas
With respect to optimization strategies for improving the sustainability of biogas production, the components accounting for large shares of emissions had to be identified. Emissions resulting from plant production with a share of 0·30–0·51 were considerably higher than those for conversion (0·09–0·28) (Figs 3 a and b), which is in agreement with previous studies (Börjesson & Berglund Reference Börjesson and Berglund2006; Bachmaier et al. Reference Bachmaier, Effenberger and Gronauer2010). The use of diesel fuel and machinery and emissions from fertilizer production were identified as the major contributors to the overall GHG emissions of the crop production phase. Differences between mineral N fertilizer and BR were less pronounced than expected. The diesel fuel demand for spreading BR overcompensated its credits for GHG savings from manure storage and the higher energy demand for mineral N fertilizer production. As the emissions from BR storage accounted for 0·30–0·50 of the total emissions of crop production, the positive contribution of biogas crops to the CO2 mitigation potential of biogas production is constrained. These emissions can be avoided by gas-tight covers (Vetter et al. Reference Vetter, Heiermann and Toews2009). However, it must be pointed out that a more comprehensive database has to be developed for a more reliable estimation of storage losses.
Direct nitrous oxide emissions
Another important component of the EBP is the field-related N2O emission, where an impact of N fertilizer type had been hypothesized. However, in the field trial underlying the current study, no clear differences could be detected between the CAN and BR treatments (Senbayram Reference Senbayram2009). This was probably attributable to soil water conditions, as a lab experiment revealed higher emissions for BR than mineral N application only at high soil moisture content.
It is well known that the denitrification rate is influenced by soil organic C and nitrate-N availability (Klemedtsson et al. Reference Klemedtsson, Von Arnold, Weslien and Gundersen2005), pH (Šimek & Cooper Reference Šimek and Cooper2002) and oxygen diffusion, which largely depends on water availability and the water- and air-filled pore space in soil and soil texture (Dobbie & Smith Reference Dobbie and Smith2001). This may explain the observed site effect on N2O emissions, apparent for R1 grown at sites HS and KD. The difference of direct N2O emissions amounted to 2 t CO2 eq/ha, as due to soil texture (sandy loam in HS, sandy structure in KD) differences in soil water supply and N dynamics occurred. Despite a somewhat higher precipitation at KD as well as periodically high ground water levels, the soil moisture content was usually lower than at site HS, due to a lower water retention capacity. A detailed qualitative and quantitative description of the processes at play at these sites is given by Senbayram (Reference Senbayram2009) and Dittert et al. (Reference Dittert, Senbayram, Wienforth, Kage and Muehling2009).
Slightly higher direct N2O emissions determined for the mineral N compared with the BR at optimal N input (Fig. 3) for R1 grown at site HS are most likely due to different N amounts. In agricultural practice, where N supplied to maize often exceeds crop demand, emissions could be reduced by an optimization of fertilizer management.
Indirect nitrous oxide emissions due to nitrate leaching
Compared with the remaining components of the emissions from energy production by biogas, the indirect N2O emissions due to nitrate leaching can be considered as almost negligible. As the indirect N2O emissions were calculated according to IPCC (Reference Eggleston, Buendia, Miwa, Ngara and Tanabe2006) referring to data for N leaching (0·75% of N leaching loss), even a potential future revision of the IPCC values would not change the general impact on GMP of the investigated cropping systems.
However, sustainable biogas production from renewable sources needs to be monitored by a comprehensive impact analysis. Therefore, it is essential to estimate potential trade-offs with respect to other environmental concerns beyond the GMP, especially the protection of water bodies. As shown by Svoboda et al. (Reference Svoboda, Taube, Kluß, Wienforth, Kage, Ohl, Hartung and Herrmann2013), R1 caused substantially higher nitrate leaching than R3 at site KD, but nitrate loss stayed within acceptable ranges and did not conflict with critical values for the distribution of drinking water, when fertilized according to crop demand. In practice, however, maize often is oversupplied. When relating the nitrate loss to the unit of methane produced the higher methane yield/ha of R1 could not compensate for its higher nitrate loss compared with R3.
Comparison with the default values by Renewable Energy Directive
Compared with fossil fuel-based electricity and heat generation, GHG savings of up to 76% were achieved on a per area basis. This is in good agreement to findings from a scenario study by Meyer-Aurich et al. (Reference Meyer-Aurich, Schattauer, Hellebrand, Klauss, Plöchl and Berg2012), where GHG savings of up to 75% were documented. The sustainable criterion set by the Renewable Energy Directive (RED) stipulates a mitigation of GHG emissions by biofuels of at least 35% relative to GHG emissions from fossil energy production. This criterion will be increased to 50% in 2017 and to 60% in 2018 (European Parliament 2009). Thus, electricity and heat generation from biogas in the current study can comply with the actual sustainability criterion for biofuels set by the RED. A further improvement of the GMP could be achieved by the use of a gas engine instead of a pilot injection engine, as the injection engine uses additional ignition oil. Moreover, if this oil originates from fossil sources, a reduction of c. 35% of the emissions for conversion could be achieved.
Although electricity and heat generated from biogas are not yet considered by the RED, there is a debate about whether to include these sustainability issues in national regulations in Germany. Furthermore, there are discussions about whether to apply the default value for natural gas (69 g CO2 eq/MJ) as a reference for GHG emission from fossil energy production in case of biogas. Under these circumstances, the mitigation criterion of 50% would only be met by the BR fertilized variants.
CONCLUSIONS
The production of energy from agricultural resources can substantially contribute to the mitigation of GHG emissions. The current study highlights the variability of the mitigation effect as emissions originating from crop production have a major impact on the CO2 saving potential, unless the digestate storage is not covered. Therefore, cropping systems tailored to site conditions and N fertilization adjusted to crop demand are key for sustainable biogas production. Apart from climate protection, environmental policy covers a number of other issues, such as the water, soil and air quality or the conservation of biodiversity, and it has to be envisaged that trade-offs may occur. Thus, there is a requirement for regionally differentiated and balanced climate, water and nature protection measures.