Introduction
With the advent of additive manufacturing (AM), many materials and applications have benefited from the ability to 3D print complex structures.[Reference Bourell, Rosen and Leu1] Layer-by-layer printing processes allow rapid production of complex geometries enabling significant capability improvements across multiple domains. Examples include low-cost rapid prototyping, part count reduction in jet engines, increased complexity in sand casting molds, and light-weighting of ceramic components.[Reference Huang, Liu, Mokasdar and Hou2,Reference Ngo, Kashani, Imbalzano, Nguyen and Hui3] To date, however, the research of additively manufactured semiconductors has been minimal. The ability to print complex geometry, single-crystal semiconductor materials will revolutionize the way high power electronics are fabricated.
Current semiconductor device architectures are limited to what is achievable using standard semiconductor device fabrication methods, which are usually a combination of thin-film deposition, etching, regrowth, and other processing steps to develop a final device.[Reference Fortunato, Barquinha and Martins4,Reference Morkoç, Strite, Gao, Lin, Sverdlov and Burns5] Process and material limitations on material quality, process speed, dimensional accuracy, and achievable geometries restrict the development of new device architectures. Being able to additively build semiconductor structures could reduce the cost associated with more complex device structures that can only be formed through multiple etch and growth steps using current processes. This benefit is of particular interest for wide bandgap semiconductor materials such as gallium nitride (GaN). GaN is a material widely used in optoelectronic, high-power, and high-frequency device applications due to its wide (3.4 eV) direct bandgap.[Reference Chow and Tyagi6] Furthermore, ternary compounds such as AlGaN can be formed with even wider bandgaps tailored to specific applications, making GaN an important base material for high-power devices. As current device limitations are being reached, there is an interest in developing more complex vertical device architectures and lower dislocation density material to further push GaN devices to the material limits.[Reference Kizilyalli, Edwards, Aktas, Prunty and Bour7] Furthermore, the ability to print semiconductor material as desired, would allow for consideration of new device architectures that are currently too costly, or impossible to make with current fabrication methods, thus allowing for novel solutions to rapidly approaching device limitations.
The lack of semiconductor AM research stems in large part from the difficulty of adapting common AM methods to electronic materials.[Reference Saengchairat, Tuan and Chee-Kai8] Most semiconductor devices require single-crystal material with low defect densities in order to maintain the electrical properties necessary for device operation. Grain boundaries act as carrier scattering sites which severely limit the capabilities of any fabricated devices. Typical AM processes involve localized melting, severe plastic strain, consolidation of randomly oriented particles, or chemical crosslinking, all of which tend to generate polycrystalline structures.[Reference Wei, Mazumder and DebRoy9,Reference Rödel, Kounga, Weissenberger-Eibl, Koch, Bierwisch, Rossner, Hoffmann, Danzer and Schneider10] These mechanisms are generally easy to scale and allow some degree of control over the texture and size of the resulting grain structure. In metals, ceramics, and certain polymers, grain size control is a commonly used method to alter or enhance mechanical properties, limiting the drive to develop processes suited for single-crystal manufacturing. Finally, many semiconductor synthesis technologies require extremely clean, high vacuum, and/or hazardous ambients, which are unachievable with most standard AM equipment. Therefore, a new process is required to fabricate 3D printed semiconductors by combining the methodologies of both AM and semiconductor synthesis processes.
In this work, we will present a newly developed method for 3D printing of semiconductor GaN, a material of great interest for a variety of high power and radio frequency applications. A step-wise experimental procedure will be discussed which was used to isolate critical variables for the printing process. The effect of three major variables—melt volume, native oxide formation, and wetting effects—will be discussed to demonstrate the potential of the method and outline the critical challenges moving forward.
Process
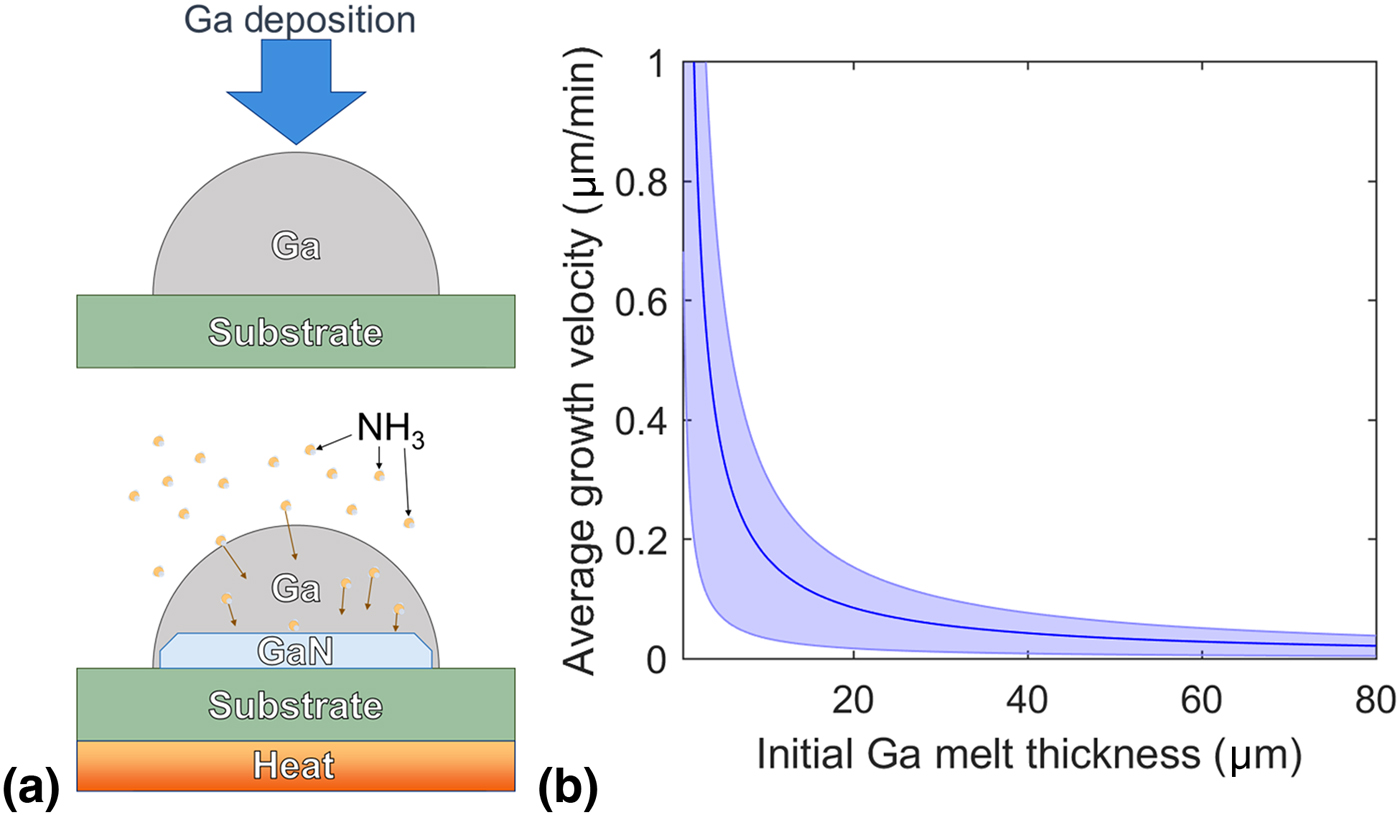
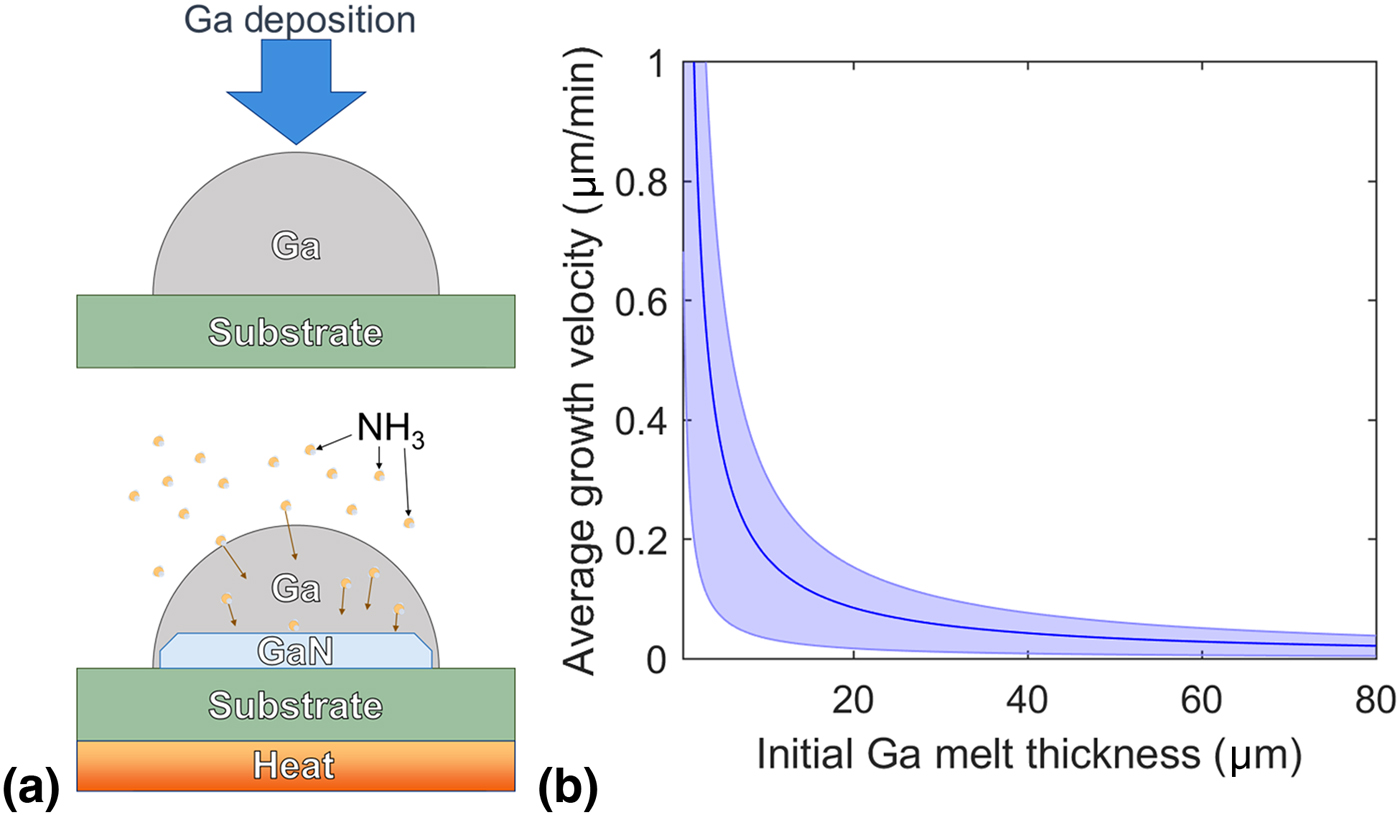
Most current methods for GaN fabrication rely on gas-phase reactions at high temperature to form epitaxial thin films on atomically symmetric substrates, but these methods are unsuitable for 3D printing processes due to the difficulty of localizing the deposition area with gas-phase source materials. Moreover, the use of a reaction-based process is preferred over using GaN feedstock for a number of reasons. One reason is that starting with a powder feedstock (similar to the selective laser melting AM process) results in a polycrystalline material, which is unsuitable for most compound semiconductor applications. Secondly, heating GaN powder to near melting temperatures will result in loss of nitrogen from the structure, loss of stoichiometry, and detrimental defect formation due to the significant difference in vapor pressure between gallium (Ga) and nitrogen (N). Finally, the melting point for a GaN feedstock is very high (~2500 °C), but reaction temperatures used for a variety of commercial reactive GaN synthesis processes are significantly lower (<1200 °C) resulting in significant savings in cost and energy. Therefore, a reactive printing method has been developed which uses a combination of liquid and gas reactants in order to control localized printing with the liquid precursor but also obtain the benefits of a reaction-based process. The reported method will be referred to as gas-phase reactive additive manufacturing (GRAM). The GRAM process is based on liquid-phase epitaxy (LPE), a well-researched film synthesis method that has been used to form single-crystal GaN thin films on epitaxial substrates in prior literature.[Reference Klemenz and Scheel11,Reference Azizi, Meissner, Friedrich and Muller12] The LPE process uses a bath of molten Ga as a liquid-phase precursor, while a reactant gas (ammonia) is bubbled into the melt at elevated reaction temperatures (>700 °C). A seed crystal is submerged in the melt to provide a site for epitaxial growth of the GaN crystal structure as the reaction proceeds. The GRAM process will build off this prior research by extrusion printing the molten Ga precursor onto an epitaxial sapphire substrate, then reacting the printed material with NH3 at elevated temperatures, as shown schematically in Fig. 1(a). Several research groups have already demonstrated printing of liquid Ga and similar eutectic metals for other applications using an extrusion printing process.[Reference Dickey13,Reference Ladd, So, Muth and Dickey14] Although the exact optimization of the GRAM process is different than that reported for LPE grown GaN films, prior work was used to guide optimization during the reported work. In this paper a specific focus will, therefore, be given to critical variables affecting the GRAM process, in particular, the effect of reduced melt volume/thickness, oxide formation, and wetting of the liquid precursor on the degree of crystallization and final crystal orientation. The described work was organized in such a way as to isolate and test critical variables discretely and determine the viability of those variables with minimal interplay between printing and crystallization variables before a full printing process was developed.
(a) Schematic showing the proposed conversion process with Ga droplet deposition on top, and NH3 diffusion through the droplet and conversion to GaN on the bottom. (b) Average growth velocity versus Ga melt thickness as calculated from a one-dimensional diffusion model of a half-spherical droplet of Ga. Blue area included shows uncertainty from solubility estimations.
Results and discussion
The first variable of concern was printing/crystallization speed. A major potential benefit over current semiconductor processing is the ability to print structures from the bottom-up and eliminate etch/regrowth steps which slow down the fabrication process. The LPE process, however, is not in widespread industrial use for GaN film synthesis due to the slow growth rates of the method as compared with other commercial methods such as chemical vapor deposition and hydride vapor-phase epitaxy (HVPE). The slow growth rates of the LPE process have been related to the low solubility and diffusivity of NH3 in the Ga melt in prior studies.[Reference Logan and Thurmond15] The GRAM process requires each layer of liquid metal to be converted before another layer is deposited in order to maintain epitaxial continuity between layers. Therefore, the reduced crystal growth rate of the LPE process could result in an even slower overall synthesis process which may offset the proposed benefits of the GRAM process. It was, however, hypothesized that decreasing the liquid melt volume would increase the overall crystallization rate by decreasing the diffusion length to the seed crystal/substrate compared with the standard LPE process. To test this hypothesis, computational modeling was used to estimate growth velocities in a decreased melt volume. A one-dimensional diffusion model for NH3 in liquid Ga was used, presuming a concentration of NH3 at the Ga surface at the solubility limit, c max, and total conversion to GaN at the solidification interface, so that the flux of N species consumed by GaN growth is equal to the diffusive flux. The growth rate is thus predicted to increase transiently as the Ga melt is consumed, and the resulting average growth rate is
 $$\bar{v} = g\left( {1 + \displaystyle{{M_{\rm N}} \over {M_{{\rm Ga}}}}} \right)\displaystyle{{\rho _{{\rm Ga}}} \over {\rho _{{\rm GaN}}}}\displaystyle{{Dc_{{\rm max}}} \over {L_0}}$$
where M i and ρ i are the molar mass and density of materials i, and D and c max are the diffusivity and solubility of NH3 in liquid Ga. Although the model is one-dimensional, the factor g accounts for the geometry of the Ga melt based on the average distance that NH3 must diffuse before conversion. Representative values of g are 1, 1.6, and 2 for uniform thickness, half-cylinder, and half-sphere melt geometries, respectively. A half-sphere melt geometry was used to estimate a droplet of Ga deposited onto a surface. At 1000 °C, the diffusivity was estimated as 1.3 × 10⁻⁴ cm2/s[Reference Klinedinst and Stevenson16,Reference Liu, Long, Wang, Du and Huang17] and the solubility was estimated as (1.0 ± 0.8) × 10−6 at.%,[Reference Unland, Onderka, Davydov and Schmid-Fetzer18,Reference Garcia, Ren, Thomas and Ponce19] which dominates the uncertainty. The resulting velocities as a function of initial height of a half-spherical droplet are shown in Fig. 1(b). Based on these growth velocity estimations, including the uncertainty in the solubility estimation as shown in Fig. 1(b), a 10 µm printed Ga layer will result in crystal growth rates between 0.035 to 0.30 µm/min which are in the range of reported values for GaN films grown by metal-organic chemical vapor deposition (MOCVD).[Reference Ambacher20] It is worth noting that the model assumes crystallization of GaN only occurs at the substrate surface. Without this simplifying assumption, the effect of GaN formed in the bulk of the melt must be taken into account with respect to effective diffusivity of nitrogen species in the melt. Experimentally optimizing the process parameters of the crystallization process (i.e., NH3 flow, temperature, etc.) can result in preferential crystallization at the substrate surface, which is a key factor in the ability of the proposed process to form epitaxial, single-crystal material. Therefore, based on the goal of forming single-crystal, epitaxial GaN, this assumption was deemed appropriate for the purposes of estimating the growth rate of the GRAM process. Based on the above results, initial experiments were performed to support these calculations and demonstrate improved crystallization rates at reduced melt volumes in order to show the viability of the liquid–gas reaction process for a 3D printed semiconductor system.
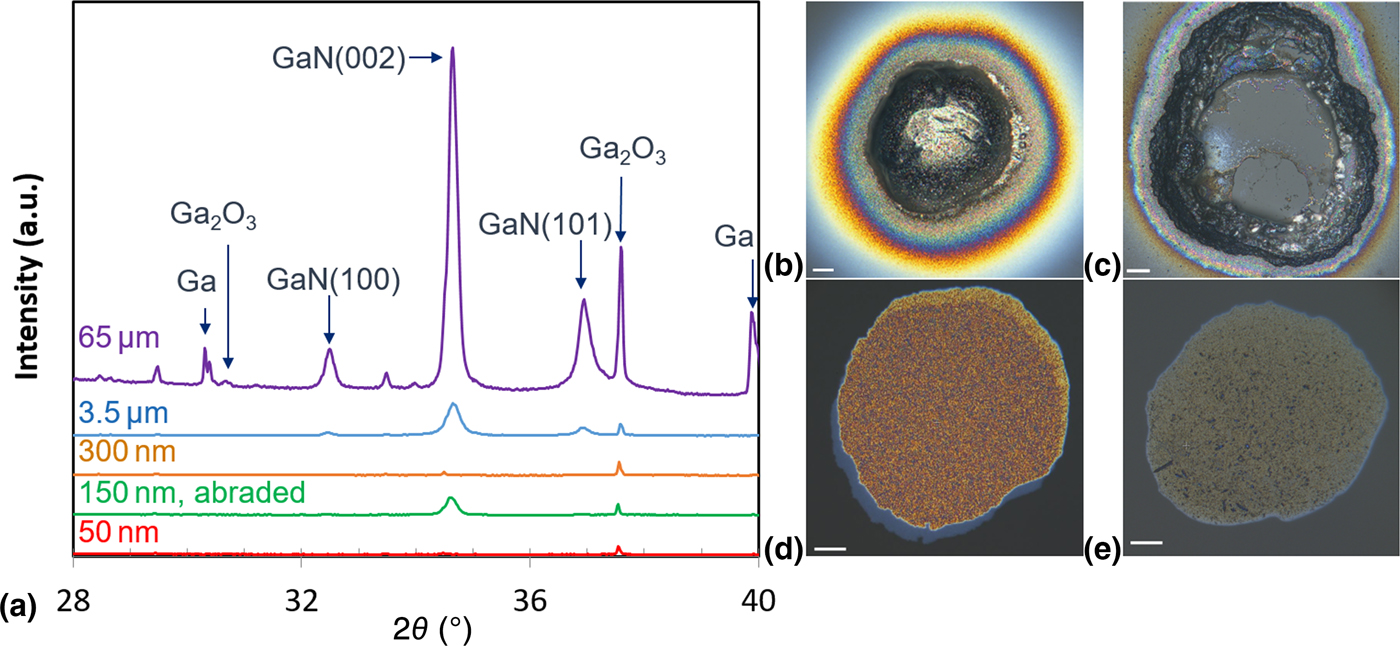
A set of experiments was set up to test the increased crystallization rate proposed in the above model. To isolate the effect of thickness from various printing parameters, Ga test patterns were deposited onto a c-plane sapphire substrate using thermal evaporation in conjunction with a shadow mask to create a pattern of circles and bars with varying dimensions. Using the shadow mask, Ga patterns of various thicknesses were deposited in order to test the effect of thickness on crystallization time. After Ga deposition, the patterns were placed in a chamber with a N2/NH3 gas mixture flowing over the sample as it was heated to a reaction temperature of 1050 °C. The samples were then held at temperature for various lengths of time to induce crystallization of GaN within the pattern. N2:NH3 ratios from 1.25 to 50 were used by varying the rate of NH3 flow while holding the N2 flow constant. A visible transition of opaque Ga metal to transparent GaN was observed at high temperatures and was used as a rough metric of the timescale for initial crystallizations to ensure complete visual conversion before cooling the samples. Ex situ optical microscopy and x-ray diffraction (XRD) were performed to study the change in morphology and degree of crystallization. Results from samples with varying thicknesses of deposited Ga are shown in Fig. 2. It is worth noting that the 65 µm sample was submitted to a N2:NH3 ratio of 1.25 in order to increase the rate of crystallization in the final sample as much as possible and was held at temperature for 30 min at which time the pattern visibly stopped transitioning from opaque to transparent. All other samples shown in Fig. 2(a) were held at temperature for only 5 min with N2:NH3 = 25 and observed a similar visible transition, despite the shorter time and lower NH3 flow. Some GaN formation was observed in the 65 µm sample, but Ga metal peaks remained prominent in the XRD spectrum shown in Fig. 2(a) despite the longer time at temperature. This is in line with the modeling results in Fig. 1 which suggested a crystallization time in excess of 2 h was necessary for full conversion at this thickness. As deposition thickness was decreased to 3.5 µm, the Ga peaks were significantly reduced, with only a slight peak visible at ~39.6° despite the lower crystallization time and NH3 flow. As thickness was decreased further, below 300 nm, no presence of GaN or significant Ga was observed in XRD, but a Ga2O3 peak remained. It is worth noting that the slight Ga peak at 39.6° remained in thinner samples, even at crystallization times up to 30 min. It was thought that this residual Ga was trapped in between polycrystalline GaN grains which prevented NH3 diffusion and halted full conversion of the structure.
(a) XRD 2θ scans of converted GaN with varying thicknesses of Ga deposited by thermal evaporation. The 150 nm thick sample had the native oxide abraded from the surface directly prior to conversion. (b)–(e) Optical microscopy images of (b) ~65 µm thick Ga, (c) 65 µm Ga post-GaN conversion process, (d) 50 nm Ga, and (e) 50 nm Ga post-GaN conversion process. Scale bars = 15 µm.

To understand the disappearance of GaN peaks at samples ≤300 nm, optical microscopy was used to study the morphology of Ga droplets before and after crystal conversion. When observed in optical microscopy, ≥3.5 µm thick samples showed movement in the droplet after the crystallization process which exposed the sapphire substrate underneath, as shown through optical images of patterned circles before [Fig. 2(b)] and after [Fig. 2(c)] crystallization. Samples that were ≤300 nm, however, showed little change in the printed droplet morphology after conversion as shown in Figs. 2(d) and 2(e). This is important for two reasons. First, the significant movement shown in the 65 µm droplet that exposed the underlying transparent sapphire was likely the cause of the observed visible transition from opaque to transparent while at temperature despite the fact that significant Ga remained unconverted. The second reason this is important is due to the oxide peak present in the XRD spectra of all samples. Ga readily forms a native oxide and, based on the Ga2O3 peak in the sample spectra, it is likely an oxide formed on the evaporated Ga patterns due to the time the sample was exposed to air while it was transferred from the thermal evaporation chamber to the NH3 annealing furnace. Based on the lack of morphology change in ≤300 nm depositions and the presence of oxide in the XRD, it was suggested that the movement which occurred in the thick deposited Ga acted to disrupt the native oxide shell, allowing NH3 to diffuse into the bulk of the melt and convert Ga to GaN. The lack of movement in the thinner droplets would have resulted in a more mechanically stable Ga2O3 shell which could have prevented diffusion of the reactant gas to the bulk of the Ga metal. To test this theory, a 150-nm-thick sample was submitted to the same crystallization process as the 300 and 50 nm samples, except the 150 nm pattern was lightly abraded with a clean swab directly prior to loading in the crystallization furnace in order to disrupt the Ga2O3 shell. XRD results show that the presence of an abrasion step resulted in GaN peaks present in the XRD after 5 min of crystallization indicating the oxide shell was indeed preventing crystallization of GaN. These results demonstrate a crystallization rate of roughly 0.03–0.7 µm/min, assuming crystallization only occurred during the 5 min anneal at 1050 °C, which experimentally supports the range of crystallization rates predicted by the model presented in Fig. 1. Furthermore, these results show the need to prevent oxide formation in printed Ga for the GRAM process to be a viable method to form single-crystal GaN.
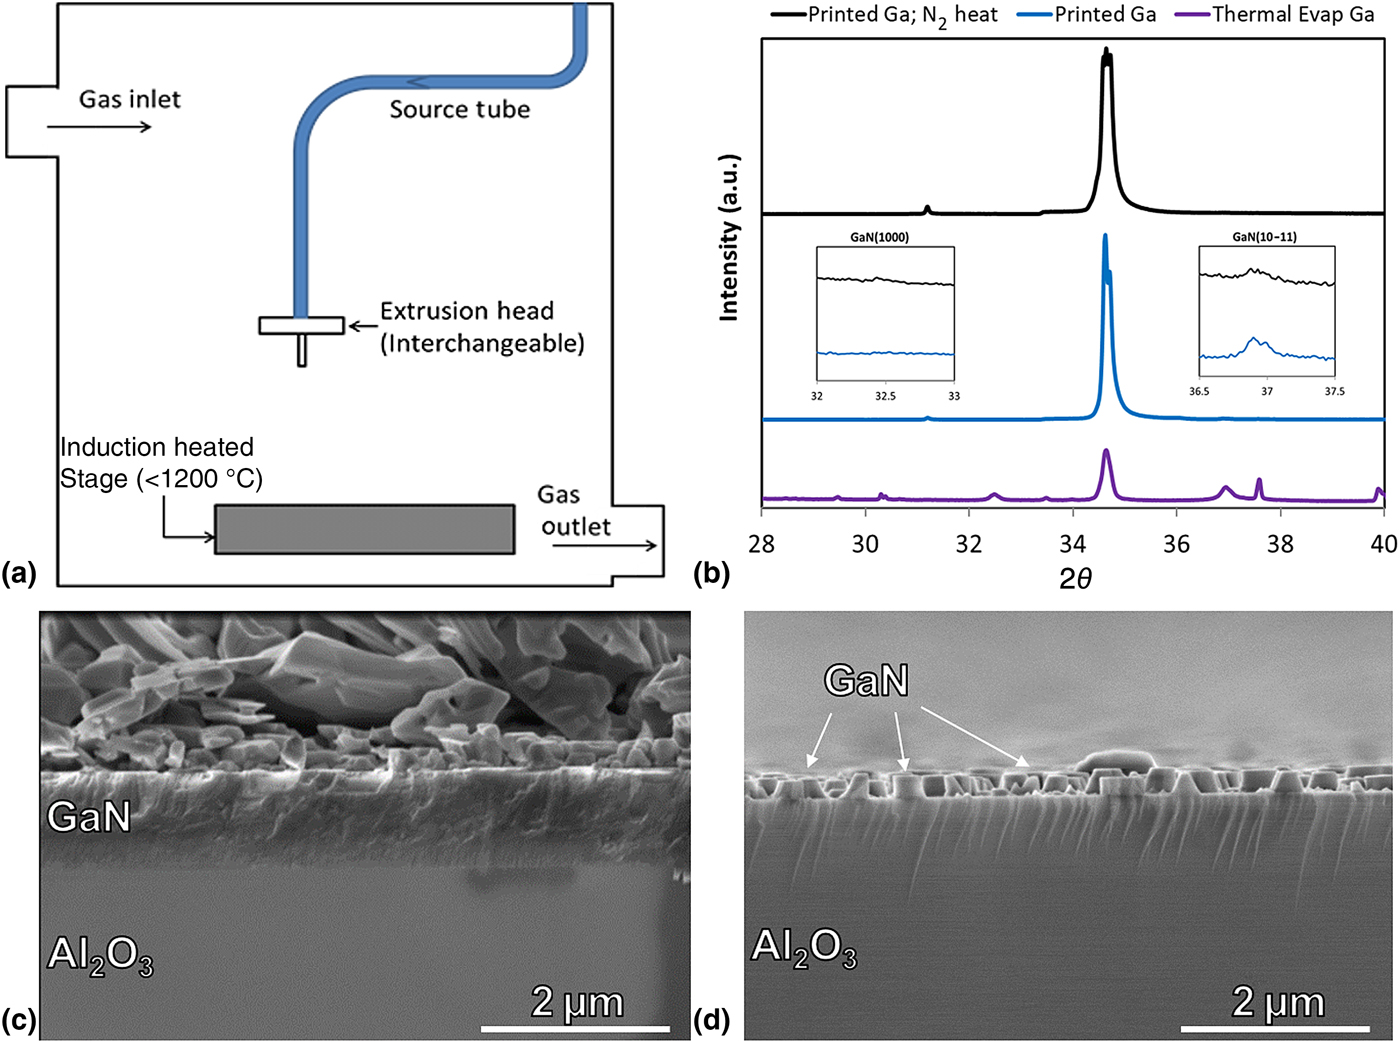
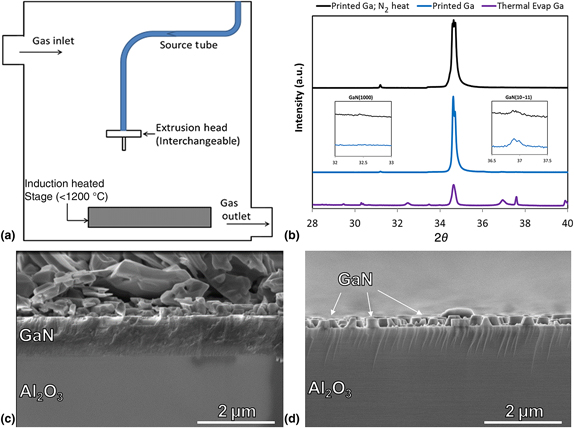
With the success of the initial tests in demonstrating a crystal growth rate in the targeted range, further studies were pursued to print and crystallize GaN in an oxygen-free environment for two major reasons. First, in order to demonstrate a viable semiconductor printing process to compete with standard methods, the Ga printing and crystallization processes must take place in the same equipment in order to reduce time between steps. The second reason is that the oxide present in the initial studies prevented crystallization below certain thicknesses—which will affect layer resolution—and likely was acting as a nucleation site for non-epitaxial crystal growth. In order to achieve an oxide-free environment, a custom vacuum chamber was built, as shown schematically in Fig. 3(a), which allowed for Ga extrusion onto a heated stage capable of reaching 1200 °C. After Ga printing, the extrusion needle was retracted and a N2/NH3 mixture was flowed into the system in order to convert Ga to GaN at elevated temperatures. Similar to the initial studies on thermally evaporated Ga, initial GaN conversions were performed while flowing NH3 and N2 during the heating process to saturate the printed Ga before conversion. The XYZ motor used to control the print head did not have Z resolution capabilities below 50 µm so the layer was suspected to be on the same order of magnitude thickness as the 65 µm sample from the previous study for comparison. It is also worth noting that the annealing systems were built to different specifications which required different optimized crystallization conditions. Therefore, for the sake of brevity, specifics of the optimization process are not reported on here and it is acknowledged that this is a best effort comparison based on relative process optimization focused on known critical parameters of growth temperature and N2:NH3 ratio. XRD spectra showing the degree of crystallinity between the ~65 µm thermally evaporated Ga and the in situ printed Ga is shown in Fig. 3(b). It is also worth noting that the Ga line printed directly into a controlled ambient was only held at crystallization temperature (1000 °C) for 5 versus 30 min for the thermally evaporated GaN despite similar projected thicknesses. Despite the shorter crystallization time, significant improvement in the crystallinity was observed in the GaN printed directly into a N2 ambient as compared with thermally evaporated Ga of similar thickness. No remaining Ga or Ga2O3 peaks were observed in the spectra, indicating that the controlled N2 ambient was preventing oxidation and resulting in faster, more complete crystal conversion. Additionally, the samples printed directly into a N2 ambient showed the best observed epitaxial nature in XRD post-conversion with a strong GaN(0002) peak and only a very slight peak observable above noise at the peak position for (10–11) GaN.
(a) Schematic showing process chamber built to print Ga in an oxide-free environment. (b) XRD comparison of samples formed with thermally evaporated Ga and printed Ga. (c) and (d) Cross-sectional SEM of (c) center of printed GaN and (d) edge of printed GaN line.

The faster crystallization of printed Ga may have been partially due to the removal of the oxide layer which acted as an NH3 diffusion barrier in initial experiments. All crystallizations reported up to this point were performed with heating occurring in a N2/NH3 ambient in order to saturate the Ga droplet and increase the crystallization rate. Based on the faster-observed crystallization rate of printed Ga, an additional test was performed with heating in a N2 ambient to try to prevent crystallization below 1000 °C and thereby improve the crystal quality of the converted GaN. No significant change in conversion rate was observed when heating in a pure N2 ambient (total time at temperature was still 5 min), but the crystal orientation was improved slightly as shown by the decrease in the GaN(10–11) XRD peak as shown the inset of Fig. 3(b).
It was also observed that printed Ga lines spread once NH3 was introduced to the system above a certain temperature (~700 °C), which lead to wide line traces on the order of >5 mm despite line traces being ~100–200 µm wide as printed. Cross-sectional images from a bisected line showing regions near the center of the print line and the edge of the print line are given in Figs. 3(c) and 3(d), respectively. The sample shown here was formed earlier in the optimization process before a single c-plane orientation was observed in XRD. These results, however, show the presence of a thick, epitaxial film in the center of the print line, with polycrystalline material on top of the film. This polycrystalline material was likely caused by homogeneous nucleation in the melt. It is worth noting that this polycrystalline layer was not observed at the edges of the printed line where the printed material had wet out and was therefore thinner. This data is provided as an indication that–aside from gas flow, pressure, and temperature—the volume of the printed Ga can also be used to control the degree of crystalline texture in the GaN printing process and help move toward a single-crystal final product. This is similar to results presented in prior LPE literature[Reference Tanaka, Funayama, Murakami and Katsuno21] but is confirmed for the process reported here as it will directly impact future studies of 3D printed semiconductors due to the importance of layer height control in AM processes.
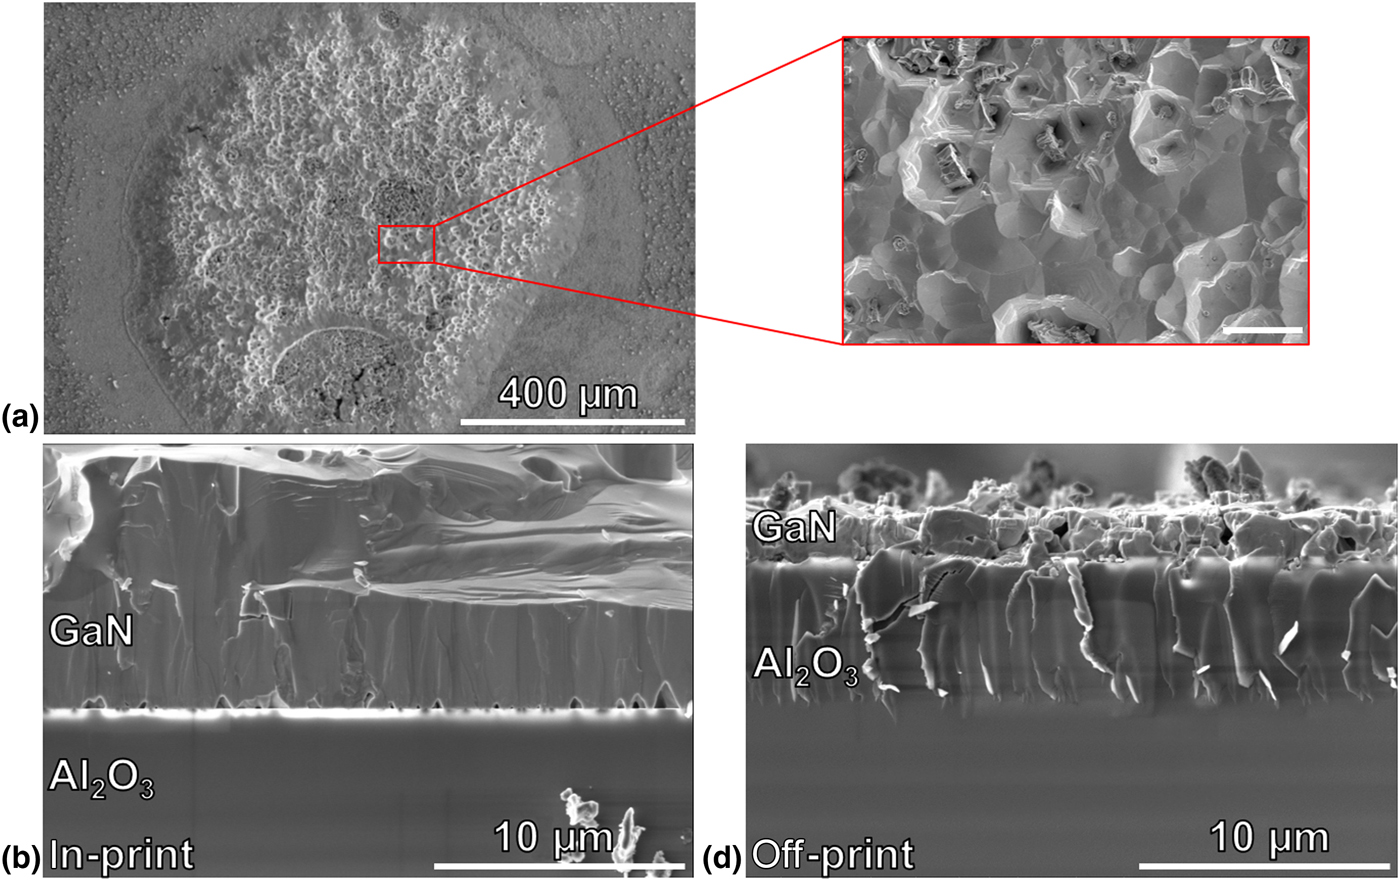
Figure 4 shows scanning electron microscopy (SEM) images from the sample that was heated in a pure N2 ambient to 1000 °C before NH3 was flowed into the chamber to induce crystallization. The top-down image shown in Fig. 4(a) shows a circular crystallized region along the original Ga print line. This region has a distinctly different morphology than the surrounding area and appears to be rough, but a mostly coalesced film. Cross-sectional SEM from inside [Fig. 4(b)] and outside [Fig. 4(c)] the printed region show the difference in film morphology more clearly. Inside the printed region is a 5–10-µm-thick, coalesced GaN film with noticeable roughness growing epitaxially from the sapphire substrate. The region outside of the print shows rough, uncoalesced, and seemingly polycrystalline GaN islands. The presence of mostly coalesced GaN along the printed Ga line demonstrates a degree of localized conversion along the printed line. Based on the presence of GaN outside the printed line, however, there is clearly some migration of Ga during the crystallization process. The spreading of the printed Ga was only observed to occur at elevated reaction temperatures when NH3 was present. Based on this it was hypothesized that the spreading occurred due to the crystallization of GaN at the substrate surface which resulted in improved wetting at the Ga/GaN interface as compared with the wetting observed at the Ga/Al2O3 interface. This may have caused the molten Ga to spread farther from the print line and continue to crystallize and spread outward until the molten Ga from the original line was fully reacted. The coalesced region within the droplet shown in Fig. 4 does indicate the potential to prevent wetting by decreasing the original print volume. Commercial AM systems with jetting solutions, instead of extrusion printing, can print lines with height resolutions in the range of 10–20 µm and width resolutions in the range of 50–100 µm which are within the volume range of the droplet observed in Fig. 4. It is worth noting, however, any commercial printing system would have to be tested and optimized with Ga metal (or a Ga-based ink depending on the process) to determine if reported resolutions are still achievable with the material system used here. Further studies must be performed to fully understand the cause of the Ga spreading and explore possible solutions. Whether the polycrystalline nature of the material outside the print line is an effect of the wetting process, contamination, or some other factor also requires further study. Finally, taking the thickness of the coalesced region and the crystallization time (5 min) into account, an estimated growth rate of 1–2 µm/min is obtained. This growth rate is comparable to that achievable by MOCVD or HVPE, indicating the viability of the GRAM process to create complex structures without sacrificing growth rate over commercially used methods. This growth rate is, however, significantly faster than the highest rate predicted by our earlier models indicating there may be other factors affecting the growth rate in printed Ga structures. A better understanding of the unique properties, phenomena, and crystal quality associated with the semiconductor 3D printing process is necessary for future use and application and further in-depth studies are currently underway. The results presented here, however, demonstrate the potential of the GRAM process for localized printing of epitaxial semiconductor GaN.
(a) Top-down SEM of GaN formed from printed Ga droplet and cross-sectional SEM showing GaN morphology (b) inside and (c) outside the circular printed region shown in (a). Scale bar in magnified region of (a) 20 µm.

Conclusions
We have demonstrated a new process for additively manufacturing epitaxial semiconductor GaN by reacting liquid Ga and gaseous ammonia at elevated temperatures. Controlling the thickness of the printed Ga allows for control over the crystallization time and the degree of epitaxial crystal growth. By controlling the print thickness and preventing oxide formation, epitaxial GaN films can be formed, which has not yet been demonstrated with standard AM processes. Several phenomena associated with the GRAM process were observed including wetting of the Ga during crystallization and Ga2O3 preventing the formation of GaN in thin samples. Further studies are required to fully understand these phenomena and demonstrate the suitability of this process for fabricating 3D semiconductor structures and novel device architectures. The results presented here, however, show the pathway to realizing 3D printed single-crystal semiconductors through the GRAM process.
Acknowledgments
We would like to acknowledge Dr. Joan Redwing for the use of her metal-organic chemical vapor deposition reactor for initial anneals of thermally evaporated Ga in a N2/NH3 ambient.