Introduction
Long-term surface air-temperature records from the Antarctic Peninsula revealed a significant warming trend of 0.02– 0.04 Ka–1 in the last five decades for both the western and eastern sides of the peninsula (e.g. Reference ComisoComiso, 2000). In addition, changes in the precipitation regime (Reference Turner, Colwell and HarangozoTurner and others, 1997) are expected to cause an alteration of the accumulation and ablation patterns of glacial systems. The retreat of glaciers and the rapid disintegration of ice shelves (summarized in Reference Scambos, Hulbe, Fahnestock and BohlanderScambos and others, 2000) dramatically indicate the changing environmental conditions in this region.
In contrast to the continental ice masses, the local glaciers on the Antarctic Peninsula react with a mass decrease to the recorded warming (Reference Weidick, Morris, Haeberli, Hoelzleand and SuterWeidick and Morris, 1998). Their location in the Southern Hemisphere frontal zone characterized by strong latitudinal and longitudinal climatic gradients results in a high sensitivity to climate changes. Reference Drewry and MorrisDrewry and Morris (1992) made predictions for the contribution of the Antarctic Peninsula’s ice masses to the global sea-level rise. Assuming a conservative melt rate of 0.25 mice a–1K–1 and a surface air-temperature increase of 2 K over 40 years, they estimated a contribution to sea-level rise of at least 1.0 mm corresponding to 0.012 mmice a–1K–1. However, results from a recent study on Alexander Island suggest that this rate needs to be corrected upwards at least by a factor of two (Reference MorrisMorris, 1999). Although the predicted contribution of the Antarctic Peninsula ice to sea-level rise is small compared to the expected positive mass balance of the continental Antarctic ice sheet due to an increase in accumulation, detailed studies need to quantify those contributions.
In Drewry’s and Morris’s study (1992), the area of the Antarctic Peninsula on which surface melt must be considered in mass-balance estimations was assessed to be approximately 20 000 km2. Snowmelt-affected areas were determined to be areas with a mean annual surface air temperature above –11°C. Areas with a mean annual temperature of <–11°C are assigned to the dry-snow zone (Reference Peel and MorrisPeel, 1992). However, as the spatial distribution of this zone cannot easily be derived from meteorological records or field data due to the scarce database, other methods must be deployed. The suitability of data from orbital synthetic aperture radar (SAR) satellites for mapping glacier snow or snow facies zones has already been demonstrated by various authors (e.g. Reference Jezek, Drinkwater, Crawford, Bindschadler and KwokJezek and others, 1993; Reference Smith, Forster, Isacks and HallSmith and others, 1997; Reference PartingtonPartington, 1998; Reference Braun, Rau, Saurer and GoβmannBraun and others, 2000; Reference RauRau and others, 2000). This technique thus permits the delineation of the dry-snowzone and consequently of areas affected by surface melting.
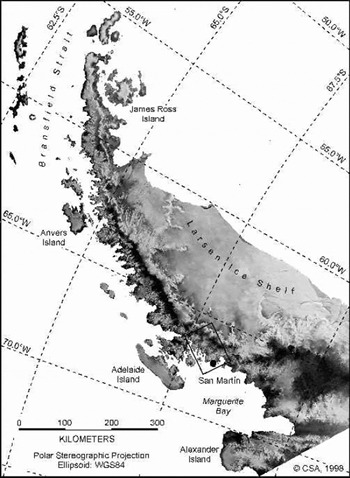
The objective of this paper is to provide an estimation of the spatial extent of areas that are at least occasionally affected by surface melt on the Antarctic Peninsula north of 70°S by means of SAR imagery. By applying a threshold approach, the dry-snowzone is identified from three RADARSAT Scan-SAR mosaics from 1998/99 (Fig.1). Furthermore, the use of the dry-snow line as an indicator of climatic changes is demonstrated in a regional case-study based on ERS-1/-2 data from the inner Marguerite Bay.
RADARSAT ScanSAR mosaic of the northern Antarctic Peninsula acquired on 12 December 1998. The location of the ERS scenes used to analyze of the temporal evolution of the dry-snowline, and of the Argentine station San Martín is indicated.

Radar Glacier Zones
The recorded backscatter signal from snow and glacier surfaces is affected by sensor parameters as well as by snow-cover parameters. SAR images of polar glaciers and ice sheets show a typical sequence of alternating dark and bright signatures. These signatures are caused by specific backscatter mechanisms which in turn are affected by the prevailing snow-cover parameters such as liquid-water content, snow density, grain-size, stratigraphy and surface roughness. Due to their sensitivity to liquid water within the snowpack, SAR data allow wet and frozen snow zones on a glacier to be discriminated.
Since SAR data also provide information from deeper layers of a dry-snow cover, a more detailed classification of snow zones on glaciers is facilitated. Depending on the actual snow properties resulting from metamorphic processes driven by the prevailing meteorological conditions, these snow zones are dynamic on a time-scale of days to weeks and show remarkable seasonal variations. Consequently, they do not necessarily coincide with the characteristics of the classical glaciological snow zones (Reference PatersonPaterson, 1994; Reference BensonBenson, 1996). As such, they should be referred to as radar glacier zones (Reference Forster, Isacks and DasForster and others, 1996; Reference Smith, Forster, Isacks and HallSmith and others, 1997; Reference Braun, Rau, Saurer and GoβmannBraun and others, 2000; Reference RauRau and others, 2000).
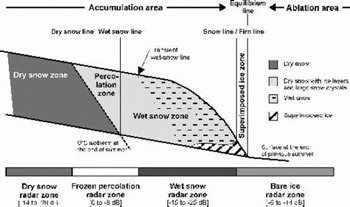
In this study, we adopt the classification scheme proposed by Reference RauRau and others (2000) which distinguishes between the dry-snow, frozen-percolation, wet-snow, and bare-ice radar glacier zones (Fig. 2). Hereby, the dry-snow radar zone is restricted to the highest areas, where the temperatures never rise above freezing point. The absence of melt events and the prevailing dry-snow metamorphism result in small grain-sizes of the snow crystals and a moderately layered snowpack without ice layers. Due to the high penetration depth and dominant volume scattering, the dry-snow radar zone is characterized by low backscatter values. In the snow-pack of the frozen-percolation radar zone, frequent or occasional melt–freeze cycles lead to the formation of numerous subsurface ice bodies and large grain-sizes. While in a dry and frozen state, both ice layers and large snow grains act as strong scatterers of the radar beam. This results in high backscatter values from the frozen-percolation radar zone.
Glacier snow zones and the corresponding radar glacier zones with typical backscatter values (situation during ablation season; after PReference Patersonaterson, 1994; Reference BensonBenson, 1996).

During melt events, the liquid-water content in the snow-pack increases. As liquid water absorbs much of the incoming microwave, the penetration depth is reduced to the uppermost centimetres. If the snow surface is smooth, specular reflection causes the dark appearance of a melting snow cover in a SAR image. In the bare-ice radar zone, surface scattering causes a relatively strong backscatter signal in comparison to the wet-snow radar zone.
The Dry-Snow Radar Zone
A dry-snow zone can only be found on the highest parts of polar glaciers and ice sheets. On the northern Antarctic Peninsula, it is limited to the central plateau of the mountain chain. Dry-snow metamorphism caused by compaction due to gravity and wind action, and recrystallization due to internal temperature and moisture gradients determine snow-cover properties. Under these conditions, the dominant factors affecting the backscatter coefficient are snow density, crystal size and crystal form. The low radar returns that can be observed consistently throughout all seasons are caused by predominant volume scattering and a high penetration depth of the radar signal. Surface scattering is negligible. The dry-snow radar zone is characterized by an extraordinary spatial and temporal radiometric stability of the backscatter values and is not affected by seasonal variations (Reference PartingtonPartington, 1998). As a consequence, the dry-snow line can be identified as a temporally and spatially persistent feature in SAR imagery. In addition, it should be noted that the dry-snow radar zone coincides with the classical glaciological dry-snow zone.
Typical backscatter values range from –14 to –20 dB (Reference RauRau and others, 2000). A transition zone with backscatter values ranging from –14 to –8 dB connects the dry-snow zone with the frozen-percolation radar zone, which is characterized by values above –8 dB (Reference PartingtonPartington, 1998; Reference Rau, Braun, Friedrich, Weber, Goβmann, Wunderle and NaglerRau and others, 2001).
The only mechanism believed to be able to cause a significant upward shift of the dry-snow line is a change from dry-to wet-snow metamorphism. This implies at least a short-term impact of high temperatures leading to enhanced grain growth and therefore higher backscatter values. Conversely, a downward shift of this boundary line is an indicator of continuous accumulation of dry and fine-grained snow and the absence of any melt event at the corresponding altitude range during several years. Hence, analyzing the dry-snow line by
means of multi-temporal SAR imagery facilitates the posterior detection of singular extreme high-temperature events impacting even the highest areas. It also enables the monitoring of periods with minor variations of the meteorological conditions and therefore constant snow-cover properties (Reference Rau, Braun, Friedrich, Weber, Goβmann, Wunderle and NaglerRau and others, 2001).
Satellite Data And Processing
Eight RADARSAT ScanSAR images (SWB mode, pixel size 50 650 m2) acquired at the Alaska SAR Facility (ASF) on 18 November 1998 (orbit 15860, frames 613, 621, 628), 12 December 1998 (orbit 16203, frames 613, 621, 628) and 5 January 1999 (orbit 16546, frames 614, 626) were used to generate three SAR mosaics. Each set covers the entire northern Antarctic Peninsula. Image processing included calibration, map-projecting and mosaicking utilizing the ASF/Science Technology and Education Program (STEP) software. Additionally, three European Remote-sensing Satellite-1/-2 (ERS-1/-2) scenes from the inner Marguerite Bay (frame 5013, descending orbit) acquired on 8 July 1992, 22 March1996 and17 January 1998 at the German Antarctic Receiving Station (GARS, Antarctic Peninsula) served for a regional case-study. For all ERS images, calculation of normalized backscatter coefficients (after Reference LaurLaur and others, 1998) and co-registration were performed using the European Space Agency (ESA) SAR Toolbox. In both datasets, image speckle was reduced applying a 565 median filter.
The spatial extent of the dry-snow radar zone was computed by extracting all areas with backscatter coefficients less than –14 dB. This threshold was derived from backscatter modelling based on snow-pit and ice-core data (Reference Rau, Braun, Friedrich, Weber, Goβmann, Wunderle and NaglerRau and others, 2001). Additionally, analysis of SAR imagery from ERS-1/-2 and RADARSAT indicates that this threshold is appropriate to identify the dry-snow radar zone, as it delimits consistently the uppermost areas which are characterized by low backscatter values and the absence of any multi-temporal signatures (Reference PartingtonPartington, 1998). A sensitivity study using imagery of both sensors was performed in order to check the integrity of this approach. It indicated that classification results vary only slightly with stepwise decreasing threshold values with increments of 0.5 dB, while a similar increase led to significant changes in both the spatial distributions and the absolute dimensions of the classified areas. The accuracy of the approach is estimated to approximately ±1.0 dB, which is of the same magnitude as the calibration accuracies of ERS-1/-2 (absolute: ±0.5 dB; Reference LaurLaur and others, 1998) and RADARSAT ScanSAR SWB data (absolute: ±2.0 dB, relative: ±0.5 dB; Reference Martyn, Williams, Nicoll, Guritz, Bicknell and SteinMartyn and others, 1999). Furthermore, the influence of variable incidence angles and different sensor polarization can be neglected, as the SAR backscatter returns from such a snowpack result predominantly from volume scattering.
To avoid misclassifications, a minimum elevation of the dry-snow zone was used to mask out the lower parts. Hereby, misclassifications might be caused by SAR-inherent ambiguities, such as wet snow located in the lower parts of the glaciers or relief-induced shadows. Based on mean annual temperatures of stations surrounding the Antarctic Peninsula and by assuming a standard temperature lapse rate of 0.65 K (100 m)–1, the altitude of the –11°C isotherm was estimated. As a consequence, a constraining lower limit was determined to 800 ma.s.l. for areas north of 67.5˚ S and 600 ma.s.l. for the southern parts. Elevation data were provided by the RADARSAT Antarctic Mapping Project digital elevation model (RAMP DEM; Reference Liu, Jezek and LiLiu and others, 2000). Further enhancement of the derived dry-snow coverages included median filtering and removal of classified areas smaller than 1km2. Supporting meteorological data from the Argentine base San Martín (Marguerite Bay, 68˚ S, 67° W) were used to aid image interpretation.
Results And Discussion
Spatial extent of the dry zone on the northern Antarctic Peninsula
When the dry-snow radar zones as derived from the RADARSAT mosaics are compared, the spatial distributions and the absolute dimensions agree well. Particularly in the upper plateau region of the Antarctic Peninsula, the boundary lines are consistent in all three datasets. The best match (in the order of ±2 pixels corresponding to approximately ±100 m) was achieved on the eastern side of the peninsula. On the precipitous west side, results showed slightly more variance. Misclassified pixels in the marginal areas are attributed to low backscatter values due to snowmelt, relief and snow-free areas. On the higher areas of the ice sheet, discrepancies between the classification results are caused by relief-induced backscatter variations between the original SAR datasets. For these areas, the backscatter differences could be quantified to be in the magnitude of ±0.5 dB.
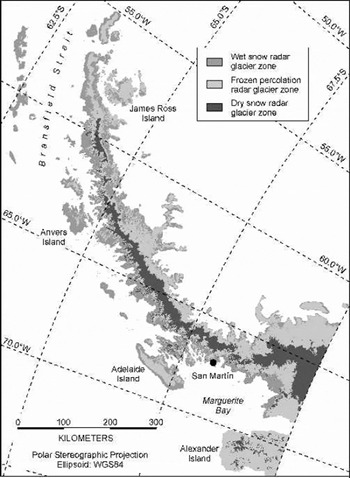
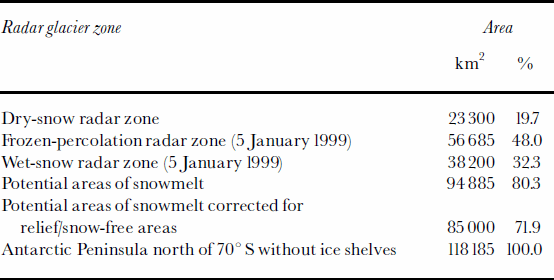
The good agreement of the dry-snow zones as derived from the mosaics shows that the threshold approach applied is robust in determining the dry-snow radar zone. These findings furthermore indicate that the relative calibration accuracy of ±0.5 dB of RADARSAT ScanSAR SWB products is sufficient for this monitoring purpose. Evident classification errors in the mosaic from January 1999 originate predominantly from wet snow surfaces covering the higher parts of the glaciers during image acquisition. This indicates that the constraining elevation limit was set too low for SAR data recorded during the melt period. Since the coverages derived from the November and December data match very well, further analysis of the dry-snow radar zone was based on these two mosaics. This resulted in a total size of the dry-snow radar zone of 23300±2000 km2 which corresponds to 19.7 ±1.7% of the Antarctic Peninsula north of 70˚ S (Table 1; Fig. 3).
Actual distribution of radar glacier zones on the northern Antarctic Peninsula during 5 January 1999.

Spatial distribution of radar glacier zones and areas potentially affected by snowmelt on the Antarctic Peninsula north of 70˚ S
Areas affected by snowmelt
During winter conditions, the parts of the glacier surface located below the dry-snow line can be classified as frozen-percolation radar zone. It is characterized by an entirely frozen snowpack. These areas are at least occasionally affected by melt events and cover approximately 95000 km2. This corresponds to roughly 80% of the investigated area (disregarding the area covered by ice shelves). However, particularly in the western coastal parts of the Antarctic Peninsula, widespread unglacierized and snow-free areas occur. Based on the available ScanSAR mosaics, their extent was estimated to be roughly 5–10% of the land surface. This reduces the total glacier surface by 9000±3000km2. Therefore, it seems appropriate to give a conservative estimation of the maximum extent of the melt area on glaciers on the northern Antarctic Peninsula of approximately 85000 km2.
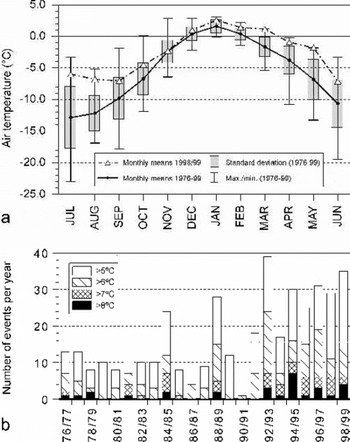
When the area that contributes with snowmelt runoff to sea-level rise is computed, glacier surfaces affected only occasionallyby surficial snowmelt must be neglected. As the latter cannot easily be differentiated in SAR imagery, the spatial distribution of the wet-snow radar zone on 5 January 1999 facilitates a first assessment of glacier surfaces influenced regularly by snowmelt (Fig. 3). The meteorological records from San Martín indicate that the air temperatures during spring and early summer 1998/99 were well within the longterm range of mean monthly values (Fig. 4a). It is therefore assumed that 5 January 1999 represents a typical situation for the ablation season on the Antarctic Peninsula. The wet-snow radar zone covers 38200 km2, i.e. 32% of the land surface.
(a) Long-term monthly mean surface air temperatures at San Martín station (period 1976–99) and additional monthly means for the investigated time period of available ScanSAR data (1998/99). (b) Frequency ofdiurnal air-temperature maximums derived from the San Martín record (1976–99).

Disregarding snow- and ice-free areas, the effective surface of this zone is estimated to be approximately 30 000 km2.
The dry-snow line as indicator of climate change
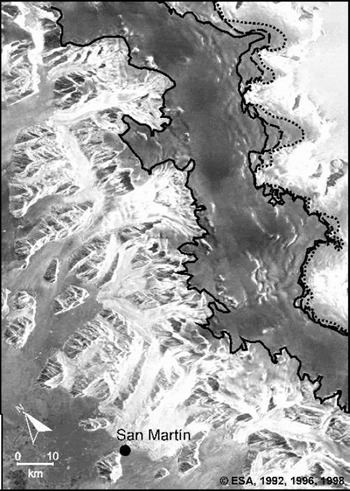
The temporal variation of the dry-snow line was investigated in a regional case-study from inner Marguerite Bay (Fig.1) by means of ERS-1/-2 imagery acquired between 1992 and 1998. Applying the same threshold approach as described above, the position of the dry-snowline was identified (Fig. 5). While on the precipitous west-facing slopes a probable position change might be obscured by the relief and the look direction of the sensor, a significant upward shift of this boundary line was identified on the gently inclined eastern slopes of the central mountain chain. Hereby, an increase of the altitudinal position of the dry-snow line of up to 170m was detected between 1992 and 1998.
Upward shift of the dry-snow line on the eastern side of the central plateau of the Antarctic Peninsula (68˚ S) during the 1990s. The position in 1992 is denoted by the dotted line, in 1996 by the dashed line and in 1998 by the solid line.

This shift is interpreted as a direct response to high-temperature events which led to enhanced wet-snow metamorphism at these altitudes. The measured rise in elevation indicates an increase of maximum temperatures of >2K during the investigated period. An analysis of the frequency of daily maximum air temperatures from the San Martín record (Fig.4b) clearly shows the increase of events exceeding 5°C during the decade 1990–99. These results are supported by the findings of Reference Fox and CooperFox and Cooper (1998) and Reference Scambos, Hulbe, Fahnestock and BohlanderScambos and others (2000), who observed an increase in the number of days with snowmelt for the 1991–2000 decade in northern Marguerite Bay and the Larsen Ice Shelf, respectively.
Conclusions
The large-scale distribution of the dry-snow zone of the northern Antarctic Peninsula was derived from three RADARSAT ScanSAR mosaics. The good agreement of the dry-snow coverages on the high plateau areas shows that the approach used is very robust in determining the dry-snow radar zone. Hereby, a threshold of –14 dB was used to separate the dry-snow zone from other snow zones in the high areas, whereas a constraining minimum altitude aims to avoid misclassifications in the lower areas. The practicability of this approach was confirmed by identifying the dry-snow line in multi-temporal ERS-1/-2 imagery.
The observed upward shift of the dry-snow line on the eastern side of the Antarctic Peninsula is interpreted as a direct result of the increasing number of high-temperature events affecting the snow cover even in the uppermost regions. The increase of maximum temperatures at these altitudes of the northern Antarctic Peninsula is estimated to be >2K in the period 1992–98. This observation adds another aspect to the already reported effects of the warming trend in this region. Furthermore, these findings confirm the ability of SAR derived dry-snow lines to serve as indicators of climate variability in remote high-altitude areas of the polar regions.
The spatial extent of radar glacier zones was derived from the mosaics in order to provide estimates of areas potentially contributing to sea-level rise. Hereby, areas occasionally or frequently affected by snowmelt cover approximately 85 000 km2 of the entire land surface. The distribution of wet snow in the summer season 1998/99 was regarded as an approximation for areas with regularly melting snow cover. The results indicate that only in the investigated region north of 70˚ S do these areas exceed 30 000 km2. Remaining uncertainties are caused by the distribution of snow- and ice-free surfaces in the coastal zones. These findings suggest that for the Antarctic Peninsula, in addition to the needs of refined ablation rates (Reference MorrisMorris, 1999), the spatial extent of areas regularlyaffected by snowmelt must be revised. Future assessments of the contribution of the Antarctic Peninsula’s ice masses to sea-level rise will require more detailed studies of the ablation sensitivity of the corresponding areas (e.g. by means of energy-balancemodelling) (Reference Braun, Saurer, Vogt, Simões and GoβmannBraun and others, 2001).
Acknowledgements
This research was supported by the Deutsche Forschungsgemeinschaft (SA 694/2-1), by ESA projects Monitoring of dynamic processes in Antarctic geosystems (AO2.D149) and Midterm monitoring of snow cover characteristics by ERS-SAR-imagery on the Antarctic Peninsula (AO3.D196) as well as by CSA/NASA (ADRO.540). Meteorological data were provided by Servicio Meteorológico Nacional (Buenos Aires). The authors would like to thank the Instituto Antártico Argentino (Buenos Aires) and the crew from San Martín. Special thanks to F. Weber (Vancouver) for proofreading.