Implications
It is difficult and expensive to estimate the nutritional value of amino acids (AAs) of the ingredients used in swine nutrition. The results of this study demonstrate that the chemical analysis such as total AA and NDF, may be used to estimate the standardized ileal digestibility (SID) of AAs and digestible AA contents in oilseed meals in order to help hog producers maximize nitrogen utilization.
Introduction
A major goal of pig feed formulation is to provide the essential amino acids (EAA) required to support maximum growth while minimizing nitrogen excretion. This is challenging because EAA in common feedstuffs are not totally digestible to pigs, and diets are formulated using digestible EAA contents, rather than the total of EAA values, making it more difficult to balance the digestible EAA contents with the nutritional requirements. In vivo determinations of the EAA ileal digestibility of ingredients and diets are time-consuming and expensive. SID values of EAA for pig feeds are fixed average values and therefore do not take into account the large of variation observed for different feed ingredients (e.g. Sauvant et al., Reference Sauvant, Perez and Tran2004; National Research Council (NRC), Reference Neutra and Forstner2012). More precise methods of predicting dietary SID EAA are needed. The chemical composition of ingredients could be used for this purpose. The concentration of components such as CP, fibre and fat is known to affect SID EAA and endogenous losses of EAA (Urbaityte et al., Reference Urbaityte, Mosenthin and Eklund2009). The establishment of simple regressions between chemical composition and SID EAA is possible but does not take into account other factors affecting digestibility, including animal age and experimental conditions. By including a large range of factors that affect digestibility, meta-analysis can be used to summarize knowledge acquired through previously published research and express EAA SID in quantitative terms (Sauvant et al., Reference Sauvant, Schmidely, Daudin and Saint-Pierre2008). In recent study, Messad et al. (Reference Messad, Létourneau-Montminy, Charbonneau, Sauvant and Guay2015) showed that meta-analysis approach can be used to predict total EAA from CP content and SID EAA from apparent ileal digestibility (AID) of EAA.
Oilseed meal is an important source of EAA and is the second most important pig diet ingredient after cereals. In many countries, soybean meal (SBM) is the main protein-based ingredient used in pig diets, because of its high protein content (44% to 49%), suitable EAA profile (Bruce et al., Reference Bruce, Karr-Lilienthal, Zinn, Pope, Mahan, Fastinger, Watts, Utterback, Parsons, Castaneda, Ellis and Fahey2006) and high SID EAA (NRC, Reference Neutra and Forstner2012). For example, the Lys SID is higher for SBM (89% to90%) than for rapeseed meal (RSM) (78%) and cottonseed meal (CSM) (64%). However, considerable variations in EAA content and SID values have been observed as a function of seed origin and technological treatment (Karr-Lilienthal et al., Reference Karr-Lilienthal, Merchen, Grieshop, Flahaven, Mahan, Fastinger, Watts and Fahey2004). Excessive heat treatment may result in the destruction of EAA and the formation of Maillard reaction products having no biological value (Van Barneveld et al.,Reference Van Barneveld, Batterham and Norton1994; Rérat et al., Reference Rérat, Régine, Vaissade and Finot2002). RSM has a CP content of about 40% (Roth-Maier et al., Reference Roth-Maier, Bohmer and Roth2004; NRC, Reference Neutra and Forstner2012) and its EAA profile is quite similar to SBM, although it is lower in Lys and higher in Met (Cullison and Lowrey, Reference Cullison and Lowrey1987; NRC, Reference Neutra and Forstner2012). CSM is used sparingly as a protein source for growing-finishing pigs, as its use as the sole source of protein is known to reduce EAA SID and pig performance significantly (Li et al., Reference Li, Xu, Qiao, Zheng, Chen, Piao, Han and Thacker2000). The objective of the present study was to determine, through meta-analysis of published chemical data, the EAA SID and the digestible ileal standardized EAA contents (dEAA) of three types of oilseed meal.
Material and methods
Data collection and coding
This study is based on an exhaustive compilation of published EAA SID and dEAA in pigs and analyses of CP, crude fibre (CF), ADF, NDF, ADL, hemicellulose, total EAA and anti-nutritional factors in oilseed meals. The literature search was conducted between October 2011 and December 2012, and the selection of publications began with research using currently available databases (Web of Science, CAB abstracts, Prod INRA and Science Direct) and keywords such as amino acid, apparent ileal digestibility, standardized ileal digestibility, oilseed meal, pigs and swine. The references cited in the papers selected were also consulted. The final data set included 224 treatments reported in 47 peer-reviewed articles published between 1981 and 2012. Data involving treatments with exogenous enzymes (i.e. phytase, carbohydrases, proteases, amylases and lipases) and treatments with several protein sources in the same experimental diet were not included. However, the addition of free synthetic AAs such as dl-methionine, l-lysine, l-threonine and l-tryptophan was accepted according to the completed (100%) ileal digestibility of these AA supplements. To select relevant observations, codes were used to identify each article and the experiments described (Sauvant et al., Reference Sauvant, Schmidely, Daudin and Saint-Pierre2008). Each observation corresponded to the mean obtained for one treatment group. Other codes were generated to distinguish the types of oilseed meal (SBM, (61%) RSM (29%) and CSM (10%)), surgical procedures (e.g. T-cannula (82%), re-entrant cannulas (2.5%), post valve T-cannula (4.5%) and ileo-rectal anastomy (11%)) and BW⩽ or ⩾25 kg.
When possible, missing data were estimated from other parameters found in the publication using prediction models. These models were developed to predict the EAA profile from CP and SID of EAA from AID and fibre content (Messad et al., Reference Messad, Létourneau-Montminy, Charbonneau, Sauvant and Guay2015; unpublished data). For missing NDF values, a data set comprising 173 treatments reported in 36 peer-reviewed articles published between 1977 and 2012 was used. The best predictor of NDF in SBM, CSM and RSM was ADF (R 2=0.96). These equations (data not shown) of NDF prediction were used to obtain six of the 156 NDF values including in the database.
Data and statistical analysis
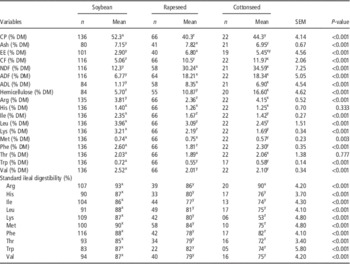
Descriptive statistics (number of observations, mean and standard deviation) were generated for each variable in the selected subgroups (Table 1). A correlation matrix was also performed between all nutritional parameters (data not shown). Particular attention was given to the meta-design, whereas the relationship between the independent variables taken 2×2 was examined graphically to assess the extent of variation in each experiment, to identify outliers, and to detect any co-linearity. Statistical analyses were carried out using the GLM (Minitab, Version 16; Minitab Inc., State College, PA, USA). As suggested by Sauvant et al. (Reference Sauvant, Schmidely, Daudin and Saint-Pierre2008), the study effect was introduced into the model as a fixed effect because the data sets used for the analysis included a small number of studies and specific experimental conditions. It also allows proper prediction of the coefficients of the model and accurate description of the error of prediction (Sauvant et al., Reference Sauvant, Schmidely, Daudin and Saint-Pierre2008). These authors also mention that the statistical effect of the covariate is not dependent on whether the study is considered as a fixed or a random effect. Relationships between EAA SID or dEAA content and chemical composition (CP, CF, ADF, NDF, ADL, hemicellulose and total EAA contents), oilseed meal type and surgical procedure were studied using a variance–covariance model as follows:
 $$Y_{{ij}} \,{\equals}\,\mu {\plus}\mu _{i} {\plus}\beta X_{{ij}} {\plus}Z_{i} {\plus}\beta _{i} X_{{ij}} {\plus}e_{{ij}} $$
In which Y ij is the value of dependent variable Y (SID or dEAA) in study i with j treatments, X ij the independent variable, μ the overall intercept across all studies (fixed effect), β the linear coefficient of the relationship, β i the fixed effect of study i on the regression coefficient of Y on X, Z i the correction factor for oilseed meal category and e ij the unexplained residual error.
Composition of the oilseed meals examined in the meta-analysisFootnote 1

DM=dry matter; EE=ether extract; CF=crude fibre; Arg=arginine; His=histidine; Ile=isoleucine; Leu=leucine; Lys=lysine; Met=methionine; Phe=phenylalanine; Thr=threonine; Trp=tryptophan; Val=valine.
x,y,zWithin a row, means without a common superscript letter differ significantly (P<0.05).
1 Studies: the list of references used for the meta-analysis is given in Supplementary Material S3.
SID and dEAA were measured using mono-ingredient semi-purified diets, which sometimes included the free synthetic AA and sources of fibre (5% of experiments). When ingredient composition or dietary content was not indicated in the publication, we used the ingredient composition from tables (Sauvant et al., Reference Sauvant, Perez and Tran2004; NRC, Reference Neutra and Forstner2012); only 1.5% of the data were estimated using this method. All independent nutrient compositions of ingredients were therefore available for each experiment in the database. Normal distribution of the data and homogeneity of variances were tested using the Shapiro–Wilk and Levene tests, respectively. To verify the model stability, the influence of secondary variation factors on each parameter was tested. Individual within-experiment slopes were regressed on interfering factors to check that the model did not need an additional dependant (X) variable. The residuals (inter and intra) and the least squares means of the model, representing for each experimental group i the predicted Y i for the co-variable X averaged across all experimental groups (X ij ), were also regressed on the major potentially quantitative interfering factors to ensure that there were no residual effects (Loncke et al., Reference Loncke, Ortigues-Marty, Vernet, Lapierre, Sauvant and Noziere2009). The fit of each relationship was then examined using the ‘studentized’ residuals of the model and normality of the residuals. Outliers were identified first on the basis of residuals. Data with a residual outside the normal interval [−3; 3] were identified as influential. Their influence on the model was then verified by h i leverage [h i =1/n+(X i −X mean)2/Σ(X i −X mean)2], Cook’s DFITS (the difference between the predicted values calculated with and without the ith observation, Sauvant et al., Reference Sauvant, Schmidely and Daudin2005). Influential data can thus be highlighted, and eventually removed from the model. We thus discarded 2.5% of the data.
Model evaluation
As all data were fitted to the models, predicted (X) and observed (Y) values were compared (X−Y) using GLM to provide internal validation. The model was considered unbiased when the intercept was not different from 0 and the slope was not significantly different from 1. The ability of the proposed model to reproduce the experimental conditions was evaluated based on the statistical properties of the intercept, the slope, the root mean square error (RMSE) and the coefficient of determination (R 2). The partial least squares (PLS) method was used to evaluate the quality of the relationships on the basis of their adjusted R 2, RMSE and RMSE of prediction (RMSEP). The RMSEP was obtained by leave-one-out cross-validation from the value of the predicted residual sum of squares statistic (Causeur et al., Reference Causeur, Daumas, Dhorne, Engel, Fonti furnols and Højsgaard2003).
Results
Description of the selected data
The comparison of the oilseed meals shows that the CP content was higher in SBM compared with CSM and RSM (Table 1). In fact, SBM contained 12% and 8% more CP than RSM and CSM, respectively. RSM and CSM were similar in ADF, ADL and NDF contents, both richer than SBM. The hemicellulose content was also lower in SBM than RSM or CSM. The Arg, Ile, Lys and Phe contents of CSM were in between those of RSM and SBM. Statistically significant differences between the oilseed meals were noted for all EAA except His and Thr. The ash contents of CSM and SBM were similar, both lower than that of RSM. The ether extract content of RSM was greater than that of SBM. The EAA SID was highest in SBM except for Arg, which was similar in SBM and CSM but higher than in RSM. The SID of His, Ile, Leu and Val were similar for CSM and RSM. For the other EAA, SID values of RSM were generally in between those of SBM and CSM. (All differences are significant at P<0.001 unless otherwise stated).
Prediction of the standardized ileal digestibility of essential amino acid in oilseed meals
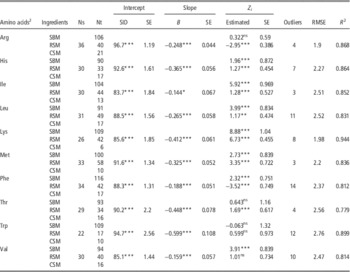
In the initial approach, SBM, RSM and CSM were merged to test a general empirical prediction of EAA SID from chemical components. This showed that EAA SID and NDF were negatively associated, with slopes varying from −0.144 to −0.599 (Table 2) and gave the best relation among the chemical components. Neither meal processing method, surgical procedure nor BW appeared to affect EAA SID (data not shown). However, type of oilseed meal did influence EAA SID estimation significantly (Table 2, Z i value). The models presented low RMSE (1.90% to 2.76%) and high R 2 explaining 77.9% to 94.4% of the variance. The prediction of EAA SID within each oilseed meal was then tested. A similar effect of NDF was found in the case of RSM, for which the graphical and statistical analysis showed a linear relationship, except for His, Leu, Phe and Trp (Supplementary Table S1). The graphical analysis revealed two groups of RSM, one with NDF <28% and the second with NDF >28% (Supplementary Table S1, Z i value).
Prediction of oilseed meal essential amino acid standardized ileal digestibility (SID) of growing pig based on NDF content of ingredients (soybean meal (SBM), rapeseed meal (RSM) and cottonseed meal (CSM))Footnote 1

Z i =correction factor used for types of oilseed meal; Ns=number of studies; Nt=total number of treatments in the model; RMSE=root mean square error; Arg=arginine; His=histidine; Ile=isoleucine; Leu=leucine; Lys=lysine; Met=methionine; Phe=phenylalanine; Thr=threonine; Trp=tryptophan; Val=valine.
1 In swine. Studies: the list of references used for the meta-analysis is given in Supplementary Material S3.
2 Variable Y; NDF is variable X.
*P<0.05, **P<0.01, ***P<0.001, ns=not significant (P>0.10).
Prediction of digestible ileal essential amino contents in oilseed meals
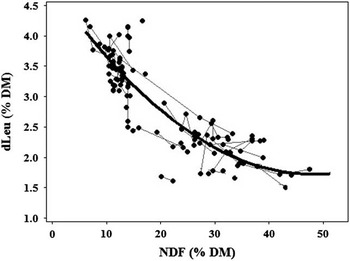
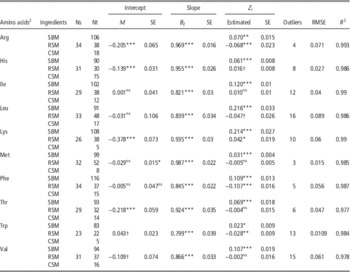
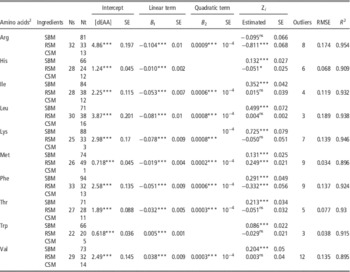
The best predictor of the dEAA content of each EAA was the total concentration of each EAA in the feed. In fact, dEAA and total EAA contents were both linearly and positively associated, with slopes varying from 0.80 to 0.97 (Table 3). The intercept was different from 0 (P<0.05) for EAA other than Ile, Leu, Phe, Trp and Val. The correction factor for the intercept was positive for all EAA in SBM, and negative for Arg, Leu, Phe and Trp in RSM (P<0.05). No interaction was found between slope and oilseed meal type for any EAA. The slopes between total EAA and dEAA contents were similar for all EAA in all oilseed meals. Among the other chemical characteristics of oilseed meal, NDF appeared to be the best predictor of dEAA contents. Linear relationships were established for His and Trp (Table 4). A quadratic response was obtained for the other EAA (Table 5 and Leu in Figure 1). The linear coefficients varied from −0.08 to −0.01 and the quadratic coefficients from 0.0002 to 0.003. The intercept varied from 0.62% to 4.86% and was adjusted with a specific correcting factor for each oilseed meal. The quadratic relationship between NDF and dEAA content suggested the existence of a threshold NDF (NDF=X max=B1/2×B2), above which dEAA content become almost independent of the NDF content. In fact, the models remained valid up to NDF⩽X max. Finally, comparison of models predicting dEAA content from total EAA or NDF led to the conclusion that either model would predict dEAA content, but total EAA provides a more accurate model (RMSE=0.01 to 0.09) than does NDF (RMSE=0.03 to 0.189). Unlike the analysis of the SID, the graphical analysis (principal component analysis) of the relationship between total EAA, NDF and dEAA content failed to distinguish between the types of oilseed meal. In view of the results of this analysis, only the results of the general models combining the three types will be presented and discussed. The details of models evaluation are presented in the Supplementary Material S1.
Within-experiment (thin line) and inter-experiment (thick line) relationships between digestible standardized ileal leucine (dLeu) and NDF contents of oilseed meals in pig feed. DM=dry matter.

Predicted digestible ileal amino acid (%) content based on total amino acid content of ingredients (soybean meal (SBM), rapeseed meal (RSM) and cottonseed meal (CSM))Footnote 1

Z i =correction factor used for types of oilseed meal; Ns=number of studies, Nt=total number of treatments in the model; B 2=quadratic parameter; RMSE=root mean square error; Arg=arginine; His=histidine; Ile=isoleucine; Leu=leucine; Lys=lysine; Met=methionine; Phe=phenylalanine; Thr=threonine; Trp=tryptophan; Val=valine.
1 In swine. Studies: the list of references used for the meta-analysis is given in Supplementary Material S3.
2 Digestible ileal amino acid content is variable Y; total amino acid content is variable X.
*P<0.05, **P<0.01, ***P<0.001, † P<0.10, ns=not significant (P>0.10).
Predicted digestible essential amino acid (dEAA) content based on NDF content of ingredients (soybean meal (SBM), rapeseed meal (RSM) and cottonseed meal (CSM))Footnote 1

Z i =correction factor used for type of oilseed meal; Ns=number of studies, Nt=total number of treatments in the model; B 1=linear parameter; B 2=quadratic parameter; RMSE=root mean square error; Arg=arginine; His=histidine; Ile=isoleucine; Leu=leucine; Lys=lysine; Met=methionine; Phe=phenylalanine; Thr=threonine; Trp=tryptophan; Val=valine; AA=amino acids in % dry matter.
1 In swine. Studies: the list of references used for the meta-analysis is given in Supplementary Material S3.
2 Digestible amino acid content is variable Y; NDF content is variable X.
*P<0.05, **P<0.01, ***P<0.001, ns=not significant (P>0.10).
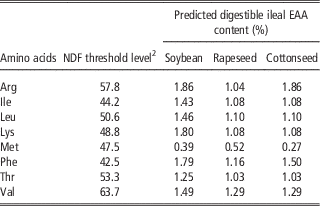
NDF threshold levelsFootnote 1 in oilseed meals used in pig feed, and digestible essential amino acid (dEAA) content predicted therefrom using the studied model

Arg=arginine; His=histidine; Ile=isoleucine; Leu=leucine; Lys=lysine; Met=methionine; Phe=phenylalanine; Thr=threonine; Trp=tryptophan; Val=valine; B 1=linear parameter; B 2=quadratic parameter.
All values are in % dry matter.
1 Level above which digestible ileal amino acid content is independent of NDF content.
2 B 1/2×B 2.
Discussion
The purpose of this study was to predict the EAA SID and dEAA contents in SBM, RSM and CSM for growing pigs, based on published chemical analysis data and on nutritional and physiological studies. In this study, we privileged the use of the variance–covariance analysis method in studying the interfering factors. This approach is similar to the multivariate analysis because it allows to analyze the effect of different independent variables on the variable to predict. Moreover, this method allows to assess whether these interfering factors affect the intercept or the slope of the relationship (Loncke et al., Reference Loncke, Ortigues-Marty, Vernet, Lapierre, Sauvant and Noziere2009).
The mean concentrations that we determined for CP, fibre and EAA contents in SBM were higher than the averages published by Goerke et al. (Reference Goerke, Eklund, Sauer, Rademacher, Piepho and Mosenthin2012), but were within the ranges previously reported by Frikha et al. (Reference Frikha, Serrano, Valencia, Rebollar, Fickler and Mateos2012) and NRC (Reference Neutra and Forstner2012). In the case of RSM, the values were close to those published by Messerschmidt et al. (Reference Messerschmidt, Eklund, Sauer, Rist, Rosenfelder, Spindler, Htoo, Schöne and Mosenthin2014) but higher than those published by Sauvant et al. (Reference Sauvant, Perez and Tran2004). The corresponding values for CSM were also close to some published values (Prawirodigdo et al., Reference Prawirodigdo, Gannon, van Barneveld, Kerton, Leury and Dunshea1998; NRC, Reference Neutra and Forstner2012), but lower than others (Almeida et al., Reference Almeida, Htoo, Thomson and Stein2014). The EAA SID values obtained in the present study were close to those reported in the NRC (Reference Neutra and Forstner2012), but lower than those reported by Sauvant et al. (Reference Sauvant, Perez and Tran2004). The EAA SID was higher for SBM than RSM and CSM, which is in agreement with results published by Eklund et al. (Reference Eklund, Caine, Sauer, Huang, Diebold, Schollenberger and Mosenthin2012) and reported in the NRC (Reference Neutra and Forstner2012). The variations are likely due to the processes used to obtain the products and to oilseed botanical variety (which varies between Europe, Asia and North America) as well as to the experimental methodology used to evaluate the SID (e.g. type of non-digestible marker, laboratory analysis, duration of digesta collection; Cromwell et al., Reference Cromwell, Cline, Crenshaw, Crenshaw, Easter, Ewan, Hamilton, Hill, Lewis, Mahan, Nelssen, Pettigrew, Veum and Yen2000; Olukosi et al., Reference Olukosi, Bolarinwa, Cowieson and Adeola2012; Favero et al., Reference Favero, Ragland, Vieira, Owusu-Asiedu and Adeola2014). In our database, 25% of the studies were conducted in Europe, 22% in Asia and 53% in North America. This might explain why our consensus figures more closely matched North American data (NRC, Reference Neutra and Forstner2012).
Prediction of standardized ileal digestibility of essential amino acids in oilseed meals
The present meta-analysis combined results of 47 independently published studies in which EAA SID was measured or otherwise evaluated. Significant correlations between EAA SID and chemical composition (CP, EAA and fibre content) of the oilseed meals were obtained. Among the chemical components, NDF provided the best estimate thanks to a highly predictable negative linear relationship (Table 2). These results are in agreement with the existing literature (Lenis et al., Reference Lenis, Bikker, van der Meulen, van Diepen, Bakker and Jongbloed1996; Dilger et al., Reference Dilger, Sands, Ragland and Adeola2004). Dilger et al. (Reference Dilger, Sands, Ragland and Adeola2004) also found various linear reductions of the EAA SID of SBM with progressive inclusion of soy hulls. NDF may reduce the ileal digestibility of EAA in two ways. A portion of the protein is a component of the NDF matrix and is not free during digestion in the small intestine (Schulze et al., Reference Schulze, van Leeuwen, Verstegen, Huisman, Souffrant and Ahrens1994). In addition, NDF and its lignin fraction in particular have a high water retention capacity and thereby increase the viscosity of the digesta, which slows mass transfer and enzymatic reactions, and hence digestion and absorption of nutrients (Buraczewska et al., Reference Buraczewska, Święch, Tuśnio, Taciak, Ceregrzyn and Korczyński2007). Furthermore, gastric, pancreatic and biliary secretions appear to increase with NDF content of the feed (Ikegami et al., Reference Ikegami, Tsuchihashi, Harada, Tsuchihashi, Nishide and Innami1990), which would increase endogenous losses of protein due to sloughing of intestinal epithelium (Shah et al., Reference Shah, Atallah, Mahoney and Pellett1982) in addition to digestive proteases. SID is estimated from the AID and adjusted for basal endogenous AA contributions, therefore including specific endogenous losses. It has been reported that the amount of total endogenous nitrogen shed in the form of enzymes, mucus and protein from desquamated cells is a linear function of the amount of NDF in the feed (Schulze et al., Reference Schulze, van Leeuwen, Verstegen, Huisman, Souffrant and Ahrens1994).
For each EAA SID model, corrected Z i factors were calculated to adjust the model to each oilseed meal. These were generally positive for SBM and RSM and consistent with higher SID (or reduced specific endogenous losses) for SBM and RSM than for CSM. They also showed that the relationship between NDF and EAA SID was similar regardless of oilseed (no interaction, data not shown). The effect of NDF on EAA SID thus was not dependent on oilseed meal type. However, it is interesting to note that the slope of NDF v. SID varied from one EAA to the next. Lysine SID was the most affected by NDF. For example, increasing NDF in SBM by 1% decreased the SID of Lys and Met, respectively, by −0.459% and −0.325%. This greater negative impact of NDF on digestibility was observed for AAs with positively charged side groups (Arg, His and Lys) and aromatic side groups (Phe and Trp). The interaction of fibre with nutrients depends on conditions such as temperature, pH, ionic strength, dielectric constant and type of ions. These factors influence the hydration characteristics of fibre containing polyelectrolytes such as pectin (Renard et al., Reference Renard, Crepeau and Thibault1994). The low Thr SID (i.e. 72% to 85%) might be due to high endogenous loss of Thr (De Lange et al., Reference De Lange, Soufffant and Sauer1990). Mucin is very rich in Thr, which accounts for up to 30% of its AA composition (Neutra and Forstner, 1987). The fact that mucin is the main constituent of endogenous protein excretion could explain the low Thr digestibility generally reported (Marichal-Landin et al., Reference Marichal-landin, Sève, Colléaux and Lebreton1995; Huang et al., Reference Huang, Sauer, Marty and Hardin1999).
The accuracy of prediction of the general model was good for all EAA (RMSEP<6%). The models specific for each oilseed meal gave useful results only for RSM (Supplementary Table S1). This may be due to greater variation between the different sources of RSM, allowing the distribution of RSM in two distinct groups: NDF higher or lower than 28% dry matter (DM). Essential AA SID was consistent with these groupings, with greater NDF content reducing EAA SID, as reported by Messerschmidt et al. (Reference Messerschmidt, Eklund, Sauer, Rist, Rosenfelder, Spindler, Htoo, Schöne and Mosenthin2014) for different sources of RSM. In the case of SBM and CSM, estimation of EAA SID from NDF (or other chemical analyses) was not reliable. This may be due to the smaller amount of data for CSM and smaller variability (RSD=3.70%) in the NDF content of SBM in our database compared with the variability (RSD=6.51%) reported in the NRC (Reference Neutra and Forstner2012). In this study, surgical technique of canulation, meal processing and BW did not appear to have an effect on SID measurement (Supplementary Material S2).
Prediction of digestible ileal amino acid contents in oilseed meals
Our attempts to predict dEAA content from chemical analyses such as total EAA, CP or fibre content revealed a positive linear relationship between digestible and total values for all EAA (R 2=0.975 to 0.993). The negative intercepts for digestible Arg, His, Lys and Thr are probably related to the correction for endogenous losses. It is known that digestive secretion protein is richer in Thr than is crude oilseed protein, and that the endogenous loss/feed ingredient content ratio is higher for Thr than for other AAs in the case of SBM (Van Kempen et al., Reference Van Kempen, Kim, Jansman, Verstegen, Hancock, Lee, Gabert, Albin, Fahey, Grieshop and Mahan2002). These authors reported a negative intercept for Met, Cys, Thr and Trp but a positive intercept for Lys. However, we used a specific correction factor for each ingredient in the overall calculation of the intercept, and this for each EAA. We may therefore conclude that the higher specific endogenous losses are associated more with CSM and RSM than with SBM. This most likely is due to a greater NDF concentration in CSM and RSM than in SBM. A comparison of all SBM models developed from total EAA with the Van Kempen et al. (Reference Van Kempen, Kim, Jansman, Verstegen, Hancock, Lee, Gabert, Albin, Fahey, Grieshop and Mahan2002) models revealed that the observed dEAA contents were close to the contents predicted by the former while the latter tended to underestimate the real values of digestible Lys, Met, Thr and Trp. A comparison of the models established in this study with models published by Maison and Stein (Reference Maison and Stein2014) showed underestimation (i.e. observed values 9% to 12% higher than predicted values) by the latter for all EAA in RSM (data not shown).
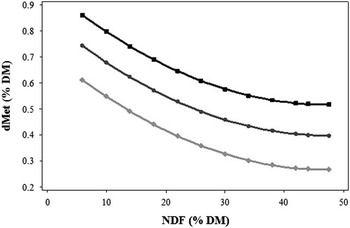
A quadratic relationship was found between NDF and all dEAA contents except His and Trp, for which linear relationships were found. For these two, the threshold above which the digestible content became independent of the NDF content of the feed was not reached. As the type of oilseed meal affected the intercept in these models, the intercept was adjusted for each type. A quadratic relationship between NDF and digestible ileal Met content was shown for all oilseed meal types, with only the intercept differing (Figure 2). These models would be valid for NDF contents up to a certain level in the feed. This curve shows that over this range of NDF content (NDFmax=42.5% to 63.7% of DM; Table 5), the dEAA content no longer depends on NDF content.
Impact of dietary concentration of NDF on the digestible standardized ileal methionine (dMet) content of oilseed meals in pig feed. Black: soybean meal; dark grey: rapeseed meal; light grey cottonseed meal. DM=dry matter.

In this study, models that predict dEAA content were derived from total content for each EAA and from NDF. From a statistical point of view, the most accurate models of dEAA content (with the lowest RMSE and highest R 2) were those derived from total EAA (R 2=0.977 to 0.993). However, although our model takes into account some variability between laboratories for the analysis of NDF, this analysis of NDF should be validated considering its inter-laboratory variability (Mertens, 2003). For dEAA contents, although the content NDF provides a valid estimate of dEAA, if the total essential amino acid (tEAA) content is available easily, for example by analysis by NIRS (near-infrared spectroscopy) (Kovalenko et al., 2006), the dEAA prediction model using the tEAA is more accurate with lower RMSE and a higher R 2.
Finally, unlike Messad et al. (Reference Messad, Létourneau-Montminy, Charbonneau, Sauvant and Guay2015), this study would predict the SID and dEAA contents from the chemical composition of the oilseed meals. The different components of SBM, RSM and CSM have been evaluated and the NDF and tEAA were found to be the best predictors of SID and content of dEAA. Messad et al. (Reference Messad, Létourneau-Montminy, Charbonneau, Sauvant and Guay2015) was intended to update the relations between CP, tEAA and the SID as published by NRC (1998) for all commonly used ingredients in pig feeds.
Conclusion
The results of this study show that fibre, more precisely NDF, was one of the best predictors of EAA SID and dEAA contents. Besides highlighting the factors that affect EAA digestibility and quantifying their effects (important information from a nutritional perspective), these models are also valuable from the practical perspective of the swine industry. Animal feed companies seek user-friendly methods of assessing the nutritional value of feed ingredients such as oilseed meals. By providing precise estimations of EAA available to livestock, such models will contribute to making pork production more sustainable.
Acknowledgements
This study was supported in part by a grant from Ministère de l'Agriculture, des Pêcheries et de l'Alimentation du Québec, to whom we are grateful.
Supplementary Material
To view supplementary material for this article, please visit http://dx.doi.org/10.1017/S1751731116000732