INTRODUCTION
The vast loess sequences of the Chinese Loess Plateau cover an ~440,000 km2 area, stretching back over the last 22 Ma and potentially to 40 Ma (Guo et al., Reference Guo, Ruddiman, Hao, Wu, Qiao, Zhu, Peng, Wei, Yuan and Liu2002; Licht et al., Reference Licht, van Cappelle, Abels, Ladant, Trabucho-Alexandre, France-Lanord and Donnadieu2014). They represent the world’s most important terrestrial climate and environmental change archive. They also provide an unparalleled opportunity to investigate past dust activity, which, in turn, gives insight into past dust sources and their controlling factors (Merkel et al., Reference Merkel, Rousseau, Stuut and Winckler2014). However, our understanding is limited by uncertainties over the source of this material, hence the fundamental controls on dust generation and transport pathways, and therefore its climatic significance. In turn, these affect our interpretation of the past influence of Asian dust on climate change and vice versa (Stuut and Prins, Reference Stuut and Prins2014), the climatic signal recorded in loess, and our knowledge of long-term climate change in Asia.
The provenance of the Quaternary Chinese loess deposits has been the subject of multiple competing hypotheses that include potential dust sources from erosion of both primary (i.e., proto-source rocks) and secondary (i.e., sediment from rivers draining primary source areas, sedimentary basins, and deserts) source material. Most studies, including this one, have necessarily examined a combination of both types of sources in attempts to reconstruct the likely proto-source origins, transport pathways, and stages in sediment transport and deposition (sedimentary basins, desert/dune sediment “holding areas,” or “pass zones”). Thus, both previous studies and this study examine an amalgamation of source types, from distant to local and direct to multi-step transport, predominantly focusing on the relative importance of mountain, playa, or desert sources across north and northwest China and Mongolia.
Multiple approaches to understanding Chinese loess provenance have been taken, including: analysis of spatial trends in loess characteristics (Lu and Sun, Reference Lu and Sun2000; Sun, Reference Sun2002), grain-size analysis (Prins et al., Reference Prins, Vriend, Nugteren, Vandenberghe, Lu, Zheng and Jan Weltje2007; Qiang et al., Reference Qiang, Chen, Wang, Niu and Song2010), bulk-sample geochemistry ( Jahn et al., Reference Jahn, Gallet and Han2001; Maher et al., Reference Maher, Mutch and Cunnungham2009), and modelling (Zhang, Reference Zhang2003). Recently there has been an increase in the number of provenance studies using single grain detrital zircons. Studies have generally undertaken U-Pb dating of zircon grains, representative of an igneous event in which grains have crystallised or a high pressure-temperature metamorphic event during which the grains have been recrystallized. The advances achieved through application of this method to Chinese loess (Stevens and Lu, Reference Stevens and Lu2010; Stevens et al., Reference Stevens, Carter, Watson, Vermeesch, Andò, Bird and Lu2013b; Nie et al., Reference Nie, Peng, Möller, Song, Stockli, Stevens and Horton2014; Bird et al., Reference Bird, Stevens, Rittner, Vermeesch, Carter, Andò and Garzanti2015; Licht et al., Reference Licht, Pullen, Kapp, Abell and Giesler2016; Zhang et al., Reference Zhang, Lu, Xu, Liu, Yang, Stevens and Bird2016) have shown that previously widely accepted hypotheses of dominant loess sources to the north of the Plateau (e.g., Mu Us, Hobq, and Gobi deserts [Sun, Reference Sun2002; Chen et al., Reference Chen, Li, Yang, Rao, Lu, Balsam, Sun and Ji2007]) may need revising. Instead, the northern Tibetan Plateau, the Yellow River, and other fluvial systems may play crucial roles in sediment production and delivery, which likely also bring sediment to some adjacent desert areas (e.g., Mu Us). However, within the Tibetan Plateau, multiple specific primary areas have been proposed, including the Songpan Basin, the Qilian Mountains (Chen et al., Reference Chen, Li, Yang, Rao, Lu, Balsam, Sun and Ji2007), and the Qaidam Basin (Pullen et al., Reference Pullen, Kapp, McCallister, Chang, Gehrels, Garzione, Heermance and Ding2011; Licht et al., Reference Licht, Pullen, Kapp, Abell and Giesler2016). In addition, some studies also suggest the addition of Gobi Altai or northern/northwestern desert-sourced dust to the loess (Che and Li, Reference Che and Li2013; Bird et al., Reference Bird, Stevens, Rittner, Vermeesch, Carter, Andò and Garzanti2015; Zhang et al., Reference Zhang, Lu, Xu, Liu, Yang, Stevens and Bird2016).
One of the most important, yet polarised, aspects of recent single-grain studies of Chinese loess source is the question of source variability through time (cf. Xiao et al., Reference Xiao, Zong, Li, Hu, Dupont-Nivet, Peng and Zhang2012; Che and Li, Reference Che and Li2013). Related to this is the problem of whether the source changes spatially over the Loess Plateau. These conflicts stem in part from methodological issues such as sampling, laboratory analyses, and statistical representativity, as well as inherent limitations with the sole use of zircon U-Pb analysis, such as differential zircon fertility in source rocks and overlapping age peaks in different source areas. Previous single-grain studies have generally relied on the untested assumption that individual provenance samples taken from a single loess or soil unit are representative of that entire unit, time period, or site. No quantification of the variation of single-grain provenance data within individual units has yet been attempted. Given that attempts to boost analysis numbers include combining data from multiple samples, this is important to constrain. Indeed, a recent quartz luminescence (OSL) and heavy mineral study by Stevens et al. (Reference Stevens, Adamiec, Bird and Lu2013a) highlighted an abrupt shift in provenance within the last glacial loess unit L1 at Beiguoyuan, on the northwest part of the Chinese Loess Plateau. Despite the clear advantages of single-grain analyses, at present no sites have been examined for provenance using single grains at a high sampling resolution within single sedimentary units. As such, the sub-orbital variability of single-grain dust source information is unknown and the degree to which individual samples can be considered representative of a unit is unclear. Furthermore, the minimum number of grains required to properly characterize a sample is the subject of debate, with numerous studies suggesting a range of analysis numbers depending on the complexity and degree of overlap of source rock zircon ages (Vermeesch, Reference Vermeesch2004; Xiao et al., Reference Xiao, Zong, Li, Hu, Dupont-Nivet, Peng and Zhang2012; Che and Li, Reference Che and Li2013; Pullen et al., Reference Pullen, Ibanez-Mejia, Gehrels, Ibanez-Mejia and Pecha2014; Licht et al., Reference Licht, Pullen, Kapp, Abell and Giesler2016; Zhang et al., Reference Zhang, Lu, Xu, Liu, Yang, Stevens and Bird2016). Thus, major questions remain over whether samples with greatly varying numbers of analysed grains (<100 to >1000) are comparable and whether a consensus is possible if each study uses different statistical approaches.
To address these issues, “Big Data” (Vermeesch and Garzanti, Reference Vermeesch and Garzanti2015) datasets are created here for potential source regions and the Chinese Loess Plateau to simultaneously examine the effect of grouping data on age assemblages and provenance assignments, potentially gain better statistical representativity, and determine if any additional information can be gained from large (n >800) sample datasets. We also utilize new high sampling resolution, multi-proxy, single-grain provenance analysis data from a typical Chinese Loess Plateau section at Beiguoyuan to investigate source changes with depth, including both detrital zircon U-Pb ages and garnet geochemistry, which is the first use of the latter in studies of Chinese loess.
Garnets are a detrital heavy mineral, relatively resistant to weathering, burial, or mechanical abrasion, and relatively common in the heavy mineral assemblage (Morton et al., Reference Morton, Hallsworth and Chalton2004) which makes up around 10% of the heavy mineral population of Chinese Loess samples, whereas zircon makes up less than ~1% (Bird et al., Reference Bird, Stevens, Rittner, Vermeesch, Carter, Andò and Garzanti2015). While 15 geochemically distinct compositional end-members can be found in nature, there are 6 types that commonly form solid solutions, namely (in descending order of their abundance): almandine (Fe3Al2Si3O12), spessartine (Mn3Al2Si3O12), pyrope (Mg3Al2Si3O12), grossular (Ca3Al2Si3O12), andradite (Ca3(Fe,Ti)2Si3O12), and uvarovite (Ca3Cr2Si3O12). Garnets are usually formed in metamorphic rocks and it is the metamorphic history (temperature and pressure conditions) along with composition of the source rock that defines garnet geochemistry and, therefore, the end-member type (Krippner et al., Reference Krippner, Meinhold, Morton and Eynatten2014; Alizai et al., Reference Alizai, Clift and Still2016; Stutenbecker et al., Reference Stutenbecker, Berger and Schlunegger2016). These source rock diagnostic geochemical characteristics combined with their rarity in igneous rock (von Eynatten and Dunkl, Reference von Eynatten and Dunkl2012) enable identification of the metamorphic setting, and make them very useful in provenance studies (Morton, Reference Morton1991; Morton et al., Reference Morton, Hallsworth and Chalton2004, Reference Morton, Meinhold, Howard, Phillips, Strogen, Abutarruma, Elgadry, Thusu and Whitham2011; Mange and Morton, Reference Mange and Morton2007; Andò et al., Reference Andò, Morton and Garzanti2013; Suggate and Hall, Reference Suggate and Hall2013; Krippner et al., Reference Krippner, Meinhold, Morton and Eynatten2014). The application of garnet geochemistry also complements zircon datasets, as the minerals provide information on two different source rock types, metamorphic (garnet) and igneous/high pressure-temperature metamorphic (zircon), and, therefore, provide a broader overview of different possible loess source areas.
SAMPLES AND METHODS
Sample collection
New samples
New samples were collected from the main loess section at Beiguoyuan (36°37'21.3” N, 107°17'12.2” E), located in the western area of the loess tableland of the Chinese Loess Plateau (Fig. 1). This site was previously investigated and has existing grain size and magnetic susceptibility data, along with a quartz OSL chronology (Stevens et al., Reference Stevens, Lu, Thomas and Armitage2008; Stevens and Lu, Reference Stevens and Lu2010). Additionally, a number of samples have been investigated for provenance using zircon U-Pb dating; a single sample from the top (2.1 m) of unit L1LL1 by Stevens et al. (Reference Stevens, Palk, Carter, Lu and Clift2010) and 11 samples spread across S0, L1LL1, L1LL2, S1, L2, and S2 by Bird et al. (Reference Bird, Stevens, Rittner, Vermeesch, Carter, Andò and Garzanti2015). However, as with all loess sites, Beiguoyuan’s provenance has never been investigated at high sampling resolution across two sedimentary units using single-grain methods. As noted above, luminescence and heavy mineral data from unit L1 of the site suggests that a potential abrupt change in provenance may occur at between 3.1 to 5.4 m depth in the sequence (Stevens et al., Reference Stevens, Adamiec, Bird and Lu2013a). Here, we investigated a 5.1 to 11 m depth of the Beiguoyuan loess section, comprising parts of the L1LL1 and L1SS1 units of last glacial loess, with samples taken every 40–60 cm. The samples were subject to standard heavy liquid and magnetic separation methods to extract heavy minerals (see Supplementary Data for more detail).
(color online) Map of source group used in this study, insert shows location of sites across the Chinese Loess Plateau. BYN, Beiguoyuan; CS, Cretaceaus Sandstone; CXN, Caoxian; JBN, Jingbian; LCN, Heimugou; LT, Lingtai; WN, Weinan; XF, Xifeng; XN, Xining. For location and the number of samples used, see Supplementary Table 1.

Existing datasets
The results of our U-Pb analysis were combined with existing published datasets (Supplementary Table 1) from the Chinese Loess Plateau and its potential sources. In many cases, published potential source area and loess samples contain relatively low numbers of zircon grains (<100). These were combined with the aim of creating datasets of sufficient size to be 95% confident of recording all age peaks representing >5% of grains in a population (Vermeesch, Reference Vermeesch2004; number of zircon grains >ca.100–120). To investigate the effects on provenance interpretations of grouping data in different ways, and potential errors stemming from this, the grouping of data followed a series of stages, starting at the broadest geographical and temporal level, and progressing to grouping of samples at higher temporal and spatial resolution:
Source data representing the main geomorphological settings were combined where multiple datasets from specific locations exist, e.g., Tarim Basin, east Mu Us, west Mu Us, Qaidam Basin, Songpan Basin, Cretaceous Sandstone, Gobi Altay Mountains, Pamir, and Kunlun Mountains (Fig. 1). In the case of the desert areas, data was combined into groups based on geographical and geomorphological settings, e.g., the Northern Deserts and Central Deserts. The Northern Deserts group represent the deserts to the immediate north and east of the Chinese Loss Plateau and comprise datasets from Horqin, Otindag, northeast sandy lands, and Central Mongolia. The Central Deserts group includes the Tengger and Badan Jaran Deserts and forms the area to the west and northwest of the Plateau. Only data from the upper reaches of the Yellow River were used, to avoid the effects of recycling of Loess Plateau material in the middle and lower reaches. This dataset is termed Yellow River throughout for simplicity. Lastly, loess datasets were combined to create an average for the entire Quaternary Chinese Loess Plateau (Supplementary Table 1).
Next, loess samples were grouped by site (Fig. 1), with averages from each site containing data from both loess and palaeosol units. The Chinese Loess Plateau samples were then re-grouped into two categories, loess and palaeosol, representing average values for each of the units across multiple sites. Finally, data from the two sampled individual units at Beiguoyuan were combined, in addition to individual sample analysis by depth/age.
Laboratory analysis
Zircon U-Pb dating
Zircon enriched mounts were subjected to U-Pb dating in the London Geochronology Centre at Birkbeck and University College London, using a New Wave NWR193 excimer laser coupled to an Agilent 7700x quadrupole-based, inductively coupled plasma mass spectrometer (ICP-MS) following Jackson et al. (Reference Jackson, Pearson, Griffin and Belousova2004). Due to the small grain size of wind-blown dust particles, a 20 μm laser spot was used and cores were preferentially targeted for spot location. Plešovice zircon (Sláma et al., Reference Sláma, Košler, Condon, Crowley, Gerdes, Hanchar and Horstwood2008) and National Institute of Standards and Technology (NIST) 612 silicate glass (Pearce et al., Reference Pearce, Perkins, Westgate, Gorton, Jackson, Neal and Chenery1997) standards were cyclically measured as references to correct for instrument mass bias and depth dependent inter-element fractionation of Pb, Th, and U. The Plešovice standard has a U-Pb concordant age of 337.13±0.37 Ma determined by a thermal ionisation mass spectrometer.
Data reduction software for the ICP-MS, GLITTER 4.4.3, was used to analyse real-time data. Age interpretation was based on uranium series isochrons; the 206Pb/238U series for grains <1.1 Ga and the 207Pb/206Pb series for grains >1.1 Ga. Ages were plotted along a concordia line and data outside +5% and -15% of the curve were rejected from further analysis. See Supplementary Information for raw data including element concentrations, ratios, and ages.
Garnet Raman spectra
The Jobin-Yvon Horiba “XploRA” apparatus equipped with an Olympus confocal microscope was used to determine garnet Raman spectra (in six diagnostic frequency regions between 210–245 cm−1, 340–380 cm−1, 515–560 cm−1, 800–870 cm−1, 870–927 cm−1), by focusing the 532 nm solid-state laser beam directly on the garnet surface in the grain mounts. The system was calibrated measuring the position of a diagnostic peak in fluorescent light at 545.8 nm for each spectrum and by use of the 520.7cm−1 Raman band of a silicon wafer, several times during each experimental session. Polynomial background and Canada balsam peaks were removed prior to wavenumber analysis. The Matlab analysis software MIRAGEM (Bersani et al., Reference Bersani, Andò, Vignola, Moltifiori, Marino, Lottici and Diella2009) was applied to Raman peak wavenumbers to determine the relative abundance of garnet end-members in each grain and verify the miscibility allowed within the garnet solid solution. The final output provided the relative abundance of the main garnet end-members (almandine, spessartine, pyrope, grossular, and andradite) in individual grains.
Statistical analysis
Multi-dimensional scaling (MDS; Vermeesch, Reference Vermeesch2013) was used to aid precise comparison and interpretation. Despite its relative novelty in provenance studies, MDS is already an essential tool for comparing detrital zircon age distributions (Che and Li, Reference Che and Li2013; Stevens et al., Reference Stevens, Carter, Watson, Vermeesch, Andò, Bird and Lu2013b; Nie et al., Reference Nie, Peng, Möller, Song, Stockli, Stevens and Horton2014; Bird et al., Reference Bird, Stevens, Rittner, Vermeesch, Carter, Andò and Garzanti2015), as it provides an opportunity for effective comparison of large and complex datasets in a visually attractive way. Closely related to Principal Component Analysis (PCA), multi-dimensional scaling produces two-dimensional “maps” as output, in which similar samples plot close together and dissimilar ones plot far apart, based on the Kolmogorov-Smirnov (KS) statistic (Vermeesch, Reference Vermeesch2013). There are a number of different ways to estimate an MDS configuration from a matrix of KS-dissimilarities. All the MDS configurations presented in this paper use a so-called “non-metric” algorithm. The details of this are not important for the interpretation, although it is useful to point out that the resulting plot coordinates are rescaled to unity. However, the visual assessment of age distributions by comparison of Kernel Density Estimation (KDE) diagrams (Vermeesch, Reference Vermeesch2012), while more difficult, is still essential for full provenance interpretation.
RESULTS
Zircon U-Pb ages
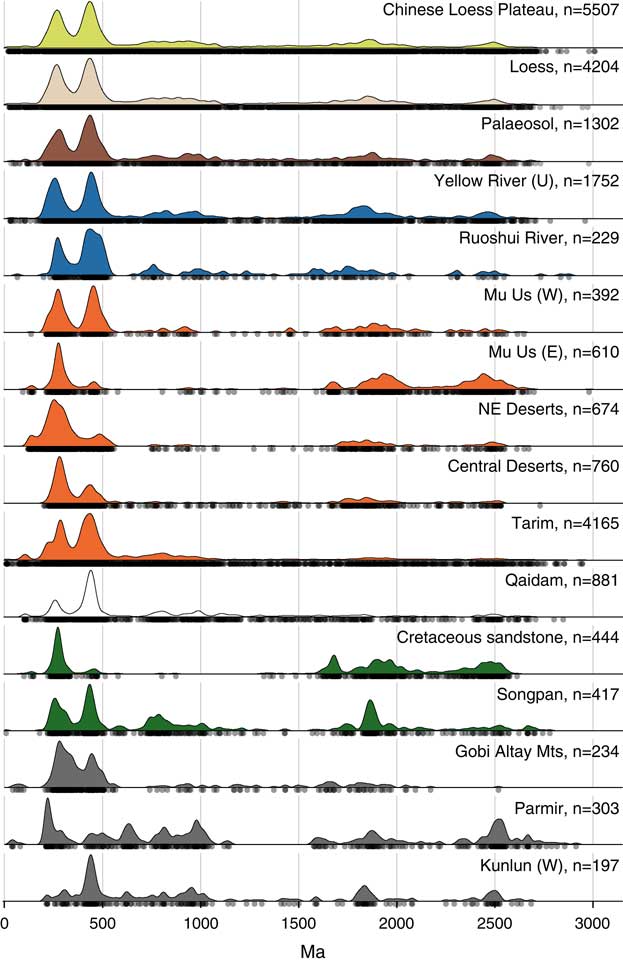
The KDE diagram of the U-Pb zircon age distribution of the averaged Chinese Loess Plateau sample shows a very characteristic double peak in the younger part of the age spectrum (250–500 Ma), with the first one at ca. 270 Ma and the second at ca. 450 Ma (Fig. 2). However, three additional age groups can be seen, albeit much smaller, at 500–1000, 1500–2000, and ~2500 Ma, as can a comparative absence of grains over 2750 Ma old. The younger age double peak has been described by numerous authors before (e.g., Stevens et al., Reference Stevens, Palk, Carter, Lu and Clift2010; Che and Li, Reference Che and Li2013; Bird et al., Reference Bird, Stevens, Rittner, Vermeesch, Carter, Andò and Garzanti2015) and is seen in all loess and palaeosol samples analysed to date. The second peak is the more dominant one in most samples. The only exception relates to data showing loess site averages, which are discussed later. To a greater or lesser degree, many of the age peaks seen in the loess data are also seen in numerous (but not all) potential source regions, as noted previously (Licht et al., Reference Licht, Pullen, Kapp, Abell and Giesler2016).
(color online) Zircon U-Pb Kernel Density Estimator (KDE) diagram for potential dust sources and the Chinese Loess Plateau. Source data and the loess and palaeosol samples are grouped from multiple samples. See Supplementary Table 1 for the data sources.

When comparing the separate averaged loess and palaeosol age distributions across the Chinese Loess Plateau (Fig. 2) there is a small difference in the double peaks, with a larger proportion of Ordovician-age grains in the combined palaeosol sample, while the three smaller peaks at ~750–1000 Ma, ~1700 Ma, and ~2500 Ma are replicated to some extent.
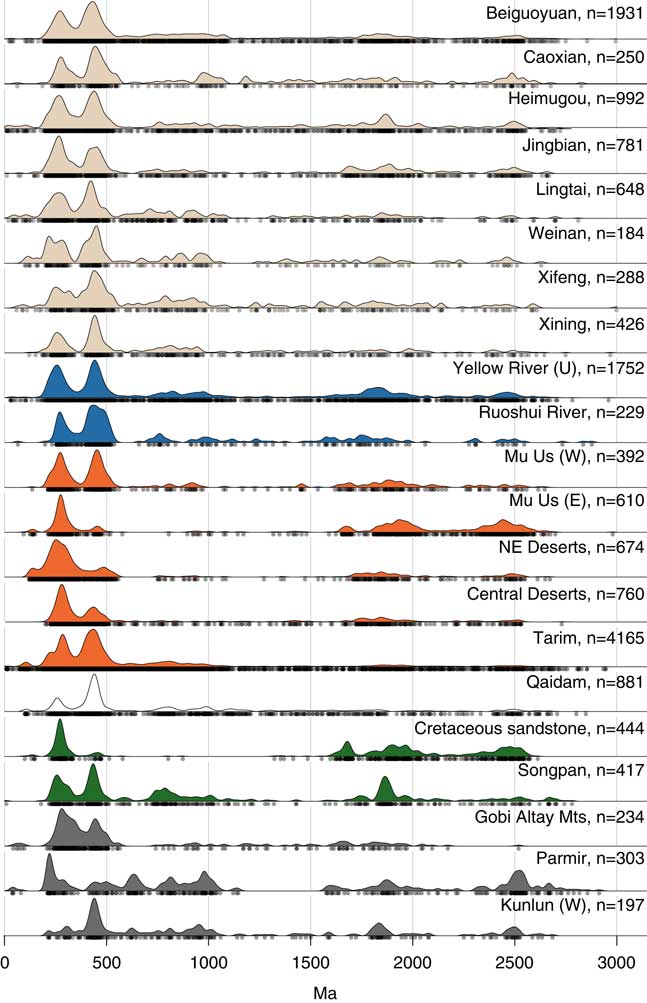
The results of the comparison of site averages show a much larger variability, both in terms of the shapes of the double peaks as well as in the distribution of the Cambrian and Precambrian ages (Fig. 3). Jingbian and Heimugou show increased relative importance of the 290 Ma age peak, while Lingtai and Heimugou also have few young (50–100 Ma) grains. The first peak expressed at Lingtai, Weinan, and Xifeng is not as well defined, as it has a wider spread. Caoxian, located on the far west of the Chinese Loess Plateau, has relatively large numbers of grains of 1000–1500 Ma age in comparison to other sites. Xining’s double peak has a slightly different shape, with a dominant and narrow Ordovician peak (the second peak) and fewer grains contributing to the ca. 250 Ma peak.
(color online) Zircon U-Pb Kernel Density Estimator (KDE) diagram for potential dust sources and the grouped data for each loess site.

Garnet geochemistry
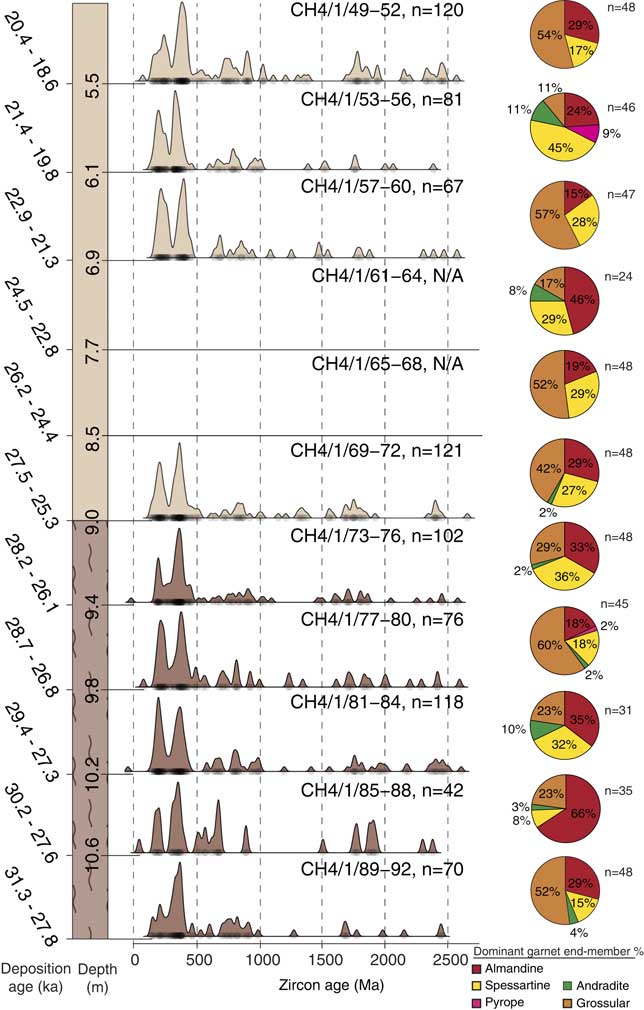
A total of 468 garnet grains in 11 samples were analysed (Fig. 4). It is stressed that these are preliminary data to show the validity of the technique and therefore only a small number of grains per sample (average=42) have been measured. Although the garnet samples show a lot of variability in the percentage of the garnet end-members, all samples contain primarily almandine, spessartine, and grossular. The relatively large proportion of the easily weathered grossular end-member suggests that it’s variation throughout the profile reflects provenance change or longer transport distance rather than increased weathering. Additionally, all samples apart from CH4/1/49-52, CH4/1/57-60, and CH4/1/65-68 contain small proportions of andradite. Particularly interesting is the presence of the pyrope garnet end-member in samples CH4/1/53-56 and CH4/1/77-80, associated with ultrabasic igneous and high-grade metamorphic rocks.
(color online) Stratigraphic log of the analysed Beiguoyuan section, optically stimulated luminescence (OSL) dates for each sample (original data adapted from Stevens et al., Reference Stevens, Lu, Thomas and Armitage2008), zircon U-Pb Kernel Density Estimator (KDE) diagram, and percentage of garnet end-members for each sample from Beiguoyuan.

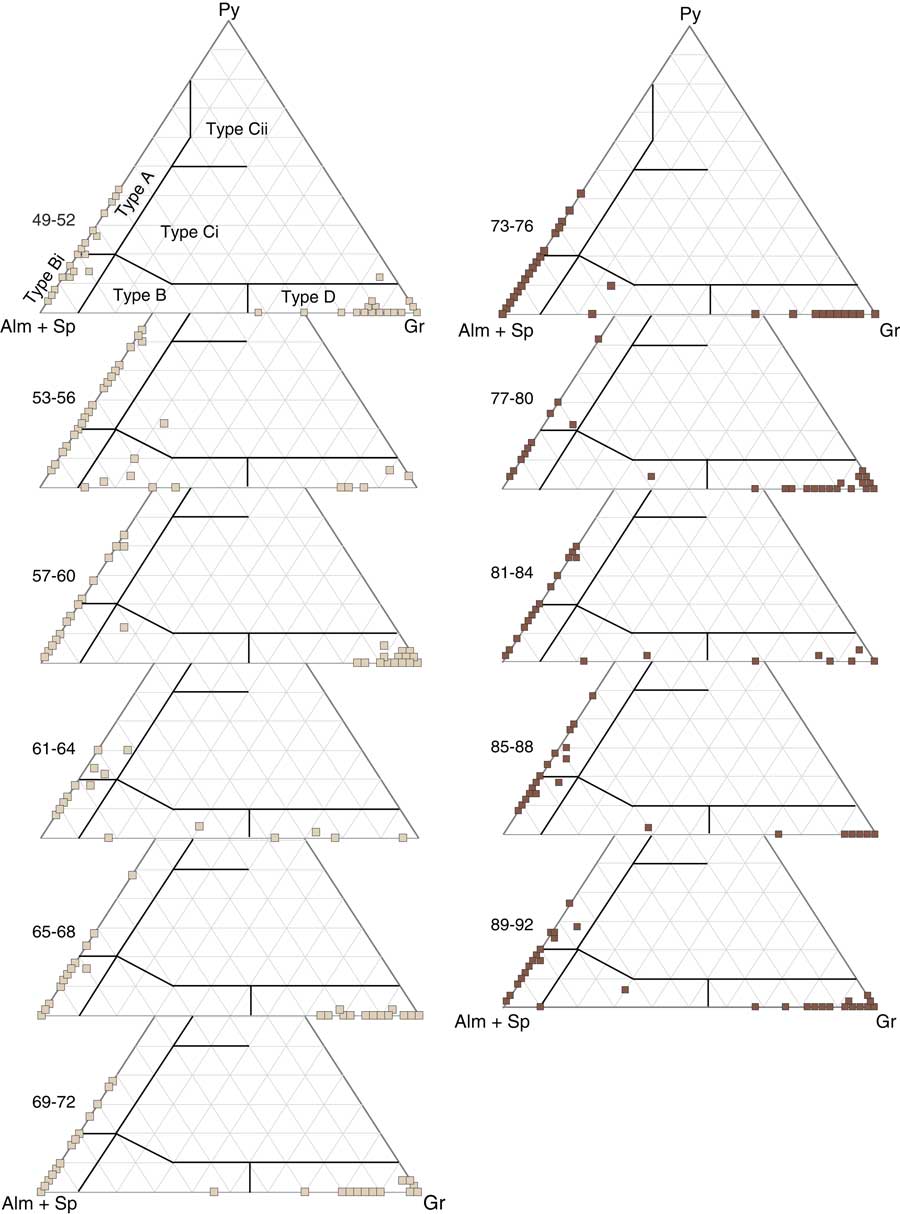
The Mange and Morton (Reference Mange and Morton2007) garnet evaluation scheme was applied to help distinguish and classify the data (Fig. 5). Krippner et al. (Reference Krippner, Meinhold, Morton and Eynatten2014) qualitatively evaluated various garnet classification diagrams in separating metamorphic source lithologies showing that Mange and Morton’s (Reference Mange and Morton2007) system to be relatively good in distinguishing between garnet-bearing rocks. The majority of the data from all samples can be found in areas A, Bi, and D. Type A garnets are low Ca, Mn, and high Mg. They come predominantly from high-grade granulite-facies metasediments or charnockites and intermediate felsic igneous rocks. Type Bi garnets are from intermediate to felsic igneous rocks, whereas type D garnets are from metasomatic rocks, very low-grade metamafic rocks, and ultrahigh temperature metamorphosed calc-silicate granulites. Sample CH4/1/53-56 is the only one with the majority of type B grains, which are produced by amphibolite-facies metasedimentary rocks, as well as type A garnets. Sample CH4/1/61-64 also looks different as it contains a large proportion of almandine and spessartine (Fig. 4). The difference is also seen on the ternary diagram (Fig. 5) with a different distribution of grains in the Type A and Type D areas as well as the presence of grains from amphibolite-facies metasedimentary rocks (Type B).
(color online) Garnet data from this study plotted using the Mange and Morton (Reference Mange and Morton2007) scheme. Samples are presented in stratigraphic order with beige colour denoting loess and brown palaeosol. Type A: mainly from high-grade granulite-facies metasediments or charnockites and intermediate felsic igneous rocks. Type B: amphibolite-facies metasedimentary rocks. Type Bi: intermediate to felsic igneous rocks. Type Ci: mainly from high-grade mafic rocks. Type Cii: ultramafics with high Mg (pyroxenites and peridotites). Type D: metasomatic rocks, very low-grade metamafic rocks, and ultrahigh temperature metamorphosed calc-silicate granulites.

DISCUSSION
Chinese Loess Plateau dust sources
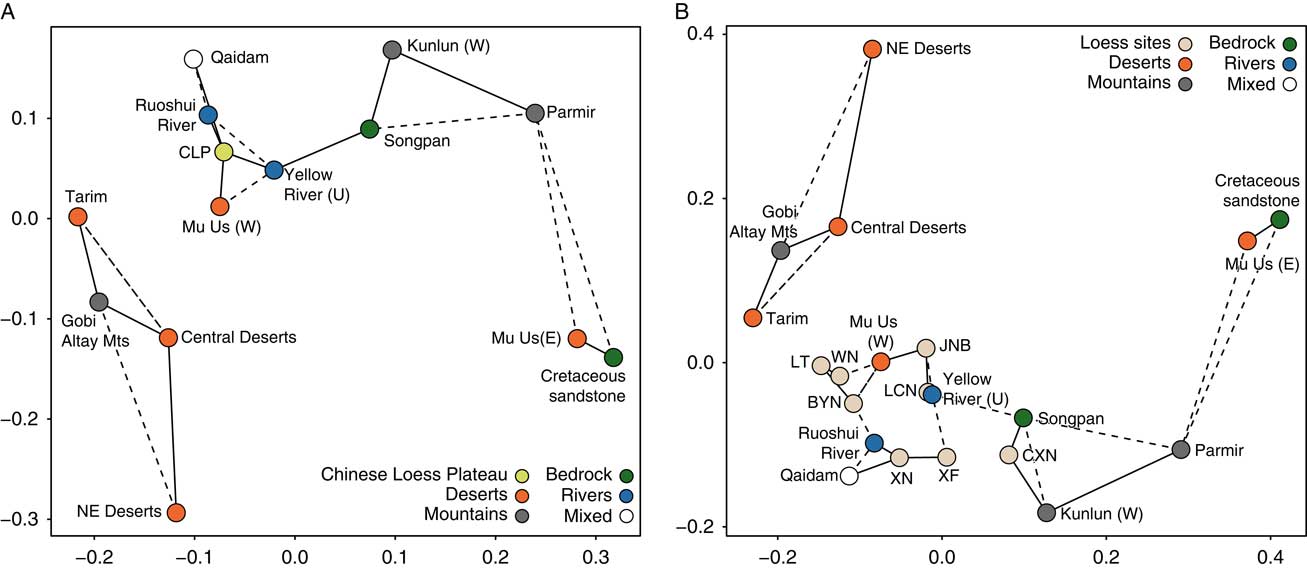
Creating a single average zircon U-Pb age distribution for all loess and palaeosol samples from the Chinese Loess Plateau has the advantage of 5500 data points, which increases the statistical representativity of the dataset. However, any hypothetical spatial and temporal variation is removed in this process, potentially leading to erroneous conclusions, as discussed below. From the KDE (Fig. 2) and MDS plots (Fig. 6A), this Chinese Loess Plateau average is most closely aligned with the Western Mu Us desert, the Roushui River (draining the Qilian mountains, northeast Tibet, towards the Alashan Plateau [Fig. 1]) and the upper reaches of the Yellow River (labelled Yellow River for simplicity) potential sources. The similarity is seen not only in the double peak in <500 Ma grains, but also in the 500–1000 Ma and 1500–2000 Ma age groups. The analysis strongly reinforces the hypothesis that the northeast Tibet Plateau (including Songpan and Qaidam, which also closely match the Chinese Loess Plateau average sample) is the main source of loess to the Chinese Loess Plateau, via the Yellow River, reinforcing depositional models proposed by Nie et al. (Reference Nie, Stevens, Rittner, Stockli, Garzanti, Limonta and Vermeesch2015), Stevens et al. (Reference Stevens, Carter, Watson, Vermeesch, Andò, Bird and Lu2013b), and further supported by Bird et al. (Reference Bird, Stevens, Rittner, Vermeesch, Carter, Andò and Garzanti2015) and Licht et al. (Reference Licht, Pullen, Kapp, Abell and Giesler2016). The Western Mu Us also shows a very strong similarity to the Loess Plateau and the upper reach of the Yellow River averages, which is likely to be because it shares the same Yellow River-Tibetan Plateau sources as the Loess Plateau, rather than acting as a major source itself. Sediments from the Tarim Basin are also fairly closely matched to the Loess Plateau average. However, we suggest that this is likely due to the fact that Tarim Basin-Taklamakan sediments are derived predominantly from Northern Tibetan plateau terranes (Rittner et al., Reference Rittner, Vermeesch, Carter, Bird, Stevens, Garzanti and Andò2016) that also appear to provide sediment to the Loess Plateau. Critically, the analysis again underlines the major differences between the Northern and Central Deserts and the Chinese Loess Plateau. The view that the North and Central Deserts act as the main dust source to the Loess Plateau and the associated transport model is inconsistent with these results. The large number of grains for almost every major source make this conclusion very robust (Pullen et al., Reference Pullen, Ibanez-Mejia, Gehrels, Ibanez-Mejia and Pecha2014). However, this still leaves room for lesser periodic inputs from these sources.
(color online) (A) Multi-dimensional scaling (MDS) diagram for zircon data in Figure 2, showing average Chinese Loess Plateau sample and source data. (B) MDS map for data in Figure 4, showing source data and the average values for loess sites across the Chinese Loess Plateau. Solid and dashed lines connect samples with the smallest and second-smallest KS-distances, respectively.

Spatial variability
Several geochemical and zircon single grain studies (Jahn et al., Reference Jahn, Gallet and Han2001; Maher et al., Reference Maher, Mutch and Cunnungham2009; Che and Li, Reference Che and Li2013) have suggested a lack of significant differences between the dust provenance of sites across the Chinese Loess Plateau. However, changes from northeast to west across the Chinese Loess Plateau have also been suggested (Xiao et al., Reference Xiao, Zong, Li, Hu, Dupont-Nivet, Peng and Zhang2012), and source signatures may show shifts from the Yellow River to the North China Craton in the northeast of the Loess Plateau (Bird et al., Reference Bird, Stevens, Rittner, Vermeesch, Carter, Andò and Garzanti2015).
Our results and existing published data (Fig. 6B) offer a chance to analyse the spatial variability between sites on the Loess Plateau using large sample sizes. It appears that the differences seen between loess sites are much smaller than the variability between potential sources, suggesting that for the most part all sites ultimately have the same north Tibetan Plateau origin. Three sites appear further away from the rest of the loess sites on the MDS diagram: Xining, Caoxian, and Xifeng. The closest relative to Xining on the MDS plot is the Qaidam Basin, which is likely due to the similarity in the shape of the second of the double peaks on the KDE (Fig. 3). This result is not entirely surprising considering the location of the site outside of the main part of the Chinese Loess Plateau on the eastern edge of the Tibetan plateau. Caoxian, which is located on the western edge of the Loess Plateau, again plots closer to the potential source compared to other loess sites. The position of the Xifeng site on the MDS plot is a little bit more puzzling. Despite its geographical location, relatively near Beiguoyuan and Lingtai (Fig. 1), Xifeng plots away from these two sites on the MDS diagram and closer with Xining and Caoxian. In this case, the geographical location of the site is clearly not the driver behind the observed difference. The KDE diagram offers no distinguishing clues as to the source of this variability, therefore at present we cannot explain the reason behind the placing of Xifeng on the MDS plot. It could also be argued that Jingbian and Heimuoguo form a separate group on the MDS diagram. Their eastern position on the Loess Plateau is consistent with the suggestion by Bird et al. (Reference Bird, Stevens, Rittner, Vermeesch, Carter, Andò and Garzanti2015) that mixing of northeastern Tibet material with eastern Mu Us material occurs at these sites, as evident by the larger proportion of the grains in the first part of the double peak.
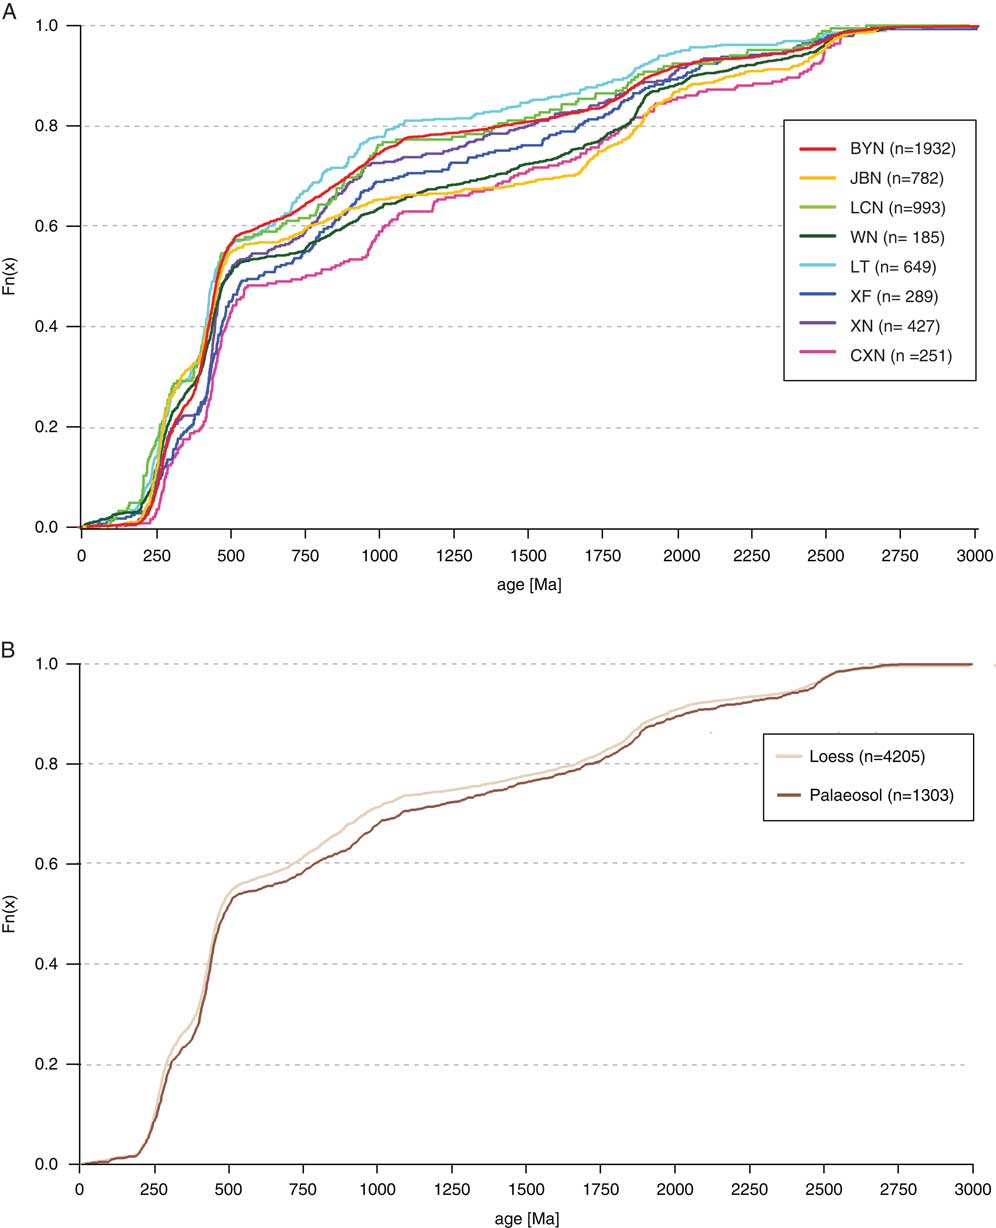
Simply plotting age distributions as cumulative percentages (Fig. 7A) provides answers about drivers of the sample variability in grain age distribution. By far the most dominant part of the KDE diagram, the 0–500 Ma bin, provides 43–57% grains for the age distribution. In most cases in that age group on the cumulative percentage diagram, the differences are already established in the very young age bin (0–250 Ma), with the largest variation of 14% between Weinan and Caoxian. The “classic” double peak (250–500 Ma) also contributes to sample variability with the divergence in this part varying between 4 and 10%. Intriguingly though, a lot of variability between sites can be seen in the parts of the zircon age distributions with fewer grains (500–2500 Ma). This variation between age spectra groups is not consistent from site to site, although there is a group of sites that have quite similar frequency distributions. Some sites show very similar 0–500 Ma percentages yet diverge in the later part of the plot (500–1500 Ma). For example, the largest shift, 11%, between Jingbian and Lingtai occurs in the 500–1000 Ma age portion of the cumulative curve. This shows that less dominant peaks may discriminate between samples that are very similar (e.g., the same sites over time or multiple sites in the same region) rather than the parts of the distribution with higher proportions of grains. However, the analysis of differences in minor peaks raises some issues. For example, in the 750–1000 Ma bin there are 200 grains in the sample from Beiguoyuan but only 23 grains in the sample from Caoxian. Given this order of magnitude difference, if these smaller peaks are the source of the variation on the cumulative age distribution diagram, it should be questioned whether these are true variations in the population, or just a sampling effect. Given that it is impractical to increase the number of analyses up to values where these smaller peaks all have similar or more statistically robust numbers of grains, we suggest that the probability of fully characterising these smaller peaks and using them in robust provenance determination remains low. Thus, if differences in smaller peaks are the only differences between samples, it may not be possible to robustly assign source differences and we are therefore at the limit of the utility of the technique.
(color online) Age distributions presented as a cumulative percentage. (A) Averages for each loess site. BYN, Beiguoyuan; CXN, Caoxian; JBN, Jingbian; LCN, Heimugou; ; LT, Lingtai; WN, Weinan; XF, Xifeng; XN, Xining. (B) Averages for grouped loess and palaeosol samples. Numbers in parentheses are number of grains per sample.

Temporal variability
Temporal variability between loess and palaeosol units
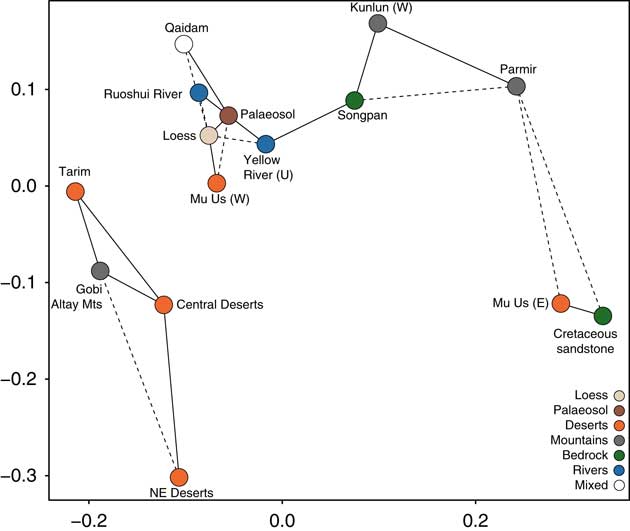
The temporal variation in dust source on the Chinese Loess Plateau through glacial and interglacial periods has been debated for a long time. Results of both the bulk geochemical (Jahn et al., Reference Jahn, Gallet and Han2001) and single grain approaches (Che and Li, Reference Che and Li2013; Bird et al., Reference Bird, Stevens, Rittner, Vermeesch, Carter, Andò and Garzanti2015) have tended to indicate that no real changes can be seen on Quaternary timescales. This was further supported by the recent work of Licht et al. (Reference Licht, Pullen, Kapp, Abell and Giesler2016) who suggested that recycling of older pre-deposited loess occurred under an “aeolian cannibalism” model. On the other hand, Sun et al. (Reference Sun, Tada, Chen, Liu, Toyoda, Tani, Ji and Isozaki2008), Sun and Zhu (Reference Sun and Zhu2010), and Xiao et al. (Reference Xiao, Zong, Li, Hu, Dupont-Nivet, Peng and Zhang2012) argue for a shift in dominant atmospheric circulation patterns between glacials and interglacials, based also on bulk and single grain approaches. Zircon age distributions (Fig. 2), for the two averaged loess and palaeosol samples over the Chinese Loess Plateau, do indeed show striking similarity. However, the KDE diagram suggests a small degree of variation, particularly in the <500 Ma double peak shape, but also in the 500–1000 Ma age range. This is also shown in the MDS diagram (Fig. 8) that slightly separates loess and palaeosol samples, though this difference is smaller than the variation between them and the potential source regions. The two combined loess and palaeosol samples comprise 4204 and 1302 grains respectively, which would suggest that the number of grains in each is statistically robust (Pullen et al., Reference Pullen, Ibanez-Mejia, Gehrels, Ibanez-Mejia and Pecha2014). On the surface, these results imply a very similar source between loess and soil units, yet at the same time suggest that the small differences could result from subtly different dust pathways between glacials and interglacials. To examine this further, we also plotted age distributions as cumulative percentages (Fig. 7B). Over 50% of the grains are found in the 0–500 Ma bin and this is again where the first order divergence between the two samples is observed. This is much smaller than the differences seen between individual sites (2.3%). In older parts of the distribution the difference between the two samples increases only very slightly until the 1000–1500 Ma bin, where another 2% shift apart is observed. However, here again relatively few grains represent these potentially diagnostic smaller peaks and it is therefore possible that these differences may not be meaningful. In any case, at least some of the differences between loess and soil samples appear in the dominant 0–500 Ma age peaks and are not explained this way. This begs the question as to whether this genuinely indicates a small source difference between glacial and interglacial periods on the Chinese Loess Plateau. One possibility is that this difference is real, given the large numbers of grains. However, here we argue that in fact the differences seen in the two age distributions are an artefact of grouping together samples from different sites. As shown above, the different sites have different total numbers of analysed grains and appear to show statistically significant differences in age distributions (Fig. 3 and 7B). As such, if a site or sites are contributing disproportionately more grains to one unit type (e.g., providing proportionally more grains to the combined loess sample than other sites do) then in theory this will introduce a bias to the grouped dataset leading to an artificial difference in the loess and soil distributions. For a theoretical example, take two sites that have different overall zircon age distributions, but where both sites individually show no differences between their own loess and palaeosol units. Under the data grouping process above, the data from the loess units from these two sites produce one overall loess value, and this process is repeated with the palaeosols. However, if one site contributed proportionally more grains to the loess sample, and the other contributed more from palaeosols, then the resulting averaged loess and palaeosol samples would show an artificial difference in age distribution. This difference likely results from site level heterogeneity and grouping data from sites with varying proportions of grains from loess and palaeosol units, rather than any real changes between loess and palaeosol sources. In this example, at both sites individually, loess and palaesol units show the same age distributions, yet there is a difference in the combined loess and palaeosol samples. In the real data presented here, given the differences between the sites shown in Figure 3 and the different proportions of grains in loess and palaeosol units at these sites (Supplementary Table 1), we propose this process of introducing an artificial difference between the two combined loess and palaeosol samples is likely to have occurred. For example, Beiguoyuan contributes the vast majority of the grains to the combined palaeosol sample (n=963). By contrast, sites such as Caoxian and Lingtai only contribute samples from loess units. These three sites show general differences in overall source (Fig. 3 and 6B), which would therefore drive artificial differences in the combined loess and palaeosol samples. Thus, this shows that extreme caution is required when grouping data in this way, as artificial differences between grouped samples can be introduced due to the varying proportions of grains included from individual sites that show apparent age distribution differences.
(color online) Multi-dimensional scaling (MDS) map for data in Figure 2, showing source data and the grouped loess and palaeosol samples. Full lines connect the two most similar samples, whereas dotted lines show the second closest data matches.

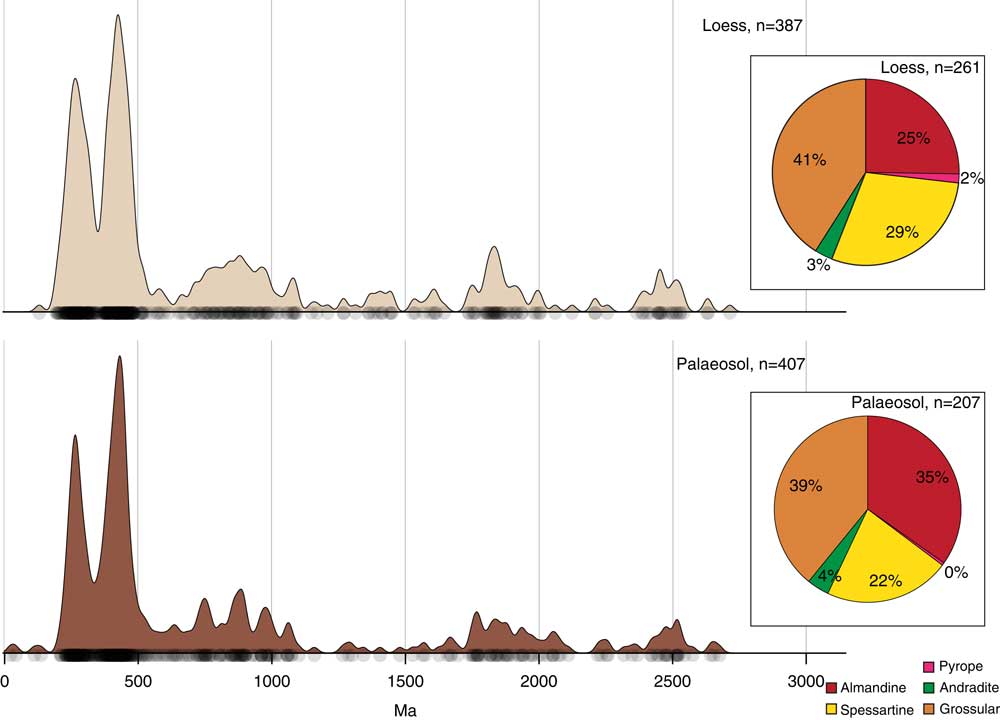
When comparing the palaeosol and loess units at Beiguoyuan, the zircon age distributions look very similar (Fig. 9). This supports the idea that loess and palaeosol units on the Chinese Loess Plateau have the same ultimate source, and that either there have been unchanging dust transport pathways between glacial and interglacial periods, and/or that there has been aeolian recycling of previously--deposited Loess Plateau material (e.g., Licht et al., Reference Licht, Pullen, Kapp, Abell and Giesler2016). This lack of difference in loess and palaeosol units is also seen in the garnet end-member data. For the most part the proportions of end-member groups are similar. While there are some small differences, such as the presence of pyrope and larger percentage of almandine in the loess sample, these are too small to be considered significant. The similarity between Beiguoyuan loess and soil units also strongly reinforces the suggestion above that the differences between the combined loess and the combined palaesol age spectra are artefacts of mixing together data from multiple sites with different source signatures and different relative analysis numbers between loess and soil units.
(color online) Kernel density diagram of zircon ages and percentage of garnet end-members for the L1LL1 loess and the L1SS1 palaeosol from Beiguoyuan.

Abrupt source shifts?
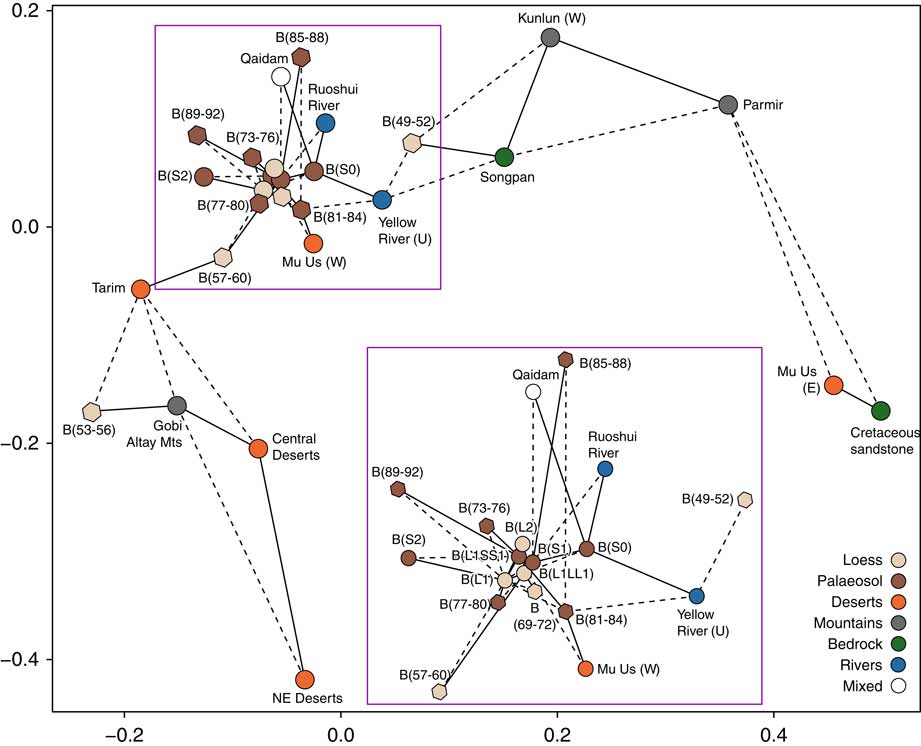
We further examine whether differences between multiple individual samples can be seen in zircon ages at the Beiguoyuan section, the first time this has been attempted. When comparing the new zircon ages (Fig. 4) from the multiple samples in L1 and S1 at Beiguoyuan, there are hints of more variability in the loess samples throughout the section than in the palaeosols. Plotting this data on an MDS map (Fig. 10) alongside the published loess data suggests that one of the largest differences can be seen between CH4/1/49-52 and CH4/1/53-56, two stratigraphically adjacent samples. The former has a much stronger c. 450 Ma peak and also larger numbers of >1.5 Ga grains. Sample CH4/1/53-56 shows the most similarity to the Gobi Altay Mountains found to the northwest of the Loess Plateau, whereas sample CH4/1/49-52 shows a large degree of similarity with the samples from the Songpan Basin (west of the Loess Plateau; Fig. 10). While we cannot discount the possibility that these differences are due to the effect of small sample size (Pullen et al., Reference Pullen, Ibanez-Mejia, Gehrels, Ibanez-Mejia and Pecha2014), the source shift is broadly coincident with a change in source at Beiguoyuan proposed by Stevens et al. (Reference Stevens, Adamiec, Bird and Lu2013a) using luminescence, elemental chemistry and heavy mineral composition data.
(color online) Multi-dimensional scaling (MDS) map for potential source areas as well as individual Beiguoyuan samples based on zircon ages. Full lines connect the two most similar samples, whereas dotted lines show the second closest data matches. The insert shows an enlarged the part of the graph. Hexagons represent data from this study and circles show published datasets. For clarity, sample codes for samples analysed in this study are shortened (e.g., CH4/1/49-52 is B[49-52]). The previously published data from Beiguoyuan is referred to as “B,” with the stratigraphic location denoted in parentheses.

To further test whether changes in source are occurring in the Beiguoyuan samples we have also analyzed garnet geochemistry. The garnet end-member percentage summary is quite variable down section. The presence of the ultrabasic igneous and high-grade metamorphic garnet end-member pyrope in samples CH4/1/53-56 and CH4/1/77-80 suggests a different metamorphic source to other samples. Further, sample CH4/1/53-56 contains andradite (11%), which is commonly associated with metasomatic and calcareous metamorphic rocks. It also has the highest proportion of spessartine (45%), and the smallest percentage of grossular (11%) in the whole section, therefore appearing considerably different from the rest of the samples analysed. Particularly interesting is that this sample is “sandwiched” between samples CH4/1/49-52 and CH4/1/57-60, which show very similar garnet end-member composition. While the effect of differential garnet dissolution is a potential factor, as is low analyses numbers, the uniform loess stratigraphy and the marked differences in garnet composition of sample CH4/1/53-56 support the general conclusion from our zircon analysis of the occurrence of short-term source change. However, the shift in source does not appear entirely consistent with the zircon data. The latter indicate an anomalous shift in both samples, CH4/1/49-52 and CH4/1/53-56, while garnet data only point to a differing CH4/1/53-56 composition compared to the rest of the sampled sequence.
The only other detrital garnet dataset from the area is the results of geochemical analysis of garnets from the Northern China sandy lands, Mongolia, and Tarim (Xie and Ding, Reference Xie and Ding2007). As the dataset is unfortunately not available for re-analysis, in order to test links between it and our garnet data, the latter were re-plotted following Xie and Ding’s (Reference Xie and Ding2007) scheme (Supplementary Fig. 1). This only allows a visual comparison of the datasets, but even so some patterns are notable. For example, the Northern sandy lands (including Otindag, Horqin, and Hulun Buir) lack grossular and andradite type grains, present in each of our datasets. Due to different watersheds and the nature of prevailing dust-transporting winds, these sandy lands are unlikely to be Loess Plateau dust sources and these data support this conclusion. The data also show that different areas can be distinguished using garnet end-members and reinforces the potential power of the approach. North China Craton khondalite comprises only Type-A grains and therefore is not a likely source of our Beiguoyuan samples. However, as all of our Beiguoyuan samples contain a proportion of Type-A grains, mixing of these khondalites with other grains, or episodic contributions from that area, cannot be completely excluded on the basis of these data alone.
As noted above, sample CH4/1/53-56 shows also a visible difference to the other samples under Xie and Ding’s (Reference Xie and Ding2007) scheme, with a marked majority of grains plotting in areas A and C (Supplementary Fig. 1). The same trend is seen when plotted using Mange and Morton’s (Reference Mange and Morton2007) tertiary diagram scheme (Fig. 5), with CH4/1/53-56 looking distinctly different from other samples. For most samples, the grains are predominantly associated with Types Bi and D, with some samples also having a proportion of grains in Type A. These reflect a range of intermediate to felsic rock, and low-grade metamafic rock sources, ranging in origin from the North China Block (Zhai et al., Reference Zhai, Windley, Kusky and Meng2007), the eastern Tianshan and Tarim Basin (Su, Reference Su2014), and the Qilian Mountains (Pirajno, Reference Pirajno2013). On the other hand, the majority of grains in CH4/1/53-56 are associated with areas A, B, and Ci — all linked to high-grade metamorphic facies. High-grade metamorphic rocks in Central Asia are associated with the Central Asian Orogenic Belt, e.g., the eastern Tianshan or Altay Mountains. This result combined with the detrital zircon data for the same sample suggests that a shift to a more Gobi-Altay Mountains dominant source occurred in sample CH4/1/53-56. Therefore, we argue that dust provenance can shift substantially within individual sedimentary units and, therefore, within individual glacial stages. This may indicate changes in dominant storm tracks or dust producing areas or, indeed, changes in dynamics of river transported dust material. The timing of the change in the garnet data also contrasts with results from Stevens et al. (Reference Stevens, Adamiec, Bird and Lu2013a). In that study, the abrupt change in source occurs in samples above CH4/1/53-56 in the section, corresponding to CH4/1/49-52, and was shown in heavy mineral, bulk geochemical, quartz luminescence data. The shift in sample CH4/1/49-52 is also seen in zircon U-Pb ages in our study. The source change in the sample CH4/1/53-56 occurred between 20.6±0.8 ka and 19.5±0.9 ka, when sedimentation rates were at their highest, ca. 57.42cm/ka (Stevens and Lu, Reference Stevens and Lu2009). This also corresponds with shifts in grain size and magnetic susceptibility. These differences are puzzling and could be explained in a number of ways. Firstly, it is possible that the change in metamorphic garnet source may occur slightly earlier than the shift in source of the major component of the dust material (as indicated by quartz luminescence). Secondly, the source change in CH4/1/53-56 may actually be showing the beginning of the provenance change in Stevens et al. (Reference Stevens, Adamiec, Bird and Lu2013a), perhaps because we here combine sediment samples taken over a 60 cm depth interval that corresponds with the level proposed as having different provenance in Stevens et al. (Reference Stevens, Adamiec, Bird and Lu2013a). Another possibility is that there are different dust sources operating at the same time, and that a shift in the dominant sources may occur even when a shift in metamorphic source does not, and vice versa. This is not entirely unreasonable as a change in erosion in dust source areas may be rather localised, potentially only affecting a garnet producing rock assemblage. If this is true it reinforces the need for multi-proxy approaches in provenance studies to identify the range of source types and when different types of source change may occur. The closeness in depth of the two changes may though still indicate some link, with potentially highly dynamic dust source variability over this cold, dry, peak last glacial interval. Unfortunately, a lack of data prevents this being explored further. In any case, the source shift appears in the middle of a relatively colder and drier (stronger winter monsoon) climate phase during MIS 2, reported in mollusc assemblages (Wu et al., Reference Wu, Liu, Gu and Pei2002) and pollen (Feng et al., Reference Feng, Tang, Ma, Zhai, Wu, Li and Zou2007) from the Chinese Loess Plateau, lake water levels in Central Asia (Yu et al., Reference Yu, Xue and Li2013), and desert advancement (Yang and Ding, Reference Yang and Ding2008). Modelling analysis by Chabangborn et al. (Reference Chabangborn, Brandefelt and Wohlfarth2014) further suggests a distinct intensity change in the winter phase of the East Asian Monsoon which coincides with our source shift at ca. 20–19 ka. These changes also broadly coincide, in timing and climatic behaviour, with the North Atlantic climatic shifts including Heinrich events (Rasmussen et al., Reference Rasmussen, Thomsen and Moros2016).
IMPLICATIONS FOR PROVENANCE ANALYSIS
Over the last 10 years, interest in loess provenance, especially on the Chinese Loess Plateau, has increased. This interest has resulted a conceptual shift of the main source of sediment from the desert areas to the north of the plateau to the North Tibetan Plateau, with the Yellow River likely playing a key role (Stevens et al., Reference Stevens, Carter, Watson, Vermeesch, Andò, Bird and Lu2013b; Nie et al., Reference Nie, Stevens, Rittner, Stockli, Garzanti, Limonta and Vermeesch2015; Licht et al., Reference Licht, Pullen, Kapp, Abell and Giesler2016). While there is certainly scope for continuing debate about the precise major source region, a key question now is how much more information can be obtained from detrital zircon U-Pb analyses. Given the discussion above, current practice alone may not allow further insights into source hypotheses due to limitations in resolving less common age peaks with sufficient statistical representativity, and potential bias inherent in mixing samples together to obtain a large sample size. Clearly, much can be done by undertaking high sample size analyses on multiple individual samples, but this is extremely labour intensive and the complexities of characterising possible source regions in this way are significant. As such, there is a need for the development of single-grain loess provenance methods that will complement these zircon analyses. Indeed, multi-proxy approaches may be the only way to resolve complex provenance questions such as loess sources (Tyrrell et al., Reference Tyrrell, Daly and Shannon2012), and are being shown to be effective in European loess deposits (Újvári et al., Reference Újvári, Klötzli, Kiraly and Ntaflos2013). Here, we have presented the results of the first garnet geochemistry application to loess sediments. This pilot study demonstrates that garnet end-members can provide information regarding parent metamorphic rocks as well as identify source shifts that may not be visible in some other methods. This approach has also a benefit of only needing much smaller samples, as garnets are more common in loess than zircons (Bird et al., Reference Bird, Thirlwall, Strachan and Manning2013). The integrated application of garnets and zircons is therefore a potentially powerful provenance tool that is worth further investigation. It is stressed, however, that these results come with a few limitations. The RAMAN spectral analysis processing software is still unable to resolve the six garnet end-members, which are most commonly used in provenance studies. Further, the number of grains analysed per sample would ideally be higher to achieve more statistically representative results. However, it is noted that the presence of some rarer grains, such as pyrope or uvarovite, is often sufficient to point to a specific metamorphic setting. The development of garnet type or other single grain provenance indicators requires substantial investment in characterising potential source rocks, for which few datasets exist currently. Additional lines of approach would be to obtain multiple lines of data from single zircon grains, as through the application of Hf isotopes to zircons dated using U-Pb (Újvári and Klötzli, Reference Újvári and Klötzli2015), as well as the use of other indicators such as heavy mineral assemblages (Stevens et al., Reference Stevens, Carter, Watson, Vermeesch, Andò, Bird and Lu2013b; Bird et al., Reference Bird, Stevens, Rittner, Vermeesch, Carter, Andò and Garzanti2015) or rutile chemistry (Újvári et al., Reference Újvári, Klötzli, Kiraly and Ntaflos2013). In any case, a key challenge now in loess provenance research is to identify complementary approaches that can address ambiguities inherent in U-Pb zircon dating results.
CONCLUSIONS
The approach of using large zircon U-Pb age datasets taken in this study shows that the deserts north of the Chinese Loess Plateau are not the main source of dust to the Plateau, in agreement with Pullen et al. (Reference Pullen, Kapp, McCallister, Chang, Gehrels, Garzione, Heermance and Ding2011), Stevens et al. (Reference Stevens, Carter, Watson, Vermeesch, Andò, Bird and Lu2013b), Bird et al. (Reference Bird, Stevens, Rittner, Vermeesch, Carter, Andò and Garzanti2015), and Nie et al. (Reference Nie, Stevens, Rittner, Stockli, Garzanti, Limonta and Vermeesch2015). Some spatial variation between loess sites is seen. It is hard to definitively determine, however, whether these differences reflect true source variations or a statistical artefact due to differing numbers of analysed grains at each site, particularly as in some cases the only differences in age spectra are seen in the poorly constrained uncommon age peaks. The small variation in site age spectra combined with the differential numbers of analyses in loess and soil units also most likely explains the (albeit small) zircon U-Pb age distribution variation between loess and palaeosols. Within the limits of the technique, this shows there is no or limited source difference between glacials and interglacials. As such, this demonstrates that increasing the number of zircons analysed by grouping datasets together will not elucidate any further information on the source(s) of Chinese loess.
This study also presents the results of the first high resolution, multi-proxy provenance investigation of loess from the Beiguoyuan site. The detrital garnet geochemistry combined with detrital zircon dating show that Beiguoyuan experienced a temporary, abrupt provenance shift at 20.6±0.8 ka and 19.5±0.9 ka, supporting the suggestion of Stevens et al. (Reference Stevens, Adamiec, Bird and Lu2013a) that abrupt changes to specific dust sources are possible in the Quaternary. The precise nature of this shift in relation to the one seen in Stevens et al. (Reference Stevens, Adamiec, Bird and Lu2013a) remains unclear, however. It is likely that this time period was arid and windy, characterised by highly variable dust sources.
These results have significant implications for loess provenance studies. Firstly, showing that zircon U-Pb dating alone is likely unable to distinguish further source detail for Quaternary loess, and implying a need to complement zircon U-Pb analysis with provenance methods like garnet geochemistry. Secondly, rapid changes in provenance within single loess units imply that the way sites are sampled needs to be reconsidered, as a single sample from an extensive sedimentary unit may not be truly representative of the source, and source variability, of sediments forming that unit.
Acknowledgments
The authors wish to thank Professor Andrew Carter (Birkbeck) for the access to the U-Pb laboratories. We are grateful for all assistance with garnet geochemistry analysis from Dr. Christopher Hayward (Edinburgh University), Dr. Victoria Smith and Dr. Paul Albert (Oxford University). This research was funded by NERC grant NE/I008837/1 and support is gratefully acknowledged.
Supplementary materials
To view supplementary material for this article, please visit https://doi.org/10.1017/qua.2017.86