




No CrossRef data available.
Social Capital and Racial Inequality in America
Published online by Cambridge University Press: 09 January 2004
Extract
“Social capital” is said to be strongly associated with better substantive outcomes as well as with civic and economic dimensions of equality in the United States. Robert Putnam argues in Bowling Alone that “the American states with the highest levels of social capital are precisely the states most characterized by economic and civic equality.” He adds: “[B]oth across space [i.e., states] and across time, equality and fraternity [social capital] are strongly positively correlated …. [T]he empirical evidence on recent trends is unambiguous …. Community and equality are mutually reinforcing, not mutually incompatible.”Putnam 2000, 358–63 (emphasis in original) and chapter 22 more generally; also see Rice and Sumberg 1997.He specializes in U.S. democracy and politics, especially as viewed through the analytical lenses of Latino and ethnic/minority politics, state/urban politics, and federalism. His book Faces of Inequality: Social Diversity in American Politics received the American Political Science Association's 1999 Woodrow Wilson Foundation Award.
Information
- Type
- SYMPOSIUM
- Information
- Copyright
- 2003 by the American Political Science Association
Yet in seeming contradiction to this “social capital thesis,” social capital and related factors such as “political culture” do not necessarily bridge across racial or ethnic groups; nor do they always engender relative civic and economic equality between blacks and whites. Even more problematic, higher aggregate social capital is sometimes associated with relatively worse outcomes for racial minorities.2
Cf. Meier et al. 1989 and Meier and Stewart 1991; additionally, see examinations of race and “political culture,” such as Hero and Tolbert 1996 and Hero 1998, which also find detrimental consequences.
Most analyses of social capital do not adequately confront conditions associated with race; as a result, they come to conclusions more benign than a fuller assessment warrants. Social-capital analyses implicitly emphasize absolute or aggregate indicators of equality and overlook or understate relative outcomes for minorities. They thus obscure important dimensions of the continuing inequality by race and mislead us in our thinking about equality and democracy in American politics. The appropriate assessment of social capital's impact on American civil society and politics shows that it depends on what dimensions of public life we consider, how we define “better off,” whether one is black or white, and whether one lives in a more or less racially heterogeneous community.3
Putnam's most recent work demonstrates that he has reached the same conclusion, largely from surveys and analyses conducted after he completed Bowling Alone. See his Web site, www.bowlingalone.com, for new data and arguments.
Arguments and Evidence
In Bowling Alone, Putnam created a “social capital index” (for 1990), which serves as his major explanatory (independent) variable concerning the contemporary importance of social capital. The index has five components and 14 specific variables, measuring community organizational life, engagement in public affairs, community volunteerism, informal sociability, and social trust.4
Putnam 2000, 291, chapters 16–22.
To begin, I examined the 1990 social-capital index for the American states (see Putnam's Web site, www.bowlingalone.com) and its relationship to a measure of state “minority diversity” (i.e., percent black, Latino, and Asian, in 1990).5
Hero 1998, 12.
There is also a strong relationship with the Rice and Sumberg 1997 measure of “civic culture” (a concept that is quite similar to social capital): r=−0.560, which was created separately from, but closely parallel to, the social-capital index. The relationship of the social-capital index with the civicculture indicator is r=0.818, cf. Putnam 2000, 495, n. 49.
Cf. Hero 1998, 9–14; Hero and Tolbert 1996 for similar findings concerning social diversity and “political culture”; Elazar 1972, 1984.
Putnam 2000; Rice and Sumberg 1997, 106–7.
Putnam's index of civic equality is “based on class differences in rates of political participation, as measured in Roper Social and Political Trends surveys, aggregated over 1974 to 1994. For each of the twelve forms of political participation—signing petitions, attending public meetings, and so on”—he constructed a “ratio of the logged incidence in the top quintile of the income distribution to the bottom quintile of the income distribution.”9
Putnam 2000, 497, emphasis added, and 359.
Putnam 2000, 359–61.
Nearly all the measures used in the civic-equality index come from surveys; and given the size and distribution of racial/ethnic populations in the United States, appropriate survey evidence is likely not available or even feasible across the 50 states. indicators of organizational activity also do not distinguish by the racial/ethnic backgrounds of participants. This gap in data constrains a full examination of civic equality relative to race. Nonetheless, census data for voter registration and turnout— drawn from the Current Population Survey (CPS) of the U.S. Census Bureau—are illuminating since “the voting population is the closest match in racial and ethnic terms to the population as a whole.”11
Verba et al. 1995, 237; also see chapter 8 more generally, and passim.
Civic Equality: Ratios
Registration ratios
Is social capital significantly related to more equal black/white voter registration ratios in the states? No. The bivariate relationships between social capital and black/white registration ratios are all negative and statistically significant, as shown in Table 1, Models 1, 3, and 5. Within each state, higher aggregate social capital is associated with larger gaps between black and white registration. There is also no support for the claim that social capital is positively related to more equal ratios after controlling for other factors that affect voter registration, such as minority diversity, black poverty, or both (see Table 1, Models 2, 4, and 6).12
In general, when I discuss issues of civic or economic equality—voter registration and turnout, poverty rates, etc.—I refer to blacks and whites. When discussing outcomes such as graduation and infant mortality, I refer to minorities and whites. (Incarceration is an exception here; the data are on blacks and whites.)

Turnout ratios
Social capital also does not go along with more equal black/white voter turnout ratios in the states. The bivariate relationship (in Table 2, see Models 1, 3, and 5) between social capital and black/white turnout is negative for all three years; and for two of the years it is significant. In the same two years, higher levels of social capital are associated with larger gaps in voting turnout between blacks and whites even when I control for minority diversity and black poverty (in Table 2, see Models 2, 4, and 6).
In short, civic equality (i.e., the ratio of black to white registration and turnout) is lower in states with high aggregate levels of capital. It is also lower in states with high aggregate levels of civic culture, according to another set of analyses not reported here.13
Moreover, essentially the same patterns occur when a “civic culture” measure (developed in Rice and Sumberg 1997)—a similar yet different indicator of community that correlates highly with the “social capital” index—is examined with registration ratios.
Hero et al. 2002. Evidence (from 1996 and 2000) on other forms of political participation corroborates these findings.

Economic Equality: Ratios
Putnam's Gini index of economic inequality, like his civic-equality measure, does not differentiate by racial groups within states. However, census data on per capita income and poverty levels, by racial/ethnic groups and within the states, are available. I use these data (for 1990) to examine racial/ethnic “economic equality.”
Here too, substantial evidence of racial differentiation appears; virtually no evidence supports the social-capital thesis, and much contradicts it.
Poverty ratios
Is social capital positively (and significantly) related to better black/white poverty ratios? No. The relationship is negative and weakly significant; states with higher levels of overall social capital show a somewhat greater disparity between levels of black poverty and white poverty. When one controls for the index of minority diversity, the relationship remains negative but is no longer statistically significant (data not shown in table form).
Per capita income ratios
Unlike poverty ratios, social capital is positively and significantly related (at p=0.001) to black/white per capita income ratios. That is, in states with higher levels of social capital, the income of the average black resident is relatively similar to the income of the average white resident.16 16
The same pattern holds if one compares Rice and Sumberg's measure of civic culture to income ratios.
It is not clear whether more equal income leads to more social capital, or the reverse. Social-capital analyses are ambiguous on this point, saying only that the patterns “go together.”17
Putnam 2000; cf. Tarrow 1996.
Civic Equality: Rates
Ratios of the type I have been exploring up to this point are most appropriate for examining relative patterns of equality within states. However, because the ratios are themselves products of the rates for minorities divided by the rates for whites, extreme (very high or very low) rates for either group will affect the overall ratios. For this reason, and because there are many ways to think about the concept of “equality,” some observers argue for examining the racial-group patterns (blacks compared to blacks, and whites compared to whites)—that is, rates across states—rather than comparing blacks to whites within a given state.
Both types of measurement are valuable. On the one hand, because “community” is presumably more plausible within states, the within-state (ratio) comparison is arguably the most fitting for examining racial/ethnic equality. Additionally, states exercise the major police power and domestic policy responsibilities in the U.S. federal system that are among the most relevant to equality concerns. On the other hand, group comparisons across states are fruitful since they recast debates about race and (in) equality into a more directly nation-centered rather than state-centered perspective on American society. I move, then, to the question of whether overall levels of social capital are associated with different outcomes for each racial group from one state to another. I address this in Table 3 and subsequent tables.

Registration rates
High levels of social capital do not go along with high rates of black voter registration across states. In the bivariate case, all three relationships are negative and one is significant.18
And one sees essentially the same findings when the civicculture measure is substituted for the social-capital indicator.
Similar, although somewhat weaker, relationships materialize when you substitute the civic-culture measure (data not shown) for the social-capital indicator.
Turnout rates
Overall, there is a slightly positive relationship between social capital and levels of black turnout, as Table 4 shows. The bivariate relationship in 1992 is negative and weakly significant; in all other models except one, bivariate or multivariate, the relationship is positive but not significant. The relationship between social capital and the black turnout rate for 1996 is positive and weakly significant after accounting for black population and black poverty.20
But this relationship does not hold when you substitute the civic-culture measure of community for the socialcapital indicator.
Social capital is more strongly related to white voter turnout rates in the bivariate and multivariate cases; the relationships for all three years are positive and significant (data not shown). Thus, when we compare across states within a given race, we see that black rates of registration or turnout are seldom significantly more equal where there is higher aggregate social capital, even though the rates for whites are.
This evidence on registration and turnout ratios and rates for blacks and whites strongly implies that the civic equality identified in studies of social capital is the result of high(er) levels for whites. Thus there is strong reason to wonder if findings that a sense of community is strongly related to civic equality are largely owing to patterns in states with large white populations and small minority populations. That is, the finding that civic equality is associated with social capital appears to be an artifact of white social capital and white civic participation, and perhaps of relative racial homogeneity in a number of states. By not disaggregating along racial lines, social-capital analyses incorrectly make strong, broad claims about the dynamics of equalization while masking what may be a situation of racial inequality. As Verba, Schlozman, and Brady put it in their analysis of voluntary activity in American politics, “the public's voice is often loud, sometimes clear, but rarely equal.”21
Verba et al. 1995, 509, emphasis added.
Economic Equality: Rates
Poverty rates
Let us turn now to rates of economic inequality within race and across states. Social capital is related to black poverty rates; the bivariate relationship is negative and significant for 1990 (p =0.01). In other words, black poverty rates are lower (better) in states where there is more aggregate social capital—a finding consistent with the social-capital thesis. But this inverse relationship between social capital and the black poverty rate does not hold up when the percent black in a state is controlled. Social capital is not related to white poverty rates (results not shown here); in the bivariate case, there is a weakly negative, insignificant relationship, which is similar in the multivariate case.
Per capita income rates
As social capital in a state increases, black per capita income increases slightly in that state in comparison to black incomes in other states; this weak, insignificant relationship also holds after controlling for the percent of the population that is black. If we compare civic culture with black per capita income, we find a positive relationship that is in fact statistically significant (p =0.001); it remains after controlling for percentage of black population in a state (at p=0.05). The average income of whites in a state declines as social capital increases (not shown here), even after controlling for black population.22
Yet with the same controls, civic culture and white per capita income are positively and significantly related.
Because of the issue of murky causality, it is difficult to interpret these findings on the connections between social capital (or civic culture) and poverty or income. Which comes first in a state—lower rates of black poverty or slightly higher rates of black income, or higher levels of social capital? Do well-off blacks move into states with active communities; or do states with active communities work harder to reduce levels of black poverty (but not white)? We do not know. Furthermore, different indicators of community—social capital rather than civic culture—produce somewhat different findings; hence, the specific operationalization and measurement of social capital and of community matters more than it should.23
As I noted at the beginning of this article, Putnam and others have found clear evidence that “American states with the highest levels of social capital are precisely the states most characterized by economic … equality.” But my findings have complicated that picture. Perhaps earlier findings on income distribution—based on Gini coefficients, which speak to social class but not directly to racial (in)equality—may be attributable to white patterns. That seems especially likely since economic equality as measured by Gini coefficients tends to be highest in racially homogeneous states.24
See Putnam 2000, 360.
Examining Substantive Equality
The social-capital thesis asserts that when the United States has more social capital, and in states with high levels of social capital, there are boosts in child welfare and educational performance, safe and productive neighborhoods, economic prosperity, and health and happiness. For example, “kids are better off in high social capital states,” “schools work better in high social capital states,” and “mortality is lower in high social capital states.”25
Putnam 2000, 298, 300, 330.
Do these strong claims (that better substantive outcomes are associated with higher levels of social capital) hold when we examine relative, i.e., minority-to-white, indicators rather than absolute or aggregate measures? To address this question, I created relative or disaggregated indicators somewhat similar to previous research26
Hero and Tolbert 1996; also see Hero 1998; cf. Radcliff and Saiz 1995.
The latter two approaches account for outliers or extreme cases.
Substantive Equality: Ratios
On the whole, the results here resemble those we found earlier regarding voter registration and turnout: higher levels of social capital do not go along with more equality in outcomes between minorities (or blacks) and whites. Instead, the data indicate worse relative outcomes for minorities (or for blacks alone, in the case of incarceration patterns: see explanation below) on three of four indicators. The pattern generally holds across the several types of regression analyses, and with or without controls for levels of minority diversity in states. This evidence starkly contradicts the social-capital thesis, much as the civic-equality ratios did.
Minority school graduation ratios
The gap between graduation rates for minorities and whites is greater in states with high levels of social capital, with or without controls for the level of minority diversity and/or black poverty rates within states.28
Cf. Putnam 2000, chapter 17, especially 297–98; see Table 5.a. This pattern holds, and is actually more pronounced, when the civic-culture measure replaces the social-capital measure of community.
Hero 1998, 91–2; cf. Meier et al. 1989 and Meier and Stewart 1991.

Minority school suspension ratios
The gap between minority and Anglo suspension rates is, similarly, higher in states with high levels of social capital, as Table 5.a. shows. The pattern holds with or without controls for levels of black poverty rates, but not after controlling for minority diversity alone or when diversity and black poverty are both considered. Civic culture is not significantly related to minorityto-white suspension ratios, either in the bivariate case or in the multivariate case.
Black incarceration ratios
Table 5.b. shows black-to-white incarceration ratios. (In this case, data on Hispanics are imprecise because Hispanics are categorized as “other,” and it is not clear how many people in the category of “other” are not Hispanic—e.g., Asian American or Native American. Therefore, I focus only on non-Hispanic blacks and non-Hispanic whites.) Clearly, states with high levels of social capital show worse relative outcomes for blacks; this pattern persists even when controlling for levels of minority diversity and/or black poverty.30
Cf. Putnam 2000, chapter 18; Hero 1998, 105–7.

Minority infant mortality ratios
Unlike for three previous indicators, the relative gap between minorities and whites with regard to infant mortality does not rise as social capital within a state rises (see Table 5.b.), nor does it fall. There is no statistically significant relationship here.31
Cf. Putnam 2000, 297, 328; cf. Hero 1998, 99–100.
In sum, higher social capital in a state is not associated with better relative substantive outcomes for racial minorities. Instead, these outcomes are sometimes worse in states with high(er) levels of social capital, even after accounting for the proportion of minority population and their poverty rates. Earlier findings of better overall outcomes in high social capital states result from a focus on absolute or aggregate measures, including the outcomes for the large nonminority populations in relatively homogeneous states. These outcomes contrast substantially with those of the minority populations.
Substantive Equality: Rates
As with the discussion of civic and economic equality, I turn now from a focus on ratios of racial minorities compared to whites within a state, to rates of inequality within a race across states; the essential findings follow in Table 6.

Minority school graduation rates
Graduation rates for minorities clearly improve as aggregate social capital increases; this is true in the bivariate as well as the multivariate cases, which control for levels of diversity and black poverty rates (see Table 6.a.). This impressively supports the social-capital thesis and is reaffirmed when civic culture is substituted for the social-capital measure.
Minority school suspension rates
In strong contrast to the findings for minority graduation rates, minority school suspension rates are significantly higher (much worse) in states where there is more aggregate social capital. This is so in the bivariate analysis, after accounting for the size of either minority populations or black poverty rates, or after accounting for both (see Table 6.a.). The measure of civic culture also shows higher rates of suspension for minorities in states with a greater civic culture. Together, these contrasting findings on graduation and suspension might indicate economic polarization within the minority population, a finding in keeping with the earlier discussion of poverty and ratios of per capita income.32
Cf. Hochschild 1995; Dawson 1994.
Black incarceration rates
Black incarceration rates are no less or more disparate where there is higher aggregate social capital, in the bivariate case or in the multivariate case (see Table 6.b.). However, they are higher (worse) when you control for levels of minority diversity alone and combined with black poverty rates in the robust regression analysis (data not shown); and the relationship with the civic-culture indicator is quite similar when controls are introduced. To the extent that black incarceration rates are higher in states where there is more aggregate social capital, the data are not consistent with the social-capital thesis' claims about equality; but on this measure, the data tell an ambiguous story.

Minority infant mortality rates
The relationship between social capital and minority infant mortality rates is not statistically significant in the bivariate case. However, infant mortality rates among minorities may be lower (better) where there is more social capital, if you account for levels of minority diversity either alone or together with black poverty rates (see Table 6.b.). The civic-culture measure produces roughly similar findings when controls are added. Here, social capital is associated with positive outcomes.
The outcomes with regard to rates are sometimes, but not always, consistent with social-capital claims. Minority graduation rates are higher where there is higher social capital, but minority suspension rates are also higher. Rates of infant mortality among minorities, however, are lower in states with high levels of social capital. The minority graduation rates, in combination with the suspension and incarceration rates, indicate that social capital may have facilitative effects for some people of color and substantial social-control effects for other people of color.33
Edelman 1967; Smith 1993.
Summary and Conclusions
The social-capital thesis has deeply influenced thinking about community, equality, and democracy in the United States and around the world. But social-capital studies understate the importance of race and ethnicity in their conceptualization and analyses. They focus almost entirely on aggregate outcomes and absolute gains. However, race—as well as ethnicity and class—is fundamental in defining American “community” and in understanding American civil society. Social capital and civic culture are negatively and substantially related to racial and ethnic diversity in the states; thus, the “bridging” extolled in states with high social capital is more limited than most analyses have recognized. The pattern in high social-capital settings that are relatively racially homogeneous may be better characterized as “bounded bridging,” or “biased bonding.”
Similarly, the evidence on civic equality and substantive equality ratios suggests no support for—and often directly contradicts —the implied claims of the social-capital thesis. I found little evidence that racial equality on civic or substantive dimensions is associated with more aggregate social capital. It is primarily for economic equality across the races that some support for the social-capital thesis is indicated. Nevertheless, to the extent that more community in the aggregate is associated with more economic equality, that association occurs only or mostly in the white population and/or around social-class issues.
Configurations of social capital are clearly complicated and need to be better understood before we accept them as having generally benevolent consequences. In some ways, community may be as much a problem as it is a solution for a host of social and political concerns in American civil society. For instance, Putnam has noted a “ … risk that emphasizing community exacerbates division and exclusion. Since social capital is inevitably easier to foster within homogeneous communities, emphasis on its creation may inadvertently shift the balance away from bridging social capital and toward bonding social capital.”34
Putnam 2000, 400, all emphases added.
The findings in this article also raise normative and theoretical questions about whether we should think about racial-group equality within or across states, since different understandings of equality are implied by each choice. In assessing American institutions, it matters whether the federal polity is considered from more nation-centered or state-centered perspectives, because the identification and nature of “problems” and potential “solutions” are likely to be defined and addressed differently. And how should African Americans judge a state in which there is greater racial inequality but also a higher floor, as compared with a state in which blacks are on average poorer or less politically active but not so dissimilar to whites?

Most generally, we must appreciate the complexity of American equality. A more complete, more fitting understanding of American community, and of its presumed democratic and egalitarian aspirations, is likely to emerge when we theoretically and empirically integrate that complexity into our thinking, scholarship, and public-policy discourse.
References
Dawson Michael1994 Behind the Mule: Race and Class in African-American PoliticsPrincetonPrinceton University Press
Edelman Murray1967 The Symbolic Uses of PoliticsUrbanaUniversity of Illinois Press
Elazar Daniel J1972, 1984"> American Federalism: A View from the StatesNew YorkCrowell
Hero Rodney E1998 Faces of Inequality: Social Diversity in American PoliticsOxfordOxford University Press
Hero Rodney ECaroline J Tolbert1996 A racial/ethnic diversity interpretation of politics and policy in the states of the U.S American Journal of Political Science 40 3851-71Google Scholar
Hero Rodney ECaroline J. TolbertRamona McNeal2002 “Race” and “community” as influences on political participation: Social diversity and social capital considered. Paper presented at the American Political Science Association annual meeting, 29 August–1 September, Boston
Hochschild Jennifer L.1995 Facing Up to the American Dream: Race, Class, and the Soul of the NationPrincetonPrinceton University Press
Meier KennethKennethStewart Jr1991 The Politics of Hispanic EducationAlbanyState University of New York Press
Meier KennethJoseph Stewart Jr.Robert England1989 Race, Class, and Education: The Politics of Second Generation DiscriminationMadisonUniversity of Wisconsin Press.
Putnam Robert D.2000 Bowling Alone: The Collapse and Revival of American CommunityNew YorkSimon and Schuster.
Radcliff BenjaminMartin Saiz.1995 Race, turnout, and public policy in the American states Political Research Quarterly 48 4775-94Google Scholar
Rice Tom WAlexander F Sumberg1997 Civic culture and government performance in the American states Publius: The Journal of Federalism 27 199 114Google Scholar
Smith Rogers M1993 Beyond Tocqueville, Myrdal, and Hartz: The multiple traditions in America American Political Science Review 87 3549-66Google Scholar
Tarrow Sidney1996 Making social science work across space and time American Political Science Review 90 2389-97Google Scholar
Verba SidneyKay Lehman SchlozmanHenry E Brady1995 Voice and Equality: Civic Voluntarism in American PoliticsCambridgeHarvard University Press
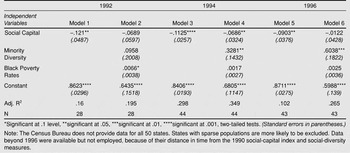
Social Capital with Racial Civic Equality:Voter Registration Ratios, within States Dependent Variable: Black/White Voter Registration Ratio
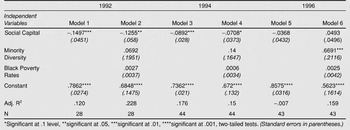
Social Capital with Racial Civic Equality: Voter Turnout Ratios, within States Dependent Variable: Black/White Voter Turnout Ratio
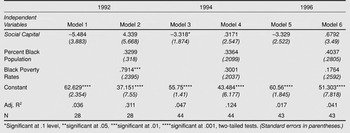
Social Capital with Black Voter Registration Rates, across States Dependent Variable: Black Voter Registration Rate
Social Capital with Black Voter Turnout Rates, across States Dependent Variable: Black Voter Turnout Rate
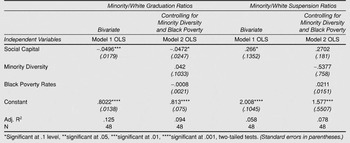
Minority Outcomes, Ratios, and Social Capital 5.a. Dependent Variables: Minority/White Graduation and Suspension Ratios
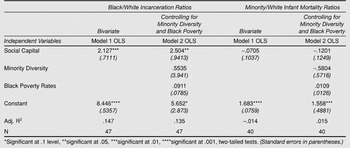
5.b. Dependent Variables: Black/White Incarceration and Minority Infant Mortality Ratios
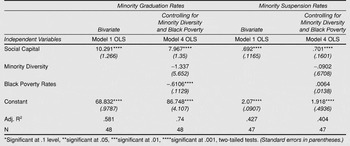
Minority Outcomes, Rates, and Social Capital 6.a. Dependent Variable: Minority Graduation and Suspension Rates
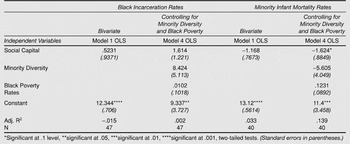
6.b. Dependent Variable: Black Incarceration and Minority infant Mortality Rates
 You have
Access
- 107
- Cited by