I. INTRODUCTION
Eu3+ activated phosphors have attracted a considerable amount of academic attention over the last decades due to their application as the red components in different luminescent devices including fluorescent lamps, cathode ray tubes, field emission displays, and plasma display panels.Reference Park, Park, Kim, Park and Choi1–Reference Sun, Li, Song, Gong and Zhang4 Among these phosphors, the general properties of nanocrystalline based Lu2O3 have been investigated by several workers,Reference Guo, Yin, Dong, Xu, Lou and Zhang5–Reference Topping and Sarin8 due to its outstanding features including high density (9.4 g/cm3), excellent physical and chemical stability, nonhygroscopicity, high thermal conductivity (12.5 W/mK), and large band gap (5.3 eV) large enough to be easily doped with rare earth ions.Reference Zych, Hrreniak and Strek9 Indeed, all of these make lutetia a promising material for most luminescent devices. Furthermore, it has been stated that lutetium is a more favorable cation than other ions, such as yttrium for lanthanide dopant emission.Reference Boyer, Vetrone, Capobianco, Speghini and Bettinnelli10 Additionally, the material presents a cubic structure, which facilities the preparation of transparent ceramics.Reference Brecher, Bartram and Lempicki11 However, in some applications, such as the so-called fourth generation solid-state UV white-light emitting diodes (LEDs), it is important to produce a material which can absorb light in the 340–440 nm range, instead of the common 254 nm, and, also, with an improved light yield.Reference Wu, Liang, Chen, Liu and Li12 On the other hand, the common red emitting phosphor for white-LEDs, Y2O2S:Eu3+, presents several problems, particularly in relation to efficiency and poor chemical stability.Reference Cao, Tian, Chen, Xiao, Liu and Li13 Therefore, to produce an improved material, the codoping of the matrix has been proposed. Indeed, this is necessary because, e.g., in the case of the Lu2O3:Eu3+, the light yield can be increased 40% by adding Tb3+ ions.Reference Liu, Yang, Qian, Wang and Wang14 For UV white-LEDs, the codoping Eu3+ with Bi3+ has been proposed for several materials, such as CaMoO4,Reference Kang, Hu, Wu, Ju, Mu and Li15 Y2O2S,Reference Zhilong, Yuhua, Jiachi and Yanghua16 YVO4,Reference Park, Jung and Yoon17,Reference Takeshita, Isobe, Sawayama and Niikura18 Gd2O3,Reference Wei, Chen, Cheng, Yin and Xu19 and Y2O3.Reference Wu, Liang, Chen, Liu and Li12,Reference Strel’tsov, Dmitrienko, Akmaeva, Kudryavstev, Dmitrienko and Razumov20,Reference Chan, Kang, Liu, Chen, Liu, Ding, Bao and Gao21 This is due to the Bi3+ 6 s2→6s6p excitation band, which can be used to harvest near-UV light.Reference Neeraj, Kijima and Cheetham22 In certain cases, the light yield improvement has surpassed 50%, compared with a monodoped sample.Reference Brusatin, Giustina, Guglielmi, Casalbomi, Prosposito, Schutzmann and Roma23
Finally, it is well known that the luminescent properties of nanoparticles strongly depend on the synthesis method,Reference Daldosso, Sokolnicki, Kepinski, Legendziewicz, Speghini and Bettinelli24 due to the fact that sol–gel methods offer considerable advantages such as good mixing, excellent chemical homogeneity, low aggregation, and spherical powders as well as the possibility of achieving several compositions.Reference Chen, Shi, Li, Wang, Chen and Shi25,Reference Nedelec26 Indeed, they have been used to produce rare earth doped Lu2O3 nanopowders.Reference Hreniak, Zych, Kepinsky and Strek27,Reference Jung and Jun28 In this article, the sol–gel method has been used for the synthesis of Eu3+, Bi3+ codoped Lu2O3 powders, and to the best of our knowledge, this represents the first time that is reported for any preparation method. The structural and the luminescent properties, as functions of the temperature synthesis and Bi3+ content are presented and discussed.
II. EXPERIMENTAL DETAILS
Lu(NO3)3 (hydrate, 99.9% Alfa Aesar, Ward Hill, MA), Eu(NO3)3·6H2O (99.9%, Alfa Aesar), and Bi(NO3)3·5H2O (98%, Alfa Aesar) have been used as rare earth precursors. A 0.2 M Lu sol was first obtained by dissolving the metal salt in ethanol under magnetic stirring for 2 h at 70 °C. An Eu3+ solution was prepared by dissolving the Eu salt in ethanol for 2 h at 60 °C (0.5 M), whereas the Bi nitrate was dissolved in a 50–50 diethyleneglycol (DEG) (99.8%, Alfa Aesar)–ethanol solution for 4 h at 80 °C (0.05 M). For a better doping control (2.5 at.% Eu3+, 0–3.0 at.% Bi+), an appropriate volume of the Eu and Bi solutions was incorporated into the Lu “sol.” Following this, the pH was adjusted with acetic acid (0.05 M), while the resulting “sol” was stirred for 2 h. The sol was stable for more than 50 days. To obtain the Lu2O3:Eu3+, Bi3+ nanopowders, the “sol” was dried at 100 °C for 24 h, following which the yielded xerogel was annealed at 600–900 °C for 1 h.
The IR spectra of samples were collected using Fourier transform infrared spectroscopy (FTIR 2000, Perkin Elmer, Waltham, MA) in the 3400–400 cm−1 range using the KBr pelleting technique. X-ray diffraction (XRD) patterns were obtained at room temperature on a powder diffractometer (Bruker D8Advance, Karlsruhe, Germany) using Cu Kα radiation (1.5418 Å). The morphology of the samples was analyzed using a JEM-2200FS (Tokyo, Japan) field-emission electron microscope operated at 200 keV. The luminescent properties were recorded by using a Spectra Pro fluorometer equipped with a R955 (Hammamatsu, Tokyo, Japan) at room temperature.
III. RESULTS AND DISCUSSION
A. Infrared analysis
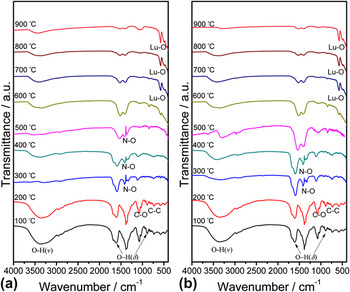
To determine the chemical evolution of the sol–gel process for the synthesis of Eu3+, Bi3+ codoped Lu2O3 powders were obtained, as were the Fourier transformed infrared spectra at different annealing temperatures (100–900 °C) of 2.5 Eu3+ at.%, X Bi3+ at.% (X = 1.0, 2.5) [Figs. 1(a) and 1(b), respectively]. As can be observed, for the xerogel dried at 100 °C, there was a strong presence of the OH− group, which is due to the presence of water and alcohol groups, characterized for the bands at 3400 cm−1 (ν), 1650 cm−1 (δ), and 750 cm−1 (δ), ascribed to the O–H stretching (ν) and deformation (δ) vibrations. Indeed, since its occurrence remained until 900 °C, it is possible to assume that this group is trapped structurally in the host. However, as can be observed, this OH− up to 100 and 200 °C had strong absorption bands at 1090 and 850 cm−1, which can be attributed to a symmetrical stretching of C–O and deformation vibrations of C–O in CO32− respectively. This stretching and vibration is brought about by the thermal decomposition of the carbon groups of acetic acid and DEG. Additionally, a small peak at 820–880, which is a characteristic of the C–C bond, can also be attributed particularly to the DEG decomposition.Reference Ksapabutr, Gulari and Wongkasemjit29 However, over 300 °C, all of these carbon-based bands were almost absent, thus eliminating the possibility of carbonates formation. On the other hand, the absorption band localized at 1380 cm−1 is ascribed to a N–O stretching vibrationReference Chi and Chuang30 of NO3−, which remained until 500 °C, whereas at 600 °C it was completely eliminated, indicating that beyond this temperature, only oxidized groups can be expected. Finally, the bands occurring at around 580 and 490 cm−1, observed from 600 °C, are attributed to the Lu–O stretching vibrations of cubic Lu2O3 (an Lu2O3 host lattice vibration).Reference McDevitt and Baun31 This indicates that its crystallization was just beginning at this annealing temperature as confirmed by XRD and HSTEM observations.
Infrared spectra of Lu2O3: 2.5 at.% Eu3+, X at.% Bi3+ nanopowders at different annealing temperatures: (a) X = 1.0, (b) X = 2.5.

B. Structural and morphological studies
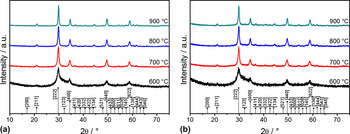
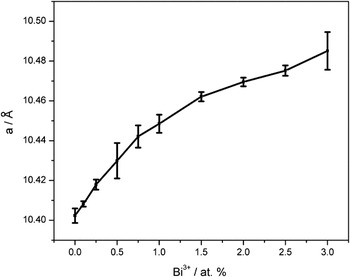
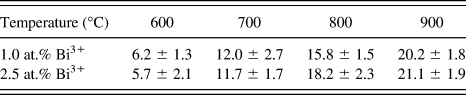
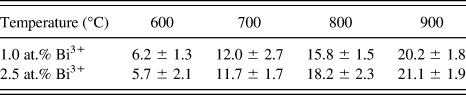
Figures 2(a) and 2(b) show the crystalline evolution of the Eu3+, Bi3+ codoped Lu2O3 powders at different annealing temperatures (600–900 °C) of 2.5 Eu3+ at.%, and two different Bi3+ at.% contents (1.0, 2.5), respectively. As observed for both samples, at 600 °C, the crystallization process occurred; however, a highly amorphous behavior remained. As the annealing temperature reached 700 °C, the nanopowders presented the cubic Lu2O3 structure (JCPDS 431021) with a spatial group Iā3 (lattice parameter 10.391 Å). It is important to note that the crystallization temperature was considerably lower than those reported (≈1100 °C) for solid-state reactions for Lu2O3 powders.Reference Zhang, Yang, Lu and Shi32,Reference Wang, Zhang and Wang33 Along with the increase of the annealing temperature up to 900 °C, the diffraction peaks became sharper, indicating that the crystallite size of the sample increases. There was no difference between both Bi3+ contents, since no other possible phases could be detected. The effect of the deformation of the lattice parameter as a function of the dopant ions, Eu3+ (2.5 at.%) and Bi3+ (0–3.0 at.%) is shown in Fig. 3. As observed, there was a slight increase for the monodoped sample, which increased from 10.402 to 10.481 Å at 2.5 at.% and resulted from the effect of the Bi3+ content. Table I shows the calculated crystallite sizes according to Scherer’s formula D = 0.9λ/β cosθ,Reference Cullity34 taking into account the broadening line of the diffracted peak, due to the effect of crystal size, where D is the crystal size of the powder, λ (0.15406 nm) is the wave length of the diffracted x-ray, β is the full-width radiation at half-maximum of the peak, and θ is the Bragg angle of the diffracted x-ray. The crystallite sizes varied from 6.2 ± 1.3 and 5.7 ± 2.1 nm at 600 °C to 20.2 ± 1.8 and 21.1 ± 1.9 nm at 900 °C for both Bi3+ contents. In light of this, there is no evidence of possible changes due to the composition in the crystal structure.
Structural evolution of Lu2O3: 2.5 at.% Eu3+, X at.% Bi3+ nanopowders as a function of the thermal treatment: (a) X = 1.0, (b) X = 2.5.

Lattice parameter of Lu2O3: 2.5 at.% Eu3+, X at.% Bi3+ (X = 0.0–3.0) nanopowders as a function of Bi3+ content.

Crystallite size as a function of heat treatment temperature.
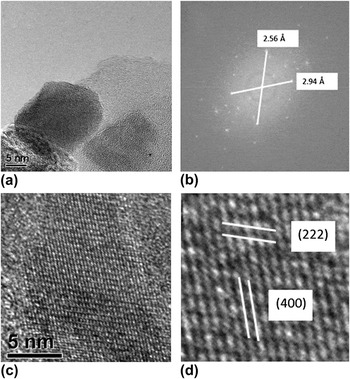
A TEM bright field micrograph of Lu2O3:Eu3+ 2.5 at.%, Bi3+ 1.0 at.% nanopowders annealed at 800 °C is shown in Fig. 4(a). As can be easily observed, the nanocrystallites presented a rounded morphology. The average size determined by the TEM observations was ≈20.2 nm, which is slightly higher than the XRD results. Figure 4(b) shows the HRTEM micrograph of a selected particle. The interplanar planes visible in the Eu3+, Bi3+ codoped Lu2O3 nanopowders were indexed by means of Fourier transform [Fig. 4(c)] to determine the interplanar distances, which were calculated as 2.94 and 2.56 Å, corresponding to the (222) and (400) planes, respectively [Fig. 3(d)], of the cubic Lu2O3 structure.
(a) TEM bright-field micrograph of Lu2O3:2.5 at.% Eu3+, 1.0 at.% Bi3+ nanopowders annealed at 800 °C, (b) HRTEM micrograph of a Lu2O3:2.5 at.% Eu3+, 1 at.% Bi3+ particle, (c) Fourier transform, and (d) (222) and (400) planes.

C. Luminescent properties
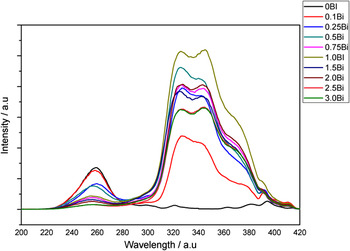
The evaluation of the luminescent properties was conducted on the Eu3+, Bi3+ codoped Lu2O3 nanopowders at a fixed Eu3+ level (2.5 at.%) and different Bi3+ levels (from 0.1 to 3.0 at.%) at different annealing temperatures (700–900 °C). Figure 5 shows the excitation spectra (611 nm) of the samples annealed at 900 °C with different Bi3+ doping levels. As can be observed, the common band was present from 230 to 270 nm, corresponding to the Eu3+–O2− charge-transfer transition, as well as the 7F0 → 5L6 (395 nm), 7F0 → 5D2 (410 nm),Reference Zhang, Chen and Guo6,Reference Liu, Li, Xie, Hirosaki, Xu and Huang35,Reference Wang, Zhang, Lin, Baogui, Yibing and Min36 and 7F0 → 5D3 (412 nm)Reference Hreniak, Zych, Kepinsky and Strek27,Reference Takeshita, Isoha, Sawayama and Nikura37 transitions of Eu3+ in a Lu2O3 matrix. In addition to this, a strong broad band was observed in the range of 300–380 nm, which can be attributed to the 1S0 → 3P1 transitions of the Bi3+,Reference Real, Vallet, Flament and Schamps38 at the C2 site.Reference Jacobsohn, Blair, Tornga, Brown, Bennett and Muenchansen39 It can be observed that this absorption band increased with the increase of Bi3+ concentration, showing maximum efficiency at the 1.0 at.% doping level.
Excitation spectra (λem = 611 nm) of Lu2O3: 2.5 at.% Eu3+, X at.% Bi3+ (X = 0.1–3.0) nanopowders.

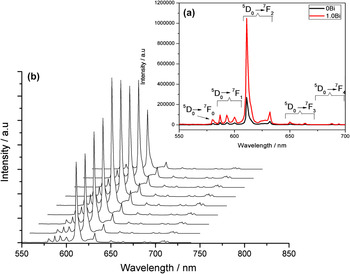
The emission spectra of Eu3+, Bi3+ codoped Lu2O3 nanopowders excited at 323 nm are shown in Fig. 6(a) for a monodoped sample (Eu3+ 2.5 at.%) and 1.0 Bi3+ at.% codoped sample, both annealed at 900 °C. As can be observed, the results presented the typical luminescence spectrum of Eu3+ ions in the cubic Lu2O3 host lattice, consisting of a group of five sharp peaks from 570 to 715 nm, ascribed to the 5D0→7FJ (J = 0, 1, 2, 3, 4) transitions of the Eu3+ ion. The most intense line, around 611 nm, corresponded to the transition of the 5D0 → 7F2 level of the Eu3+ ion, occupying the C2 sites in the Lu2O3 host cubic lattice. Additionally, there were minor emission lines corresponding to the 5D0 → 7F0 (≈585 nm), 5D0 → 7F1 (≈589, ≈595, and ≈601 nm), 5D0 → 7F3 (≈651 and ≈664 nm), and 5D0 → 7F4 (≈690 and ≈695 nm) transitions. This predominant 611 nm Eu3+ emission, could be apparently caused by the population of split terms 7F2,3,4 of the Eu3+ ion, which results from the change in its crystallographic surrounding upon penetration of Bi3+ ions into the matrix lattice; this has already been seen in a Y2O3 codoped matrix.Reference Strel’tsov, Dmitrienko, Akmaeva, Kudryavstev, Dmitrienko and Razumov20 It is important to note that the intensity of the codoped sample was nearly 400% higher than for the monodoped sample, thus indicating that a significant energy transfer process occurred between Bi3+ and Eu3+. This means that Bi3+ presents a sensitizer character of Eu3+.
(a) Emission spectra (λexc = 323 nm) of Lu2O3: 2.5 at.% Eu3+, 1.0 at.% Bi3+. (b) Emission spectra (λexc = 323 nm) of Lu2O3: 2.5 at.%Eu3+, X at.% Bi3+ (X = 0.0–3.0) nanopowders annealed at 900 °C, as a function of the Bi3+ at.% content.

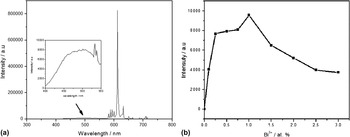
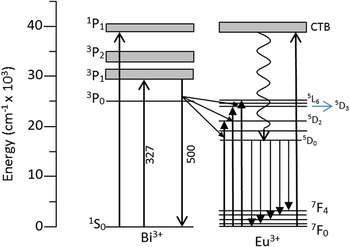
Figure 6(b) shows the influence of Bi3+ concentration in the luminescence spectra, monitoring the 611 nm Eu3+ emission. As observed, all the samples presented the same characteristics of the previous analysis, while it is stated that the intensity is highly dependent on the Bi3+ doping level. With the increase of the Bi3+ content, the emission intensity of the 611 nm peak increased rapidly until 1.0 at.%. Above this concentration, the intensity diminished. The same results were observed for the excitation spectra shown in Fig. 5. On the other hand, Fig. 7 presents the emission spectra of the same 1.0 at.% Bi3+ sample, in a broader range (300–800 nm) thus making it possible to observe the bluish emission lines (3P1→1S0) of Bi3+ in the range from 400 to 600 nm. The intensity of this emission is insignificant compared with the Eu3+ reddish emission; the inset shows an enlarged view of the Bi3+ emission, as well as the dependence of this light yield function on the Bi3+ content. However, this emission range overlapped the 7F0 → 5L6 (395 nm), 7F0 → 5D2 (466 nm) Eu3+, and 7F0 → 5D3 excitation bands, and therefore an energy transfer process occurred from Bi3+ to Eu3+ in the Lu2O3 codoped nanopowders, with a similar mechanism stated for Y2O3Reference Wu, Liang, Chen, Liu and Li12 and Gd2O3.Reference Dhananjay, Nagabhushana, Nagabhushana, Sharma, Rudraswamy, Suriyamurthy, Shivakumara and Chakradhar40 The proposed energy transfer processes and luminescence mechanism between Bi3+ and Eu3+ in Bi3+, Eu3+ codoped Lu2O3 are shown in Fig. 8. First, the phosphors were excited at 330 nm, where the Bi3+ ion absorbed the energy according to the 1S0→3P1 Bi3+ transition. Later, the Bi3+ ions released the energy radiatively to the Eu3+ ions. Indeed, according to 7F0 → 5L6, 7F0 → 5D2, and 7F0 → 5D3, Eu3+ emits light by the predominant 5D0 → 7F2 transition.
(a) Enlarged view of the emission spectra (λexc = 323 nm) of Lu2O3: 2.5 at.% Eu3+, 1.0 at.% Bi3+ nanopowders, at the Bi3+ bluish emission, (b) Light yield of the Bi3+ emission as a function of the Bi3+ at.% content.

The luminescence and energy transfer processes of Eu3+ and Bi3+ in Lu2O3: Eu3+, Bi3+ nanopowders.

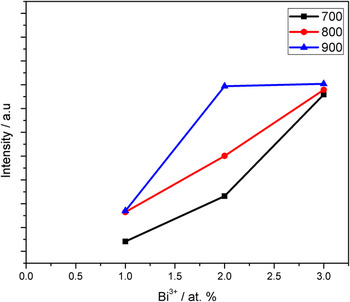
Finally, Fig. 9 shows the relative intensity of the 5D0 → 7F2 emission at 611 nm as a function of the doping content and the annealing temperature. As observed, since at 700 °C the nanopowders presented a complete crystallization of the cubic structure, the increase in the emission intensity can be explained in terms of a better crystal refinement as a consequence of the thermal process. It may have also been due to the high temperature of the organic molecules present in samples, which are remnants of the solvents used during the sol–gel process. In addition, the specific removal of hydroxyl groups OH− [Figs. 1(a) and 1(b)] increases the emission intensity since it acts like a quencher group which promotes nonradiative process in comparison to the radiative one.Reference Yulia, Yermolayeva, Tolmachev, Dobrotvorskaya and Vovk41,Reference Phaomei, Singh, Singh and Ningthoujam42 The same conclusions can be obtained by analyzing the effect of the Bi3+ content, since at the three annealing temperatures the same behavior was observed for 900 °C with the maximum peak at 1.0 Bi3+ at.%. However, the differences between the different annealing temperatures in the light yield temperatures were not significant.
Emission intensity (λexc = 323 nm, λem = 611 nm) of Lu2O3: 2.5 at.% Eu3+, 1.0 at.% Bi3+ powders as a function of the Bi3+ content and the annealing temperature.

IV. CONCLUSIONS
Eu3+, Bi3+ codoped Lu2O3 nanopowders were successfully prepared from metal nitrates as precursors, following a sol–gel procedure, in the presence of ethanol as the main solvent. The results showed that it is necessary to anneal the xerogel up to 600 °C to promote the crystallization of the cubic phase. However, to obtain a perfect structure, the codoped Lu2O3 nanopowders must be annealed up to 700 °C. The obtained crystallite sizes ranged from 60.2 to 20.2 nm in a Eu3+ 2.5 at.%, Bi3+ 1.0 at.% samples. The light yield intensity of the nanopowders monitoring the 611 nm 5D0 → 7F2 Eu3+ emission was greatly improved by codoping with Bi3+, with an optimal concentration of Bi3+ 1.0 at.%. This was almost 400% higher than the monodoped sample, under the excitation of UV light ranging from 300 to 380 nm. Finally, it was observed that the Bi3+ ions act like sensibilizers of the Eu3+ ion via an efficient energy transfer process.
ACKNOWLEDGMENTS
The authors gratefully acknowledge the financial support of this work by the SEP-CONACYT projects 100764, 136219 and 178817.