1. Introduction
1.1. In Parts 1 and 2 of this series of papers (Wilkie et al., Reference Wilkie, Sahin, Cairns and Kleinow2011; Wilkie & Sahin, Reference Wilkie, Waters and Yang2016), we updated the Wilkie model (see Wilkie 1986 and Wilkie 1995) to 2009 and described several aspects of using such an annual model. In Part 3 we turn to considering ways to make the model applicable to shorter time steps by stochastic interpolation between the points of a stochastically generated annual model. Because this turns out to be a long subject, Part 3 is divided into three papers: this part (Part 3A) which describes the algebra of discrete Brownian bridges and Ornstein–Uhlenbeck (OU) bridges; Part 3B which describes their application to the models for retail prices and for wages in the Wilkie model; and Part 3C which describes their application to the other elements of the Wilkie model, share yields, and dividends and interest rates.
1.2. Our overall approach is that we assume that some stochastic economic model, such as the original Wilkie model or some other economic scenario generator, is defined at first only for steps at annual (or other discrete) intervals, and that we desire to use the model to simulate values of the variables at more frequent intervals, such as monthly, with n shorter periods in one longer period. We refer to the longer and shorter periods as “years” and “months”, but they could be any longer periods and any shorter periods. The shorter periods are assumed to be the same size within any one longer period, but the methods would work equally well with longer periods of different sizes, and with different numbers of shorter periods in each. However, in all our examples we assume natural years and months and put n=12 in numerical work, though we keep n in the formulae.
1.3. The practical motivation for this approach is to enable certain useful applications to be implemented. For example, life insurance companies may write unit-linked life policies and pension contracts with monthly premiums, invested in the units of some fund. They may have a model that gives values of certain economic variables at annual intervals, and they may wish to use the same model for investigating features of the monthly premium policies, fitting the monthly values into the same annual simulations.
1.4. An alternative approach would be to use a monthly model in the first place. It is quite practicable for some models to do this, but a monthly model that replicates exactly the properties of the annual Wilkie model is rather difficult to find, and we do not pursue that route here.
1.5. Brownian bridges go back at least to Karatzas & Shreve (Reference Karatzas and Shreve1991) if not earlier, and they are so straightforward to apply discretely that others may well have used them without anyone having published their algebra precisely. The oldest references we can find to discrete Ornstein-Uhlenbeck bridges are in Wilkie et al. (Reference Wilkie, Owen and Waters2003) and Wilkie et al. (Reference Wilkie and Sahin2005), which one of us was also involved in. In the former paper, the authors observed that they had not seen previous reference to OU bridges, and the term was a new coinage for them (though an obvious one). Further investigations can take us back at least to Simão (Reference Simao1996) and Maslowski & Simão (Reference Maslowski and Simão1997, Reference Maslowski and Simão2001). But none of these or any other authors discuss how to construct discrete bridges, so that we get no help from them. Instead, we have to start ourselves from first principles and derive the necessary results.
1.6. In this paper, we therefore introduce what we need for the mathematical properties of discrete Brownian and OU bridges, using no more than straightforward algebra. Since we work discretely we do not need the properties of continuous stochastic processes. Our approach is different from that of most authors on the subject, though our results, where they correspond, are consistent with theirs.
1.7. In section 2 of this paper we describe the basic ways of doing stochastic interpolation by familiar Brownian bridges. In section 3 we discuss the rather less familiar OU bridges. In section 4 we note what some other authors have written on stochastic bridges, and in section 5 we compare our method with that of Glasserman (Reference Glasserman2003). In section 6 we discuss mixed models. We give some numerical results in section 7, and in section 8 we introduce our methods for analysing real data, which are discussed much more fully in Parts 3B and 3C.
2. The Brownian bridge
2.1. In this section, we describe some of the properties of discrete Brownian bridges and our method of construction of simulations of them. The Brownian bridge is familiar in the literature, and is usually treated as a continuous process. Many of the properties of a discrete bridge correspond with those of the continuous one, but there are some properties peculiar to the discrete bridge. We discuss the approach of other authors in section 4. In particular, Glasserman (Reference Glasserman2003) describes how to construct Brownian bridges, but uses a different methodology. We compare our approach with his in section 5. We restrict ourselves to the practical aspects of these bridges, which do not seem to have been so well developed, or at least do not seem to have been published.
2.2. We call our longer periods “years” and our shorter ones “months”, as noted in section 1.2. We denote month j in year t by (t, j), j=0 to n, overlapping so that (t, n)=(t+1, 0). The principle of our simulated Brownian bridge over year t is that out of all possible paths generated by a discrete monthly random walk, from (t, 0) to (t+1, 0) starting at X(t, 0)=X 0, we select only the subset of paths that end at a particular value of X(t+1, 0)=X(t, n), denoted X n . This subset contains all possible discrete Brownian bridges between these end points. For simulation we then select one of those bridges at random.
2.3. We start by postulating a monthly random walk starting at time (0, 0) with value X(0, 0), and moved forward month by month by the relation
 $$X\left( {t,\,j} \right)\,{\equals}\,X\left( {t,\,j-{\rm 1}} \right){\plus}\mu {\plus}\sigma .Z\left( {t,\,{\rm }j} \right)$$
with Z(t, j) distributed N(0, 1), and with monthly parameters, the mean, μ, and standard deviation, σ, assumed constant. The value of X(0, j) is given by
 $$X\left( {{\rm 0},\,j} \right)\,{\equals}\,X\left( {{\rm 0},\,{\rm 0}} \right){\plus}j.\mu {\plus}\sigma .\mathop{\sum}\limits_{k\,{\equals}\,{\rm 1},j} {Z\left( {{\rm 0},\,k} \right)} $$
so
 $$X\left( {{\rm 0},\,n} \right)\,{\equals}\,X\left( {{\rm 0},\,{\rm 0}} \right){\plus}n.\mu {\plus}\sigma .\mathop{\sum}\limits_{j\,{\equals}\,{\rm 1},n} {Z\left( {{\rm 0},\,j} \right)} $$
Then E[X(0, n)]=X(0, 0)+n.μ and Var[X(0, n)]=n.σ 2. Assume now that we fix X(0, n) at some chosen value, X n . We may have used one path to reach X n , but our possible Brownian bridges include all the other possible paths that reach the same end value X n .
2.4. As an alternative route we assume that we simulate values using an annual random walk to give values of X(t, 0) at successive years (t, 0) by
 $$X\left( {t,\,{\rm 0}} \right)\,{\equals}\,X\left( {t-{\rm 1},\,{\rm 0}} \right){\plus}\mu _{y} {\plus}\sigma _{y} .Z\left( {t,\,{\rm 0}} \right)$$
where the yearly parameters are μ y =n.μ and σ y 2=n.σ 2. If X(0, 0) is the same as in the monthly model, then X(1, 0) in the annual model has the same distribution as X(0, n) in the monthly model.
2.5. We now wish to interpolate between the annual values over the n−1 intervening months of each year. We consider year t from (t, 0) to (t, n). All the other years are dealt with in the same way. We denote the initial value in the year X(t, 0) as X 0 and the final value in the year, X(t+1, 0)=X(0, n) as X n .
2.6. We now postulate that we can construct the required Brownian bridge as follows. We define
 $$\lambda \left( t \right)\,{\equals}\,{{\left( {X_{n} -X_{{\rm 0}} } \right)} \mathord{\left/ {\vphantom {{\left( {X_{n} -X_{{\rm 0}} } \right)} n}} \right. \kern-\nulldelimiterspace} n}$$
and we generate n random unit values Z(t, j) for j=1 … n. We modify these by putting
 $$Z^{{\asterisk}} \left( {t,\,j} \right)\,{\equals}\,Z\left( {t,\,j} \right)-{{\left( {\mathop{\sum}\limits_{j\,{\equals}\,{\rm 1},n} {Z\left( {t,\,j} \right)} } \right)} \mathord{\left/ {\vphantom {{\left( {\mathop{\sum}\limits_{j\,{\equals}\,{\rm 1},n} {Z\left( {t,\,j} \right)} } \right)} n}} \right. \kern-\nulldelimiterspace} n}$$
Then we calculate X(t, j)=X(t, j−1)+λ(t)+σ.Z*(t, j). By successive application of this relation we get
 $$X\left( {t,\,j} \right)\,{\equals}\,X_{{\rm 0}} {\plus}j.\lambda \left( t \right){\plus}\sigma \mathop{\sum}\limits_{k\,{\equals}\,{\rm 1},j} {Z^{{\asterisk}} \left( {t,\,k} \right)} $$
We show in Appendix A2.1 that ∑ j=1,n Z*(t, j)=0, E[Z*(t, j)]=0, Var[Z*(t, j)]=(n−1)/n, Covar[Z*(t, j), Z*(t, k)]=−1/n if j≠k and the correlation coefficient for all j and k in the same year CC[Z*(t, j), Z*(t, k)]=−1/(n−1). We get from successive application of this recursion
 $$\eqalignno{ X\left( {t,\,n} \right)\,&{\equals}\, X_{{\rm 0}} {\plus}n.\lambda \left( t \right){\plus}\sigma \mathop{\sum}\limits_{j\,{\equals}\,{\rm 1},n} {Z^{{\asterisk}} \left( {t,\,j} \right)} \,\cr&{\equals}\, X_{{\rm 0}} {\plus}n.\left( {X_{n} -X_{{\rm 0}} } \right)\,/\,n{\plus}{\rm 0} \,\cr &{\equals}X_{n} $$
This confirms that our postulated method ends at the right place.
2.7. For each value of the monthly series we can define three expected values with corresponding variances. The first expected value is
 $$E_{{\rm 1}} X\left( {t,\,j} \right)\,{\equals}\,E\left[ {X\left( {t,\,j} \right)\!\mid\!X\left( {t,\,{\rm 0}} \right)\,{\equals}\,X_{{\rm 0}} \,{\rm and}\,X\left( {t,\,n} \right)\,{\equals}\,X_{n} } \right]$$
i.e. E 1 X(t, j) is conditional on knowing the values of the end points X(t, 0) and X(t, n). Its value is E 1 X(t, j)=X 0+j.λ(t) and E 1[X(t, n)]=X 0+n.λ(t)=X n . We define “sideways deviations” for j=0 to n as Ds(t, j)=X(t, j)−E 1 X(t, j), giving
 $$\eqalignno{ Ds\left( {t,\,j} \right)\,&{\equals}\, X_{{\rm 0}} {\plus}j.\lambda \left( t \right){\plus}\sigma \mathop{\sum}\limits_{k\,{\equals}\,1,j} {Z^{{\asterisk}} \left( {t,\,k} \right)} -X_{{\rm 0}} -j.\lambda \left( t \right) \,\cr &{\equals}\, \, \sigma \mathop{\sum}\limits_{k\,{\equals}\,{\rm 1},j} {Z^{{\asterisk}} \left( {t,\,k} \right)} $$
Hence E[Ds(t, j)]=0. After some calculation (see Appendix A2.2) we get
 $${\rm Var}\left[ {Ds\left( {t,\,j} \right)} \right]\,{\equals}\,j\left( {{\rm 1}-{j \mathord{\left/ {\vphantom {j n}} \right. \kern-\nulldelimiterspace} n}} \right).\sigma ^{{\rm 2}} $$
and for j≤k
 $${\rm Covar}\left[ {Ds\left( {t,\,j} \right),\,Ds\left( {t,\,k} \right)} \right]\,{\equals}\,j\left( {{{{\rm 1}-k} \mathord{\left/ {\vphantom {{{\rm 1}-k} n}} \right. \kern-\nulldelimiterspace} n}} \right).\sigma ^{2} $$
We define the “sideways deviation ratio” as rs(j)=
 $$\sqrt{ \{{j} \,(1-j/n)\}},$$
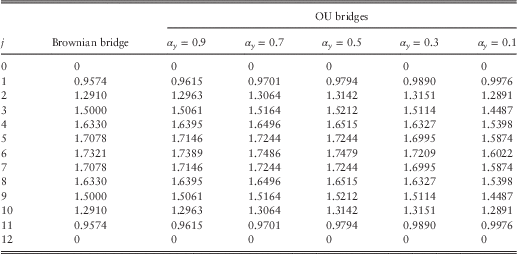
, the same for all values of t, so that SD[Ds(t, j)]=rs(j). σ. The function rs(j) rises and falls symmetrically over the year, with zero for both j=0 and j=n. We show the values of these sideways deviation ratios, rs(j), for n=12 in Table 1 (see section 7).
Sideways deviation ratios, rs j , for Brownian and OU bridges, with n=12 and for OU bridges with α y =0.9, 0.7, 0.5, 0.3 and 0.1.

2.8. The second expected value for X(t, j) is conditional on knowing also the value of the preceding term, X(t, j−1). So
 $$\eqalignno{ E_{{\rm 2}} X\left( {t,\,j} \right)\,{\equals}\, & E\left[ {X\left( {t,\,j} \right)\,\mid\,X\left( {t,\,{\rm 0}} \right)\,{\equals}\,X_{{\rm 0}} \,{\rm and}\,X\left( {t,\,n} \right)\,{\equals}\,X_{n} \,{\rm and}\,{\rm the}\,{\rm value}\,{\rm of}\,X\left( {t,\,j-{\rm 1}} \right)} \right] \cr X\left( {t,\,j} \right)\,{\equals}\, & X\left( {t,\,j-{\rm 1}} \right){\plus}\lambda \left( t \right){\plus}\sigma .Z^{{\asterisk}} \left( {t,\,j} \right) \cr {\rm so}\quad E_{{\rm 2}} X\left( {t,\,j} \right)\,{\equals}\, & X\left( {t,\,j-{\rm 1}} \right){\plus}\lambda \left( t \right) $$
We then define “forwards deviations” for j=1–n, Df(t, j)=X(t, j)−E 2 X(t, j)
 $$\eqalignno{ Df\left( {t,\,j} \right)\,& {\equals}\, X\left( {t,\,j-{\rm 1}} \right){\plus}\lambda \left( t \right){\plus}\sigma .Z^{{\asterisk}} \left( {t,\,j} \right)-X\left( {t,\,j-{\rm 1}} \right)-\lambda \left( t \right) \, \cr &{\equals}\, \, \sigma .Z^{{\asterisk}} \left( {t,\,j} \right) $$
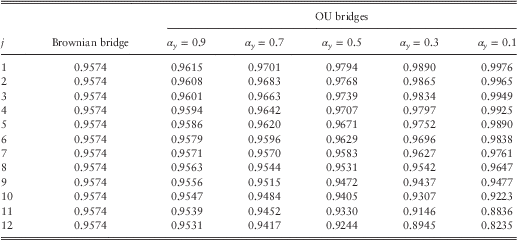
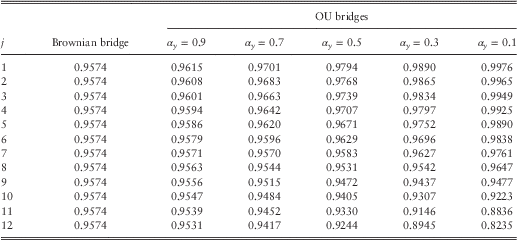
We then have E[Df(t, j)]=0, Var[Df(t, j)]=(1−1/n).σ 2 (see Appendix A2.3). We define “forwards deviation ratios”, rf(j), as √(1−1/n) so that SD[Df(t, j)]=rf(j). σ. Although these are constant for all j for the Brownian bridge, they turn out not to be so for the OU bridge, so we keep the index j. In addition, the sum of the forwards deviations equals 0, Σ i=1,n Df(t, i)=0, with certainty (see Appendix A2.4). We show the values of the forwards deviation ratios, rf(j), for n=12 in Table 2 (see section 7).
Forwards deviation ratios, rf j , for Brownian and OU bridges, with n=12 and for OU bridges with α y =0.9, 0.7, 0.5, 0.3 and 0.1.
Further, for all j and k, j≠k
 $${\rm Covar}\left[ {Df\left( {t,\,j} \right),Df\left( {t,\,k} \right)} \right]\,{\equals}\,{{-\sigma ^{{\rm 2}} } \mathord{\left/ {\vphantom {{-\sigma ^{{\rm 2}} } n}} \right. \kern-\nulldelimiterspace} n}$$
so that the correlation coefficient between any Df(t, j) and any other Df(t, k) (in the same year) equals −1/(n−1). Observe that if n=2, so that there are only two steps, then necessarily Df 2=−Df 1 and the correlation coefficient between them is −1. We also observe that Df(t, 1)=Ds(t, 1) and that Df(t, n−1)=−Ds(t, n−1), so their variances are the same.
2.9. For the third expected value we step back and assume that we do not know the value of X(t, n), but only successive values of X(t, j). Then
 $$X\left( {t,\,j} \right)\,{\equals}\,X\left( {t,\,j-{\rm 1}} \right){\plus}\lambda \left( t \right){\plus}\sigma .Z^{{\asterisk}} \left( {t,\,j} \right)$$
We note that λ(t)=(X n −X 0)/n=(µ y +σ y .Z(t))/n=µ+σ y .Z(t)/n, which is now stochastic. Then we define a third expected value for X(t, j) as conditional on knowing only the value of the preceding term, X(t, j−1)
 $$E_{{\rm 3}} X\left( {t,\,j} \right)\,{\equals}\,E\left[ {X\left( {t,\,j} \right)\!\mid\!X\left( {t,\,j-{\rm 1}} \right)} \right]\,{\equals}\,X\left( {t,\,j-{\rm 1}} \right){\rm }{\plus}\mu _{m} $$
We then define a third deviation term, Du(t, j), the “unconstrained deviation”, Du(t, j)=X(t, j)−E 3 X(t, j)=σ y .Z(t)/n+σ.Z*(t, j), so that E[Du(t, j)]=0 and (see Appendix A2.5) we have Var[Du(t, j)]=σ 2 and Covar[Du(t, j), Du(t, k)]=0, j≠k, all as we would expect for a monthly random walk. The deviations are conditional on knowing X(t, j−1), so they are not the overall unconditional values for the whole series.
2.10. This final result confirms that our method of construction of a Brownian bridge postulated in section 2.6 does have the same properties as a random walk conditional only on the starting value at time (0, 0). This is fairly obvious for the Brownian bridge, but not for the OU bridge, as we see in section 3.7.
2.11. We assumed in section 2.3 that Z(t, j) was normally distributed. It would need to be if we wished to replicate the equivalent of continuous Brownian motion, but in our case it is not essential, so long as E[Z(t, j)]=0 and Var[Z(t, j)]=1. We also assumed that the monthly mean, μ, and the standard deviation, σ, remained constant. They need to be if we wish to replicate a random walk with fixed parameters, but we see that μ does not come into our bridge construction, for which we use the local mean for year t, λ(t), which varies from year to year. But it is also possible for σ to vary from year to year as σ(t), and we find empirically that it does so for the data we investigate. We describe this further in section 8.5.
2.12. We can also allow the annual values X(t, 0) to be generated by some other annual model, not necessarily connected with the monthly random walk. This turns out to be appropriate for many of the variables in the Wilkie model, which are generated annually by more complicated models. The construction of the Brownian bridge is not affected, since the local mean λ(t) is derived from the observed annual values, but we need to postulate some value for σ(t), which for the series we investigate we get from the observed monthly data.
3. The Ornstein-Uhlenbeck Bridge
3.1. The continuous Ornstein-Uhlenbeck process corresponds in discrete time with a first-order autoregressive, AR(1), model. As for the Brownian bridge, we start by postulating a monthly model, this time an AR(1) model, starting at time (0, 0) with value X(0, 0) and with the monthly relation
 $$X\left( {t,\,j} \right)\,{\equals}\,\mu {\plus}\alpha \left( {X\left( {t,\,j-{\rm 1}} \right)-\mu } \right){\plus}\sigma .Z\left( {t,\,j} \right)$$
with Z(t, j) distributed N(0, 1), and with the three constant monthly parameters μ, α and σ. The value of X(t, n) is given by
 $$X\left( {t,\,n} \right)\,{\equals}\,\mu {\plus}\alpha ^{n} \left( {X\left( {t,\,{\rm 0}} \right)-\mu } \right){\plus}\sigma .\mathop{\sum}\limits_{j\,{\equals}\,{\rm 1},n} {\left\{ {\alpha ^{{n-j}} \,Z\left( {t,\,j} \right)} \right\}} $$
3.2. The corresponding annual model, also AR(1), is
 $$X\left( {t,\,{\rm 0}} \right)\,{\equals}\,\mu _{y} {\plus}\alpha _{y} .\left( {X\left( {t-{\rm 1},\,{\rm 0}} \right)-\mu _{y} } \right){\plus}\sigma _{y} .Z\left( t \right)$$
where μ y =μ, α y =α n and σ y 2=σ 2.(1−α y 2)/(1−α 2). The annual model has the same distribution at the yearly points as the monthly model.
3.3. We now postulate that we can interpolate over the yearly points with a corresponding monthly model in the following way. We assume that the value of X(t, 0) is X 0 and that of X(t, n) is X n . We define
 $$s_{j} \,{\equals}\,\mathop{\sum}\limits_{i\,{\equals}\,{\rm 1},j} {\alpha ^{{{\rm 2}(i-{\rm 1})}} } \,{\equals}\,{\rm 1}{\plus}\alpha ^{{\rm 2}} {\plus}\,\ldots\,{\plus}\alpha ^{{{\rm 2}(j-{\rm 1})}} \,{\equals}\,{{\left( {{\rm 1}-\alpha ^{{{\rm 2}j}} } \right)} \mathord{\left/ {\vphantom {{\left( {{\rm 1}-\alpha ^{{{\rm 2}j}} } \right)} {\left( {{\rm 1}-\alpha ^{{\rm 2}} } \right)}}} \right. \kern-\nulldelimiterspace} {\left( {{\rm 1}-\alpha ^{{\rm 2}} } \right)}}$$
and then
 $$\lambda \left( t \right)\,{\equals}\,{{\left\{ {X_{n} -\mu -\alpha ^{n} \left( {X_{{\rm 0}} -\mu } \right)} \right\}} \mathord{\left/ {\vphantom {{\left\{ {X_{n} -\mu -\alpha ^{n} \left( {X_{{\rm 0}} -\mu } \right)} \right\}} {s_{n} }}} \right. \kern-\nulldelimiterspace} {s_{n} }}$$
Next we generate n random unit normal values Z(t, j), j=1 … n, and modify these by putting
 $$Z^{{\asterisk}} \left( {t,\,j} \right)\,{\equals}\,Z\left( {t,\,j} \right)-\alpha ^{{n-j}} {{\left\{ {\mathop{\sum}\limits_{i\,{\equals}\,{\rm 1},n} {\alpha ^{{n-i}} .Z\left( {t,\,i} \right)} } \right\}} \mathord{\left/ {\vphantom {{\left\{ {\mathop{\sum}\limits_{i\,{\equals}\,{\rm 1},n} {\alpha ^{{n-i}} .Z\left( {t,\,i} \right)} } \right\}} {s_{n} }}} \right. \kern-\nulldelimiterspace} {s_{n} }}$$
We show in Appendix A3.1 that ∑ j=1,n {α n−j .Z*(t, j)}=0, E[Z*(t, j)]=0, Var[Z*(t, j)]=1−α 2(n−j)/s n and Covar[Z*(t, j), Z*(t, k)]=−α n−j α n−k /s n for any j≠k in the same year t.
3.4. We then generate a possible bridge by putting
 $$\eqalignno{ X\left( {t,\,j} \right)\,{\equals}\, & \mu {\plus}\alpha \left( {X\left( {t,\,j-{\rm 1}} \right)-\mu } \right){\plus}\alpha ^{{n-j}} .\lambda \left( t \right){\plus}\sigma .Z^{{\asterisk}} \left( {t,\,j} \right) \cr \,{\equals}\, & \mu {\plus}\alpha ^{j} \left( {X_{{\rm 0}} -\mu } \right){\plus}\mathop{\sum}\limits_{i\,{\equals}\,{\rm 1},j} {\alpha ^{{j-i}} \alpha ^{{n-i}} .\lambda \left( t \right)} {\plus}\sigma .\mathop{\sum}\limits_{i\,{\equals}\,{\rm 1},j} {\alpha ^{{j-i}} .Z^{{\asterisk}} \left( {t,\,i} \right)} $$
So
 $$\eqalignno{ X\left( {t,\,n} \right)\,{\equals}\, & \mu {\plus}\alpha ^{n} \left( {X_{{\rm 0}} -\mu } \right){\plus}\mathop{\sum}\limits_{i\,{\equals}\,{\rm 1},n} {\alpha ^{{{\rm 2}(n-i)}} .\lambda \left( t \right)} {\plus}\sigma \,\mathop{\sum}\limits_{i\,{\equals}\,{\rm 1},n} {\alpha ^{{n-i}} .Z^{{\asterisk}} \left( {t,\,i} \right)} \cr &\hskip-9pt{\equals}\, \mu {\plus}\alpha ^{n} \left( {X_{{\rm 0}} -\mu } \right){\plus}s_{n} .\lambda \left( t \right){\plus}{\rm 0} \cr &\hskip-9pt{\equals}\, \mu {\plus}\alpha ^{n} \left( {X_{{\rm 0}} -\mu } \right){\plus}X_{n} -\mu -\alpha ^{n} \left( {X_{{\rm 0}} -\mu } \right) \cr &\hskip-9pt{\equals}\, X_{n} $$
so that we do indeed bridge the space from X 0 to X n .
3.5. As with the Brownian bridge we can calculate three expected values of the monthly series. The first gives (see Appendix A3.2)
 $$\eqalignno{ E_{{\rm 1}} X\left( {t,\,j} \right)\,{\equals}\, & E\left[ {X\left( {t,\,j} \right)\!\mid\!X\left( {t,\,{\rm 0}} \right)\,{\equals}\,X_{{\rm 0}} \,{\rm and}\,X\left( {t,\,n} \right)\,{\equals}\,X_{n} } \right] \cr \,{\equals}\, & \mu {\plus}\alpha ^{j} \left( {X_{{\rm 0}} -\mu } \right){\plus}\mathop{\sum}\limits_{i\,{\equals}\,1,j} {\alpha ^{{j-i}} .\alpha ^{{n-i}} .\lambda \left( t \right)} \cr \,{\equals}\, & \mu {\plus}{{\left\{ {\left( {X_{{\rm 0}} -\mu } \right).\alpha ^{j} .\left( {{\rm 1}-\alpha ^{{{\rm 2}(n-j)}} } \right){\plus}\left( {X_{n} -\mu } \right).\alpha ^{{n-j}} .\left( {{\rm 1}-\alpha ^{{{\rm 2}j}} } \right)} \right\}} \mathord{\left/ {\vphantom {{\left\{ {\left( {X_{{\rm 0}} -\mu } \right).\alpha ^{j} .\left( {{\rm 1}-\alpha ^{{{\rm 2}(n-j)}} } \right){\plus}\left( {X_{n} -\mu } \right).\alpha ^{{n-j}} .\left( {{\rm 1}-\alpha ^{{{\rm 2}j}} } \right)} \right\}} {\left( {{\rm 1}-\alpha ^{{{\rm 2}n}} } \right)}}} \right. \kern-\nulldelimiterspace} {\left( {{\rm 1}-\alpha ^{{{\rm 2}n}} } \right)}} $$
Again E 1 X(t, 0)=X(t, 0) and E 1 X(t, n)=X(t, n)=X(t+1, 0) with certainty. The sideways deviations, Ds(t, j)=X(t, j)−E 1 X(t, j)=σ.Σ i=1,j α j−i .Z*(t, i), have expected values zero but the variances and covariances are more complicated than that for the Brownian bridge and are (see Appendix A3.3)
 $$\eqalignno{ & {\rm Var}\left[ {Ds\left( {t,\,j} \right)} \right]\,{\equals}\,{{\left\{ {\left( {{\rm 1}-\alpha ^{{{\rm 2}j}} } \right).\left( {{\rm 1}-\alpha ^{{{\rm 2}(n-j)}} } \right)} \right\}} \mathord{\left/ {\vphantom {{\left\{ {\left( {{\rm 1}-\alpha ^{{{\rm 2}j}} } \right).\left( {{\rm 1}-\alpha ^{{{\rm 2}(n-j)}} } \right)} \right\}} {\left\{ {\left( {{\rm 1}-\alpha ^{2} } \right).\left( {{\rm 1}-\alpha ^{{{\rm 2}n}} } \right)} \right\}}}} \right. \kern-\nulldelimiterspace} {\left\{ {\left( {{\rm 1}-\alpha ^{2} } \right).\left( {{\rm 1}-\alpha ^{{{\rm 2}n}} } \right)} \right\}}}\sigma ^{{\rm 2}} \cr & {\rm Covar}\left[ {Ds\left( {t,\,j} \right),\,Ds\left( {t,\,k} \right)} \right]\,{\equals}\,{{\left\{ {\alpha ^{{k-j}} .\left( {{\rm 1}-\alpha ^{{{\rm 2}j}} } \right).\left( {{\rm 1}-\alpha ^{{{\rm 2}(n-k)}} } \right)} \right\}} \mathord{\left/ {\vphantom {{\left\{ {\alpha ^{{k-j}} .\left( {{\rm 1}-\alpha ^{{{\rm 2}j}} } \right).\left( {{\rm 1}-\alpha ^{{{\rm 2}(n-k)}} } \right)} \right\}} {\left\{ {\left( {{\rm 1}-\alpha ^{{\rm 2}} } \right).\left( {{\rm 1}-\alpha ^{{{\rm 2}n}} } \right)} \right\}}}} \right. \kern-\nulldelimiterspace} {\left\{ {\left( {{\rm 1}-\alpha ^{{\rm 2}} } \right).\left( {{\rm 1}-\alpha ^{{{\rm 2}n}} } \right)} \right\}}}\sigma ^{{\rm 2}} $$
We now put rs j ={(1−α 2j ).(1−α 2(n−j))}/{(1−α 2).(1−α 2n )}. The values of rs j also rise and fall over the year, symmetrically, with zero for both j=0 and j=n. They are a bit larger than the corresponding values for the Brownian bridge if α y is large, and tend to the latter as α→1; but if α y is small, they are a little smaller than for the Brownian bridge, but not evenly for all values of j, i.e. some may be larger, some smaller. We show the ratios also in Table 1 for selected values of α y .
3.6. We can also calculate the second expected value
 $$\eqalignno{ E_{{\rm 2}} X\left( {t,\,j} \right)\,{\equals}\, & E\left[ {X\left( {t,\,j} \right)\!\mid\!X\left( {t,\,{\rm 0}} \right)\,{\equals}\,X_{{\rm 0}} \,{\rm and}\,X\left( {t,\,n} \right)\,{\equals}\,X_{n} \,{\rm and}\,{\rm the}\,{\rm value}\,{\rm of}\,X\left( {t,\,j-{\rm 1}} \right)} \right] \cr \,{\equals}\, & \mu {\plus}\alpha \left( {X\left( {t,\,j-{\rm 1}} \right)-\mu } \right){\rm }{\plus}\alpha ^{{n-j}} .\lambda \left( t \right) $$
and also the forwards deviations, which are
 $$\eqalignno{ Df\left( {t,\,j} \right)&\,{\equals}\, X\left( {t,\,j} \right)-E_{{\rm 2}} X\left( {t,\,j} \right) \, \cr &{\equals}\, \, \sigma .Z^{{\asterisk}} \left( {t,\,j} \right) $$
The expected value of each forwards deviation is zero, and the weighted sum of them
 $$\mathop{\sum}\limits_{i\,{\equals}\,{\rm 1},n} {\alpha ^{{n-i}} Df\left( {t,\,i} \right)} \,{\equals}\,\sigma \mathop{\sum}\limits_{i\,{\equals}\,{\rm 1},n} {\alpha ^{{n-i}} \,Z^{{\asterisk}} \left( {t,\,i} \right)} \,{\equals}\,{\rm 0}$$
with certainty. The variance is
 $${\rm Var}\left[ {Df\left( {t,\,j} \right)} \right]\,{\equals}\,{\rm Var}\left[ {\sigma \,Z^{{\asterisk}} \left( {t,\,j} \right)} \right]\,{\equals}\,\left( {{\rm 1}-{{\alpha ^{{{\rm 2}(n-j)}} } \mathord{\left/ {\vphantom {{\alpha ^{{{\rm 2}(n-j)}} } {s_{n} }}} \right. \kern-\nulldelimiterspace} {s_{n} }}} \right).\sigma ^{{\rm 2}} $$
These vary with j, unlike for the Brownian bridge where the variance is the same for all j, and we define rf(j)
 $$\,{\equals}\,\sqrt{ \{ {{\rm 1}-{{\alpha ^{{{\rm 2}(n-j)}} } \mathord{\left/ {\vphantom {{\alpha ^{{{\rm 2}(n-j)}} } {s_{n} }}} \right. \kern-\nulldelimiterspace} {s_{n} }}} \}}.$$
Although the values of rf(j) vary with j, the sum of their squares Σ j=1,n rf(j)2=n−1, which is the same as for the Brownian bridge. So the sum of the variances of the forwards deviations, Σ j=1,n Var[Df(j)]=(n−1).σ 2 for both bridge models.
We also have
 $$\eqalignno{ {\rm Covar}\left[ {Df\left( {t,\,j} \right),\,Df\left( {t,\,k} \right)} \right]\,&{\equals}\, \sigma ^{{\rm 2}} {\rm Covar}\left[ {Z^{{\asterisk}} \left( {t,\,j} \right),\,Z^{{\asterisk}} \left( {t,\,k} \right)} \right] \cr &\,{\equals}\! -\sigma ^{{\rm 2}} .{{\alpha ^{{n-j}} \,\alpha ^{{n-k}} } \mathord{\left/ {\vphantom {{\alpha ^{{n-j}} \,\alpha ^{{n-k}} } {s_{n} }}} \right. \kern-\nulldelimiterspace} {s_{n} }} $$
from which the correlation coefficient can be calculated. Note that the covariances and the correlation coefficients vary with both j and k and also with the difference j−k.
3.7. The final calculation is for the third expected value and third deviation term, the unconstrained deviation, assuming that we do not know the value of X(t+1, 0). We have
 $$\eqalignno{ X\left( {t,\,j} \right)\,{\equals}\, & \mu {\plus}\alpha \left( {X\left( {t,\,j{\minus}{\rm 1}} \right)-\mu } \right){\plus}\alpha ^{{n-j}} \lambda \left( t \right){\plus}\sigma .Z^{{\asterisk}} \left( {t,\,j} \right) \cr {\rm Also}\quad \lambda \left( t \right){\rm }& {\equals}\, {{\left\{ {X\left( {t{\plus}{\rm 1},\,{\rm 0}} \right)-\mu -\alpha _{y} \left( {X\left( {t,\,{\rm 0}} \right)-\mu } \right)} \right\}} \mathord{\left/ {\vphantom {{\left\{ {X\left( {t{\plus}{\rm 1},\,{\rm 0}} \right)-\mu -\alpha _{y} \left( {X\left( {t,\,{\rm 0}} \right)-\mu } \right)} \right\}} {s_{n} }}} \right. \kern-\nulldelimiterspace} {s_{n} }} \cr &{\equals}\, {{\left\{ {\mu {\plus}\alpha _{y} \left( {X\left( {t,\,{\rm 0}} \right){\minus}\mu } \right){\plus}\sigma _{y} .Z\left( t \right){\minus}\mu {\minus}\alpha _{y} \left( {X\left( {t,\,{\rm 0}} \right){\minus}\mu } \right)} \right\}} \mathord{\left/ {\vphantom {{\left\{ {\mu {\plus}\alpha _{y} \left( {X\left( {t,\,{\rm 0}} \right){\minus}\mu } \right){\plus}\sigma _{y} .Z\left( t \right){\minus}\mu {\minus}\alpha _{y} \left( {X\left( {t,\,{\rm 0}} \right){\minus}\mu } \right)} \right\}} {s_{n} }}} \right. \kern-\nulldelimiterspace} {s_{n} }} \, \cr &{\equals}\, \, \sigma _{y} .{{Z\left( t \right)} \mathord{\left/ {\vphantom {{Z\left( t \right)} {s_{n} }}} \right. \kern-\nulldelimiterspace} {s_{n} }} $$
 $$\eqalignno{ {\rm So}\quad X\left( {t,\,j} \right)\,{\equals}\, & \mu {\plus}\alpha \left( {X\left( {t,\,j-{\rm 1}} \right)-\mu } \right){\plus}\alpha ^{{n-j}} \sigma _{y} .{{Z\left( t \right)} \mathord{\left/ {\vphantom {{Z\left( t \right)} {s_{n} }}} \right. \kern-\nulldelimiterspace} {s_{n} }}{\plus}\sigma .Z^{{\asterisk}} \left( {t,\,j} \right) \cr E_{{\rm 3}} X\left( {t,\,j} \right){\rm }\,&{\equals}\, \mu {\plus}\alpha \left( {X\left( {t,\,j-{\rm 1}} \right)-\mu } \right) \cr Du\left( {t,\,j} \right){\rm }\,&{\equals}\, \alpha ^{n-j} \,\sigma _{y} .{{Z\left( t \right)} \mathord{\left/ {\vphantom {{Z\left( t \right)} {s_{n} }}} \right. \kern-\nulldelimiterspace} {s_{n} }}{\plus}\sigma .Z^{{\asterisk}} \left( {t,\,j} \right) \cr & E\left[ {Du\left( {t,\,j} \right)} \right] \,{\equals}\, {\rm 0} $$
Then (see Appendix A3.4) Var[Du(t, j)]=σ 2 and Covar[Du(t, j), Du(t, k)]=0, all as we would expect for a monthly AR(1) model. This confirms that our postulated model replicates appropriately an AR(1) monthly model. It depends on the formulae for λ(t) and Z*(t, j) that we have chosen. Other plausible ways of defining these do not give the right result. In Wilkie et al. (Reference Wilkie, Owen and Waters2003) a different method was used, which we now find was incorrect.
4. The Approaches of Other Authors
4.1. Most authors deal only with continuous Brownian bridges. For example, Karatzas & Shreve (Reference Karatzas and Shreve1991) define a Brownian bridge as the solution to a particular stochastic differential equation, and show that a Brownian bridge from a to b on [0, T] is the equivalent of Brownian motion started at a and conditioned to arrive at b at time T. They show that if X t is a Brownian bridge from (0, a) to (T, b) with σ=1 then E[X t ]=a+t (a−b)/T and the covariance Covar[X s, X t ]=s (1−t/T), where s≤t, whence Var[X t ]=t (1−t/T). These are equivalent to our results in sections 2.7 and A2.2. They go no further, and do not mention OU bridges.
4.2. Kloeden & Platen (Reference Kloeden and Platen1999) define a Brownian bridge in the same way as we postulate in section 2.6, but in a continuous equivalent, and find the expectation, variance and covariance as Karatzas & Shreve. They leave the construction of a Brownian bridge as an exercise and do not mention OU bridges.
4.3. Iacus (Reference Iacus2008) defines the Brownian bridge in the same way as Kloeden & Platen, and gives a simple R routine for generating a sample bridge in the same way as we do. He does not give any further properties of Brownian bridges, nor mentions OU bridges.
4.4. Gusak et al. (Reference Gusak, Kukush, Kulik, Mishura and Pilipenko2010) is primarily a book of exercises. Several of these ask the student to prove the properties of a Brownian bridge as quoted by Kartazas & Shreve, and others ask the student to prove similar properties for an OU bridge.
4.5. Simão (Reference Simao1996), Maslowski & Simão (Reference Maslowski and Simão1997, Reference Maslowski and Simão2001), Goldys & Maslowski (Reference Goldys and Maslowski2008), Barczy & Kern (Reference Barczy and Kern2011) and Corlay (Reference Corlay2013) all discuss OU bridges (also called pinned OU processes). None discusses discrete bridges, and none discusses the practical aspects of construction of such a bridge. Barczy & Kern give explicit formulae equivalent to our E 1 X(t, j), Var[Ds(t, j)] and Covar[Df(t, j), Df(t, k)], but use hyperbolic functions so the formulae appear to be very different (but see Appendix A3.1 and A3.2).
4.6. Kahl (Reference Kahl2007) and Sekerci (Reference Sekerci2009) discuss the practical construction of Brownian bridge, but with a very different emphasis from ours. Kahl uses the same method as Glasserman (Reference Glasserman2003), which we discuss below, and Sekerci is interested in alternative approximation methods to the continuous bridge.
4.7. No authors that we have found discuss our forwards and unconstrained deviations or their properties, nor anything that we discuss in sections 6 to 8 below, nor in the subsequent Parts 3B and 3C.
5. Glasserman’s Method
5.1. In this section, we discuss the method of Glasserman (Reference Glasserman2003) for constructing Brownian bridges and compare it with the method we suggest. We construct a Brownian bridge by taking n unit (perhaps normal) random variables, Z
1 to Z
n
. We then calculate in effect n adjusted values, which we denote
 $Z_{1}^{{\asterisk}} $
to
 $Z_{n}^{{\asterisk}} $
, as
 $$Z_{j}^{{\asterisk}} \,{\equals}\,Z_{j} {\minus} \mathop \sum\limits_j {{Z_{j} } \over n}$$
From A2 we can see that
 $E\left[ {Z_{j}^{{\asterisk}} } \right]\,{\equals}\,{\rm 0}$
and
 $${\rm Var}\left[ {Z_{j}^{{\asterisk}} } \right]\,{\equals}\,$$
(n−1)/n. We also calculate a local mean change per month
 $\lambda \left( t \right)\,{\equals}\, {{\left(X\left( {t{\plus}{\rm 1},\, {\rm 0}} \right){\minus}X\left( {t, \,{\rm 0\right)}} \right)} }$
/n, and we can calculate the bridging values, X(t, j), which here we call x as
 $$x_{j} \,{\equals}\,x_{{j{\minus}{\rm 1}}} {\plus}\lambda \left( t \right){\plus}\sigma . Z_{j}^{{\asterisk}} $$
5.2. Given the values of the Zs we can calculate the values of the Z*s, but we cannot reverse this. The condition ∑ j Z j *=0 takes away one degree of freedom. Given a set of Z*s for which ∑ j Z j *=0, we could choose any constant b and put Z j =Z j *+b, and we would, reversing, get the same set of Z*s. If b were a constant for all sets of Z*s, the Zs would not have zero mean, but if b were a random variable with E[b]=0 and Var[b]=1/n then the derived Zs might be consistent, but would still not be identifiable.
5.3. Glasserman takes an interval from s i to s i+1, assumes that W(s i )=x i and W(s i+1)=x i+1 are given, and that the variance per unit time is unity. Then for any point s in the interval (s i , s i+1) he gets
 $$E\left[ {W\left( s \right)} \right]\,{\equals}\,{{\left( {s_{{i{\plus}{\rm 1}}} {\minus} s} \right)x_{i} {\plus}\left( {s{\minus} s_{i} } \right)x_{{i{\plus}{\rm 1}}} } \over {(s_{{i{\plus}{\rm 1}}} {\minus} s_{i} )}}$$
and
 $${\rm Var}\left[ {W\left( s \right)} \right]\,{\equals}\, {{\left( {s_{{i{\plus}{\rm 1}}} {\minus} s} \right)\left( {s{\minus} s_{i} } \right)} \over {\left( {s_{{i{\plus}{\rm 1}}} {\minus} s_{i} } \right)}}$$
5.4. Glasserman can then interpolate, simulating a value for W(s) as
 $$x_{s} \,{\equals}\,E\left[ {W(s)} \right]{\plus}\sqrt {{\rm Var}\left[ {W\left( s \right)} \right]} .Z_{s} $$
where Z s is unit normal, thus inserting a value anywhere in his initial interval; then, in each of the smaller intervals on each side of this, he can insert new points, until as many points as he needs are filled. This gives a Brownian bridge at any chosen intervals, not necessarily equal. To give a uniform bridge he suggests bisecting each interval, filling in binary fractions, half, quarters, eighths, etc. This does not fit our desired twelve months, but we could go to quarters and then split each into thirds.
5.5. Another approach would be to interpolate between the end points, x 0 and x 12, for the first monthly value, x 1, then between the simulated x 1 and x 12 to get x 2 and so on, putting in x 11 between x 10 and x 12 last. We choose a month as our unit time, with variance σ 2 per unit. Our time points are 0, 1, 2, … , 12. We shall denote the unit random variables for this method as G 1, … , G 11. Using Glasserman’s formulae we have
 $$E\left[ {x_{{\rm 1}} } \right]\,{\equals}\, {{{\rm 11}.x_{{\rm 0}} {\plus}{\rm 1}.x_{{{\rm 12}}} } \over {{\rm 12}}}\,{\equals}\, x_{{\rm 0}} {\plus}\lambda (t)$$
and
 $${\rm Var}\left[ {x_{{\rm 1}} } \right]\,{\equals}\, {{{\rm 11}} \over {{\rm 12}}}\sigma ^{{\rm 2}} $$
So
 $x_{{\rm 1}} \,{\equals}\, x_{{\rm 0}} {\plus}\lambda \left( t \right){\plus} \sigma \sqrt {{{{\rm 11}} \over {{\rm 12}}}} G_{{\rm 1}} $
. But we would have
 $ x_{{\rm 1}} \,{\equals}\, x_{{\rm 0}} {\plus}\lambda \left( t \right){\plus} \sigma Z_{{\rm 1}}^{{\asterisk}} $
. So we get
 $$Z_{{\rm 1}}^{{\asterisk}} \,{\equals}\, \sqrt {{{{\rm 11}} \over {{\rm 12}}}} G_{{\rm 1}} $$
5.6. This is a good start, but now we must interpolate between x 1 and x 12. We get
 $$\eqalignno{ E\left[ {x_{{\rm 2}} } \right]\,&{\equals}\,{{{\rm 10}.x_{1} {\plus}{\rm 1}.x_{{{\rm 12}}} } \over {{\rm 11}}} \, \cr &{\equals}\, \,x_{{\rm 1}} {\plus} {{x_{{{\rm 12}}} {\minus}x_{{\rm 1}} } \over {{\rm 11}}} \cr & \,{\equals}\,\left( {x_{{\rm 0}} {\plus}\lambda \left( t \right){\plus}\sigma Z_{{\rm 1}}^{{\asterisk}} } \right){\plus} {{x_{{{\rm 12}}} {\minus} x_{{\rm 0}} {\plus}\lambda \left( t \right){\plus}\sigma Z_{{\rm 1}}^{{\asterisk}} } \over {{\rm 11}}} $$
 $$\hskip -11pc {\rm Var}\left[ {x_{{\rm 2}} } \right]\,{\equals}\,{{{\rm 10}} \over {{\rm 11}}}\sigma ^{{\rm 2}} $$
and then
 $$\eqalignno{ & x_{{\rm 2}} \,{\equals}\, x{\plus} {{x_{{{\rm 12}}} {\minus} x_{{\rm 1}} } \over {{\rm 11}}}{\plus}\sigma \sqrt {{{{\rm 10}} \over {{\rm 11}}}} G_{{\rm 2}} \cr & \quad\,{\equals}\,x{\plus}\lambda \left( t \right){\plus}\sigma Z_{{\rm 1}}^{{\asterisk}} {\plus} {{x_{{{\rm 12}}} {\minus} \left( {x_{{\rm 0}} {\plus}\lambda \left( t \right){\plus}\sigma Z_{{\rm 1}}^{{\asterisk}} } \right)} \over {{\rm 11}}}{\plus} \sigma \sqrt {{{{\rm 10}} \over {{\rm 11}}}} G_{{\rm 2}} \cr & \quad\,{\equals}\,x_{{\rm 0}} {\plus}\lambda \left( t \right){\plus}{{{\rm 11}.\lambda \left( t \right)} \over {{\rm 11}}} \sigma Z_{{\rm 1}}^{{\asterisk}} .\left( {{\rm 1}{\minus} {{\rm 1} \over {{\rm 11}}}} \right){\plus} \sigma \sqrt {{{{\rm 10}} \over {{\rm 11}}}} G_{{\rm 2}} $$
We would put
 $$\eqalignno{ x_{{\rm 2}} \,&{\equals}\, x_{{\rm 1}} {\plus}\lambda \left( t \right){\plus} \sigma Z_{{\rm 2}}^{{\asterisk}} \,\cr &{\equals}\, \,x_{{\rm 0}} {\plus}{\rm 2}\lambda \left( t \right){\plus} \sigma Z_{{\rm 1}}^{{\asterisk}} {\plus} \sigma Z_{{\rm 2}}^{{\asterisk}} $$
Equating the two expressions for x 2 and dividing by σ we get
 $$Z_{{\rm 1}}^{{\asterisk}} {\plus}Z_{{\rm 2}}^{{\asterisk}} \,{\equals}\, {{{\rm 10}} \over {{\rm 11}}}Z_{{\rm 1}}^{{\asterisk}} {\plus}\sqrt {{{{\rm 10}} \over {{\rm 11}}}} G_{{\rm 2}} $$
whence
 $${{Z_{{\rm 1}}^{{\asterisk}} } \over {{\rm 11}}}{\plus} Z_{{\rm 2}}^{{\asterisk}} \,{\equals}\, \sqrt {{{{\rm 10}} \over {{\rm 11}}}} G_{{\rm 2}} $$
5.7. We can continue repeatedly, and can calculate recursively values of the Gs from the Z*s or vice versa. Only eleven Gs are needed for the intermediate months, which would give us eleven Z*s, but we know that
 $E\left[ {Z_{j}^{{\asterisk}} } \right]\,{\equals}\,{\rm 0}$
, from which the (redundant) value of Z
12* can be found.
5.8. When two alternative methods are available to perform the same function, it is of interest to see which is computationally more efficient. We have programmed both methods reasonably efficiently, and we simulate 100,000 years of a random walk, filling in twelve months in each year with a Brownian bridge. We then repeat the bridging 1,000 times, giving 100 million years-worth in all. Our method takes 30 seconds, Glasserman’s 50 seconds. The methods require trivial times for any reasonable number of simulations, but there is a noticeable difference. Our method requires one multiplication per month. Glasserman’s requires two multiplications and one division per month, and these operations are the slow ones, as compared with additions, subtractions and the other necessary computer operations such as looping and entering and exiting subroutines.
5.9. We have also analysed the results for each of the methods over 250 years to check that the final results are compatible with random walks, with constant parameters, they both are. It is, we consider, good computing practice to check that one’s simulations do produce results that agree with what one was expecting. We have done this with all of our simulations, checking that the results for all the economic variables, over 250 years, are compatible with the data that we have analysed, though over no more than 91 years. So we use both this numerical analysis and visual inspection of a simulated number of years, as a check on all our results.
6. Mixed Models
6.1. Although it is consistent to relate the monthly parameters, σ for the Brownian bridge, and μ, α and σ for the OU bridge, to the corresponding yearly parameters, especially if the annual model has been generated as a random walk or as an AR(1) model, it is not essential to do so. Either model may be useful for stochastic interpolation when the annual model is a more complicated one that cannot easily be replicated by a corresponding monthly model, but which nevertheless can be treated over the course of the year either as a local random walk or as a local AR(1) model. An annual OU model can be interpolated using a Brownian bridge if we so wish, or as an OU bridge with a different value of α y . We shall find this useful when we consider the actual series of the Wilkie model. Further, if there is additional information about the monthly model from actual data, this can be used to modify our parameters, as discussed in Parts 3B and 3C.
7. Numerical Results
7.1. In Table 1, we show the sideways deviation ratios for the Brownian bridge and for the OU bridge with α y =0.9, 0.7, 0.5, 0.3 and 0.1. Observe that the values of the sideways deviation ratios increase as the value of α y decreases, but we add that this reverses in the middle of the range when the value of α y becomes small. If α y were very small this would be of no practical significance since a very small value of α y would almost never be treated as significantly different from zero, which would move us to a model in which the values of X(t, 0) were the first differences of a random walk.
7.2. If we use the same values of σ for all the models, the standard deviations of the sideways deviations change as shown in Table 1. But if we use the same value of σ y for each model then the value of σ changes with α y and the variances of the sideways deviation for the OU models show greater differences from those of the Brownian bridge model.
7.3. In Table 2, we show the forwards deviation ratios for the same cases. Observe that they are constant for the Brownian bridge, and that they reduce for the OU bridges, more steeply as the value of α y decreases.
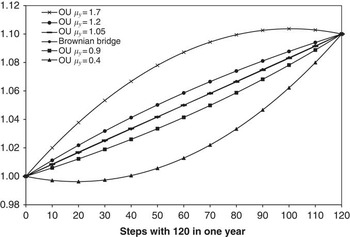
7.4. The expected values E 1 X for the Brownian bridge always lie on a straight line from X(t, 0) to X(t+1, 0), but those for the OU bridge depend on the values of α y and µ y . In Figure 1, we show these expected values from X(t, 0)=1.0 to X(t+1, 0)=1.1 for the Brownian bridge and for OU bridge, all with α y =0.5 and with µ y =0.4, 0.9, 1.05, 1.2 and 1.7. The symbols show the monthly values of E 1 X. A discrete bridge has only discrete values, so to produce the lines we have calculated bridges with 120 steps per year, 10 for each month. Because 12 is a factor of 120, the expected values at the monthly points are the same. This is an example of a general principle, that if bridges are constructed with n 1 and n 2 periods and n 1 and n 2 have a highest common factor n 3, then the expected values and the variances coincide on the n 3 common points. The scale at the foot of the graph runs from 0 to 120, indicating the shorter periods.
Expected values E 1 X for the Brownian and OU bridges, with α y =0.5 and µ y =0.4, 0.9, 1.05, 1.2 and 1.7.

7.5. Each of the OU bridges starts off from X(t, 0) rather in the direction of µ y , which is downwards below 1.0 if the value of µ y is small, as for µ y =0.4, after which they all turn in the direction of X(t+1, 0), so as to end at the correct point. If µ y is very large, as for µ y =1.7, the curve rises above 1.1 in the later months and falls down towards X(t+1, 0). When µ y =1.2 the unconstrained expected value of X(t+1, 0) is 1.1, so the value of λ(t) in the calculation is 0, and the curve follows the same exponential curve towards µ y as if the value of X(t+1, 0) were not known. The curves are concave or convex if µ y is below 1.0 or above 1.1, respectively. If µ y lies between the two values, as for µ y =1.05, the curve is S-shaped, first curving above the Brownian bridge straight line, crossing it at 1.05 and then curving below it. But the curves are so close that this can hardly be seen on the graph. The maximum difference of the 120 values is 0.004 for a long period in the middle of the first quarter, and 0.0038 in the other direction in the middle of the last quarter. As µ y increases the curve changes from S-shaped to concave, and as µ y decreases it changes to convex.
7.6. If the value of α y is increased, so that the autoregressive pull towards µ y is reduced, the lines move closer together. With α y =0.9 they fall very close together around the BB lines being at the most 0.0018 apart at the half-way point for these cases. If the value of α y is reduced, they move much further out.
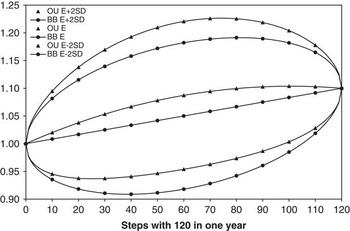
7.7. In Figure 2, we show the expected values E 1 X for a Brownian bridge and for an OU bridge with α y =0.5 and µ y =1.7, a rather extreme value. We make the values of σ the same for both models, equal to 0.03814, which corresponds to σ y =0.1 for the OU bridge and σ y =0.1321 for the Brownian bridge. Although the expected values differ noticeably, the standard deviations for the Brownian bridge and the OU bridge are very similar. The maximum difference between the expected values is 0.03718 at short period 59; the maximum difference between the standard deviations is much smaller, 0.00089, at short periods 17 and 103. We can see that, even with an extreme value of µ y , the lines are comparatively close. With higher values of α y , keeping the values of σ the same for both models, the pair of lines get closer together and for α y =0.9 they are almost indistinguishable. With different values of µ y , such as those shown in Figure 1, the lines for the OU bridge move up or down, keeping the same distance apart.
Expected values E 1 X and expected values ±2 s.d. for the Brownian bridge (BB) with σ=0.03814 and an OU bridge with α y =0.5, µ y =1.7 and σ=0.03814.

7.8. If we make the values of σ y the same for both models, thus reducing the value of σ for the Brownian bridge, the standard deviations for the Brownian bridge are reduced, and the lines for it are pulled in about a quarter of the way towards the line for the expected.
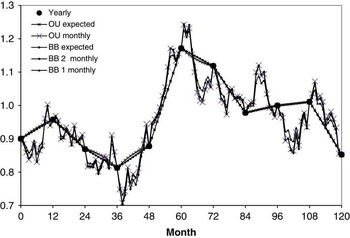
7.9. If the value of α y is not very small, and if the values of X(t, 0) and X(t+1, 0) are not very far from the mean then we can see that the statistical properties of the OU bridge and a Brownian bridge are not very different. We have simulated 10 values of X(t, 0) using an AR(1) model with parameters μ y =1.0, α y =0.5 and σ y =0.1 and with X(0)=1.0. We show the annual values in Figure 3 with large dots. We have then simulated bridging over 12 months (giving 120 months in all) in three ways: first, as an OU bridge with monthly parameters corresponding with the annual ones, i.e. so that α=0.943874 and σ=0.038140; second (BB 1), with a Brownian bridge using the same annual standard deviation as the OU bridge, σ y =0.1, so that σ=0.028868; third (BB 2), with a Brownian bridge with the same monthly standard deviation as the OU bridge, σ=0.038140, so that σ y =0.132121. We also show the expected values for the OU bridge and the Brownian bridge (for which the expected values are the same). The monthly OU items are indicated by crosses, the BB 1 ones with triangles and the BB 2 ones with dots.
Simulations of an annual OU model, with three bridging models, over 10 years with 12 months/year. BB, Brownian bridge.

7.10. The lines for the OU expected values are slightly curved, and this is more noticeable when they are further away from the mean of 1.0. But they are still close to the Brownian bridge ones, and the maximum difference in this sample is 0.0091 in month 30, the midpoint of a year in which the data is further away from the mean. In month 42, it is almost as big at 0.0088. The simulated monthly values for BB 2 are almost indistinguishable from those for the OU ones, the maximum difference being 0.0195 in month 144, when the monthly data is quite far from the expected values. The simulated BB 1 values can be further away from the OU ones than the BB 2 ones are, the maximum difference being 0.0396 in month 67, but occasionally the BB 1 simulated value is closer to the OU one than the BB 2 one is.
8. Analysing Actual Data
8.1. We analyse several economic series in Parts 3B and 3C. Each series has its own characteristics. We here describe the analyses that we can make of each, treating the intermediate values either as a Brownian bridge or as an OU bridge. We have a general series, X, with monthly values from year t=0 to year t=N, giving N complete years of data. There are N+1 annual data values, X(0, 0) to X(N, 0). Within each year there are n=12 monthly values plus one overlapping one, denoted X(t, 0), X(t, 1), … , X(t, 12)=X(t+1, 0). Each intermediate annual value is used twice, once as the end point and once as the starting point of a year.
8.2. We start by analysing X as if the monthly values were generated as a Brownian bridge. At this stage we do not consider how the annual values may have been generated. The change in X in year t is denoted XD(t)=X(t+1, 0)−X(t, 0). We divide XD(t) by n=12 to get the λ(t) of section 2.6. The expected values from which the sideways deviations are calculated are
 $$E_{{\rm 1}} X\left( {t,\,j} \right)\,{\equals}\,X\left( {t,\,{\rm 0}} \right){\plus}j.\lambda \left( t \right)$$
The sideways deviations are calculated as DsX(t, j)=X(t, j)−E 1 X(t, j). We calculate the statistics, mean, variance, etc. for all years for month j from the N values of DsX(t, j).
8.3. The expected values from which the forwards deviations are calculated are
 $$E_{{\rm 2}} X\left( {t,\,j} \right)\,{\equals}\,X\left( {t,\,j-{\rm 1}} \right){\plus}\lambda \left( t \right)$$
The forwards deviations are calculated as DfX(t, j)=X(t, j)−E 2 X(t, j). We similarly calculate the statistics for all years for month j from the N values of DfX(t, j). The sum of the DfX(t, j) for year t is 0, and the sum over all years is therefore zero.
8.4. We calculate the variance of the 12 values of DfX(t, j) for year t as
 $$V\left( t \right)\,{\equals}\,\mathop{\sum}\limits_j {{{DfX\left( {t,\,j} \right)^{{\rm 2}} } \mathord{\left/ {\vphantom {{DfX\left( {t,\,j} \right)^{{\rm 2}} } {{\rm 12}}}} \right. \kern-\nulldelimiterspace} {{\rm 12}}}} $$
We divide by 12 because the value of the mean is known, and is 0. But our estimate of σ(t)2 for the year is V(t)×12/11=∑ j DfX(t, j)2/11. If we assume that σ(t)2 is constant for all years and equals σ 2 we can estimate it as the mean value ∑σ(t)2/N or equivalently by summing over all months and years and dividing by 11N, giving ∑ jt DfX(t, j)2/(11N). If we were to estimate the overall value of σ by averaging the annual standard deviations, the values of σ(t), we would get a different and less correct answer.
8.5. We observe that for many series the values of σ(t) vary considerably from one year to the next and are often large when the annual jump XD(t) is large, regardless of sign. So σ(t) is bigger when the jump, either up or down, is large. We investigate eight possible regression equations: four using σ(t) as the dependent variable and four using σ(t)2. We use four possible independent variables: Abs(XD(t)), XD(t)2, Abs(XD(t)−XSC) and (XD(t)−XSC)2, where in each case XSC is the mean value of XD(t) over all years. The regression formulae are as follows:
 $$\sigma \left( t \right)\,{\equals}\,XSM\left( t \right)\,{\equals}\,XSA{\plus}XSB.{\rm Abs}\left( {XD\left( t \right)} \right)$$
 $$\sigma \left( t \right)^{{\rm 2}} \,{\equals}\,XSM\left( t \right)\,{\equals}\,XSA{\plus}XSB.{\rm Abs}\left( {XD\left( t \right)} \right)$$
 $$\sigma \left( t \right)\,{\equals}\,XSM\left( t \right)\,{\equals}\,XSA{\plus}XSB.XD\left( t \right)^{{\rm 2}} $$
 $$\sigma \left( t \right)^{{\rm 2}} \,{\equals}\,XSM\left( t \right)\,{\equals}\,XSA{\plus}XSB.XD\left( t \right)^{{\rm 2}} $$
 $$\sigma \left( t \right)\,{\equals}\,XSM\left( t \right)\,{\equals}\,XSA{\plus}XSB.{\rm Abs}\left( {XD\left( t \right)-XSC} \right)$$
 $$\sigma \left( t \right)^{{\rm 2}} \,{\equals}\,XSM\left( t \right)\,{\equals}\,XSA{\plus}XSB.{\rm Abs}\left( {XD\left( t \right)-XSC} \right)$$
 $$\sigma \left( t \right)\,{\equals}\,XSM\left( t \right)\,{\equals}\,XSA{\plus}XSB.\left( {XD\left( t \right)-XSC} \right)^{{\rm 2}} $$
 $$\sigma \left( t \right)^{{\rm 2}} \,{\equals}\,XSM\left( t \right)\,{\equals}\,XSA{\plus}XSB.\left( {XD\left( t \right)-XSC} \right)^{{\rm 2}} $$
In each case an error term is to be added. Each formula is symmetrical for XD(t), the first four about zero and the last four about XSC. The graphs of formulae (1) and (5) are two straight lines, the graphs of (2) and (6) are two half parabolae reflected in a vertical line, the graphs of (3) and (7) are parabolae and those of (4) and (8) are hyperbolae, so all are conic sections or parts thereof. We do not find that any one regression equation suits all series, and several of our variations prove to be the most suitable each for a different series.
8.6. We “standardise” the forwards deviations by dividing each by the corresponding annual standard deviation (not by the overall standard deviation, which would be the more usual form of standardisation, nor by the expected value of σ(t) according to the appropriate formula above), giving
 $$DfXZ\left( {t,\,j} \right)\,{\equals}\,{{DfX\left( {t,\,j} \right)} \mathord{\left/ {\vphantom {{DfX\left( {t,\,j} \right)} {\left( {\sigma \left( t \right).\sqrt {\left( {{{{\rm 11}} \mathord{\left/ {\vphantom {{{\rm 11}} {{\rm 12}}}} \right. \kern-\nulldelimiterspace} {{\rm 12}}}} \right)} } \right)}}} \right. \kern-\nulldelimiterspace} {\left( {\sigma \left( t \right).\sqrt {\left( {{{{\rm 11}} \mathord{\left/ {\vphantom {{{\rm 11}} {{\rm 12}}}} \right. \kern-\nulldelimiterspace} {{\rm 12}}}} \right)} } \right)}}$$
The DfXZs are distributed with zero mean and unit variance, but they are not independent, are constrained to sum to zero and have negative correlation with each other within the year. The observed means and variances in a sample are not necessarily equal to 0 and 1. But we use the DfXZs to calculate correlation coefficients between the values in corresponding months of successive years, i.e. between DfXZ(t, j) and DfXZ(t−1, j). We can calculate these for each month separately, and for all months together. But we note that the correlation coefficient for all months together is not equal to the average of the correlation coefficients for the individual months. For certain series the year-to-year correlation proves to be important.
8.7. We also use the standardised deviations to calculate correlation coefficients between corresponding deviations of different series, i.e. between DfXZ(t, j) for series X and DfYZ(t, j) for series Y. For several series this simultaneous cross-correlation is important. We also calculate lagged cross-correlations for several lags in each direction, but in fact do not find them large for any pair of series.
8.8. Where we investigate as if for an OU bridge most of what we have given for the Brownian bridge applies, except that the expected values of the sideways and forwards deviations are modified as shown in section 3. We require assumed values for the mean, µ, and for the annual regression factor, α y , for which we take appropriate values from the annual model. However, it is the weighted sum of the values of DfX(t, j) that equals zero, not the simple sum, so small modifications in the calculations are necessary.
8.9. We wish to distinguish between data that can plausibly have been generated by a Brownian bridge and that for which an OU bridge would seem more appropriate. To help the comparisons we define a few more terms. We assume that the true model is an OU bridge, but we are first analysing it as a Brownian bridge. However, we need to postulate an overall mean value, µ y , as if the model were an OU one. In some cases, such as the price index and earnings index, the value of the index has been generally rising with time, so there is no question of the model being an OU one, and what we now describe is not applicable. But in other cases, like dividend yields and interest rates, where the annual model is almost certainly mean reverting, an estimated value of µ y is available. What we are testing is not the annual model, but whether the monthly data can be locally treated better as a Brownian bridge or as an OU one.
8.10. Within one year, the line of expected values for the Brownian bridge is a straight line sloping upwards, downwards or horizontally, depending on the values of the end points, X(t, 0) and X(t+1, 0). The corresponding line of expected values for an OU bridge depends on the value of µ y relative to the values of X(t, 0) and X(t+1, 0). When µ y is the greatest of the three, i.e. µ y >X(t, 0) and µ y >X(t+1, 0) then the expected values for the OU bridge are greater than those for the Brownian bridge, so the line of OU lies above that for the Brownian bridge. When µ y is the smallest of the three, the expected values are less, and the corresponding line is below that for Brownian bridge. In intermediate positions, when µ y lies between X(t, 0) and X(t+1, 0) then the OU line is close to the Brownian bridge one, and may cross it when X=µ y , though this might not be on a monthly point. This is all as in Figure 1.
8.11. In the first case, when µ y is the greatest, the expected values of the sideways deviations within 1 year are all positive. We define these as “upwards deviations”, but we note that the individual deviations may be positive or negative. We define the corresponding sideways deviations when µ y is the smallest as “downwards deviations”, again regardless of their sign. In the intermediate case, the expected values of the sideways deviation may be mixed, being either first positive and then negative or else vice versa, and in any case are quite small. We call these “medium deviations”. We define “reversed deviations” as the actual values of the upward deviations and the values of the downward deviations with their signs reversed; we omit the medium deviations.
8.12. Upwards, downwards and medium deviations exist only for those years where the corresponding conditions apply, but the three sample sizes add up to the total number of years in any sample. If the true model is a random walk, then the expected values of each are zero, and reversing the sign makes no difference to the expected values of the reversed deviations; they remain at zero. But if the true model is an OU bridge then the expected value of the reversed deviations is positive, and if their observed mean is positive this may indicate that an OU bridge is more appropriate.
8.13. The same argument can be applied if the sideways deviations are calculated relative to an assumed OU bridge. If the mean of the reversed deviations is noticeably positive than an OU bridge with a lower value of α y it might fit better. If it is noticeably negative then a higher value of α y might be better.
9. Conclusion
9.1. We have developed the properties of discrete stochastic bridges, both Brownian and OU bridges, and have introduced the concepts of sideways, forwards and unconstrained deviations. We have also shown how a data series might be analysed to see how stochastic bridges can be constructed to replicate the properties of real data. All the practical aspects are discussed much more fully when we consider individual series in Parts 3B and 3C.
Acknowledgment
The authors are grateful to two anonymous referees for their comments.
Appendix: Proofs of Results
A1. In this Appendix, we give proofs of the results in sections 2 and 3. We refer back to that section throughout. Where the algebraic manipulation is lengthy we do not give every intermediate step.
A2. The Brownian bridge
A2.1. We first deal with the Brownian bridge, discussed in section 2. In section 2.6 we define
 $$Z^{{\asterisk}} \left( {t,\,j} \right)\,{\equals}\,Z\left( {t,\,j} \right)-{{\left( {\mathop{\sum}\limits_{j\,{\equals}\,{\rm 1},n} {Z\left( {t,\,j} \right)} } \right)} \mathord{\left/ {\vphantom {{\left( {\mathop{\sum}\limits_{j\,{\equals}\,{\rm 1},n} {Z\left( {t,\,j} \right)} } \right)} n}} \right. \kern-\nulldelimiterspace} n}$$
and we state also that ∑ j=1,n Z*(t, j)=0, E[Z*(t, j)]=0, Var[Z*(t, j)]=(n−1)/n, that Covar[Z*(t, j), Z*(t, k)]=−1/n if j≠k and that the correlation coefficient for all j≠k in the same year, CC[Z*(t, j), Z*(t, k)]=−1/(n−1).
 $$\eqalignno{ \mathop{\sum}\limits_{j\,{\equals}\,{\rm 1},n} {Z^{{\asterisk}} \left( {t,\,j} \right)} \,{\equals}\, & \mathop{\sum}\limits_{j\,{\equals}\,{\rm 1},n} {\left\{ {Z\left( {t,\,j} \right)-{{\left\{ {\mathop{\sum}\limits_{j\,{\equals}\,{\rm 1},n} {Z\left( {t,\,j} \right)} } \right\}} \mathord{\left/ {\vphantom {{\left\{ {\mathop{\sum}\limits_{j\,{\equals}\,{\rm 1},n} {Z\left( {t,\,j} \right)} } \right\}} n}} \right. \kern-\nulldelimiterspace} n}} \right\}} \cr \,{\equals}\, & \mathop{\sum}\limits_{j\,{\equals}\,{\rm 1},n} {Z\left( {t,\,j} \right)} -\mathop{\sum}\limits_{j\,{\equals}\,{\rm 1},n} {Z\left( {t,\,j} \right)} \,{\equals}\,{\rm 0} $$
Since for each Z(t, j), E[Z(t, j)]=0, therefore E[∑ j=1,n Z(t, j)]=0 and E[Z*(t, j)]=0.
 $$\eqalignno{ {\rm Var}\left[ {Z^{{\asterisk}} \left( {t,\,j} \right)} \right]&\,{\equals}\, E\left[ {Z^{{\asterisk}} \left( {t,\,j} \right)^{{\rm 2}} } \right] \cr &\,{\equals}\, \, E\left[ {\left\{ {Z\left( {t,\,j} \right).\left( {{\rm 1}-{{\rm 1} \mathord{\left/ {\vphantom {{\rm 1} n}} \right. \kern-\nulldelimiterspace} n}} \right)-{{\left\{ {\mathop{\sum}\limits_{i\,\ne\,j} {Z\left( {t,\,i} \right)} } \right\}} \mathord{\left/ {\vphantom {{\left\{ {\mathop{\sum}\limits_{i\,\ne\,j} {Z\left( {t,\,i} \right)} } \right\}} n}} \right. \kern-\nulldelimiterspace} n}} \right\}^{{\rm 2}} } \right] \cr &\,{\equals}\, \, \left( {{\rm 1}-{{\rm 1} \mathord{\left/ {\vphantom {{\rm 1} n}} \right. \kern-\nulldelimiterspace} n}} \right)^{{\rm 2}} {\plus}{{\left( {n-{\rm 1}} \right)} \mathord{\left/ {\vphantom {{\left( {n-{\rm 1}} \right)} {n^{{\rm 2}} }}} \right. \kern-\nulldelimiterspace} {n^{{\rm 2}} }} \cr &\,{\equals}\, \, {\rm 1}-{{\rm 1} \mathord{\left/ {\vphantom {{\rm 1} n}} \right. \kern-\nulldelimiterspace} n}\,{\equals}\,{{\left( {n-{\rm 1}} \right)} \mathord{\left/ {\vphantom {{\left( {n-{\rm 1}} \right)} n}} \right. \kern-\nulldelimiterspace} n} $$
 $$\eqalignno{ & {\rm Covar}\left[ {Z^{{\asterisk}} \left( {t,\,j} \right),\,Z^{{\asterisk}} \left( {t,\,k} \right)} \right] \cr & \quad \quad \quad \quad \,{\equals}\, \, E\left[ {\left\{ {Z\left( {t,\,j} \right).\left( {{\rm 1}-{{\rm 1} \mathord{\left/ {\vphantom {{\rm 1} n}} \right. \kern-\nulldelimiterspace} n}} \right)-\left. {{{\left\{ {\mathop{\sum}\limits_{i\,\ne\,j} {Z\left( {t,\,i} \right)} } \right\}} \mathord{\left/ {\vphantom {{\left\{ {\mathop{\sum}\limits_{i\,\ne\,j} {Z\left( {t,\,i} \right)} } \right\}} n}} \right. \kern-\nulldelimiterspace} n}} \right\}.Z\left( {t,\,k} \right).\left( {{\rm 1}-{{\rm 1} \mathord{\left/ {\vphantom {{\rm 1} n}} \right. \kern-\nulldelimiterspace} n}} \right)-{{\left\{ {\mathop{\sum}\limits_{i\,\ne\,k} {Z\left( {t,\,i} \right)} } \right\}} \mathord{\left/ {\vphantom {{\left\{ {\mathop{\sum}\limits_{i\,\ne\,k} {Z\left( {t,\,i} \right)} } \right\}} n}} \right. \kern-\nulldelimiterspace} n}} \right\}} \right] \cr & \qquad \qquad \,{\equals}\, \!-\!{\rm \!2}\left( {{\rm 1}-{{\rm 1} \mathord{\left/ {\vphantom {{\rm 1} n}} \right. \kern-\nulldelimiterspace} n}} \right).\left( {{{\rm 1} \mathord{\left/ {\vphantom {{\rm 1} n}} \right. \kern-\nulldelimiterspace} n}} \right){\plus}{{\left( {n-{\rm 2}} \right)} \mathord{\left/ {\vphantom {{\left( {n-{\rm 2}} \right)} {n^{{\rm 2}} }}} \right. \kern-\nulldelimiterspace} {n^{{\rm 2}} }} \cr & \qquad \qquad\,{\equals}\! -\!{{\rm \!1} \mathord{\left/ {\vphantom {{\rm 1} n}} \right. \kern-\nulldelimiterspace} n} \cr &\, {\rm CC}\left[ {Z^{{\asterisk}} \left( {t,\,j} \right).Z^{\asterisk}\left( {t,\,k} \right)} \right]\,{\equals}\,{{\left\{ {-{{\rm 1} \mathord{\left/ {\vphantom {{\rm 1} n}} \right. \kern-\nulldelimiterspace} n}} \right\}} \mathord{\left/ {\vphantom {{\left\{ {-{{\rm 1} \mathord{\left/ {\vphantom {{\rm 1} n}} \right. \kern-\nulldelimiterspace} n}} \right\}} {\left\{ {{{\left( {n-{\rm 1}} \right)} \mathord{\left/ {\vphantom {{\left( {n-{\rm 1}} \right)} n}} \right. \kern-\nulldelimiterspace} n}} \right\}}}} \right. \kern-\nulldelimiterspace} {\left\{ {{{\left( {n-{\rm 1}} \right)} \mathord{\left/ {\vphantom {{\left( {n-{\rm 1}} \right)} n}} \right. \kern-\nulldelimiterspace} n}} \right\}}} \cr & \qquad \qquad\,{\equals}\! -\!{{\rm \!1} \mathord{\left/ {\vphantom {{\rm 1} {\left( {n-{\rm 1}} \right)}}} \right. \kern-\nulldelimiterspace} {\left( {n-{\rm 1}} \right)}} $$
A2.2. In section 2.7, we state that for the Brownian bridge Var[Ds(t, j)]=j (1−j/n).σ 2. We had shown that Ds(t, j)=σ ∑ i=1,j Z*(t, i), and that E[Ds(t, j)]=0. Hence
 $$\eqalignno{ {\rm Var}\left[ {Ds\left( {t,\,j} \right)} \right]\,{\equals}\, & E\left[ {Ds\left( {t,\,j} \right)^{{\rm 2}} } \right] \cr \,{\equals}\, & \sigma ^{{\rm 2}} E\left[ {\left\{ {\mathop{\sum}\limits_{i\,{\equals}\,{\rm 1},j} {Z^{{\asterisk}} \left( {t,\,i} \right)} } \right\}^{{\rm 2}} } \right] \cr \,{\equals}\, & \sigma ^{{\rm 2}} E\left[ {\left\{ {{{\mathop{\sum}\limits_{i\,{\equals}\,{\rm 1},j} {Z\left( {t,\,i} \right)-j} } \mathord{\left/ {\vphantom {{\mathop{\sum}\limits_{i\,{\equals}\,{\rm 1},j} {Z\left( {t,\,i} \right)-j} } {n.\mathop{\sum}\limits_{i\,{\equals}\,{\rm 1},n} {Z\left( {t,\,i} \right)} }}} \right. \kern-\nulldelimiterspace} {n.\mathop{\sum}\limits_{i\,{\equals}\,{\rm 1},n} {Z\left( {t,\,i} \right)} }}} \right\}^{{\rm 2}} } \right] \cr \,{\equals}\, & \sigma ^{{\rm 2}} E\left[ {\left\{ {\mathop{\sum}\limits_{i,j} {Z\left( {t,\,i} \right)\left( {{{1-j} \mathord{\left/ {\vphantom {{1-j} n}} \right. \kern-\nulldelimiterspace} n}} \right)} -\mathop{\sum}\limits_{i\,{\equals}\,j{\plus}{\rm 1},n} {{{Z\left( {t,\,i} \right)j} \mathord{\left/ {\vphantom {{Z\left( {t,\,i} \right)j} n}} \right. \kern-\nulldelimiterspace} n}} } \right\}^{{\rm 2}} } \right] \cr \,{\equals}\, & \sigma ^{{\rm 2}} \left\{ {j\left( {{\rm 1}-{j \mathord{\left/ {\vphantom {j n}} \right. \kern-\nulldelimiterspace} n}} \right)^{{\rm 2}} {\plus}\left( {n-j} \right)\left( {{j \mathord{\left/ {\vphantom {j n}} \right. \kern-\nulldelimiterspace} n}} \right)^{{\rm 2}} } \right\} \cr \,{\equals}\, & j\left( {{\rm 1}-{j \mathord{\left/ {\vphantom {j n}} \right. \kern-\nulldelimiterspace} n}} \right)\sigma ^{{\rm 2}} $$
 $$\eqalignno{ {\rm Covar}&\left[ {Ds\left( {t,\,j} \right),\,Ds\left( {t,\,k} \right)} \right] \,{\equals}\,E\left[ {Ds\left( {t,\,j} \right).Ds\left( {t,\,k} \right)} \right]\quad j\leq k \cr &\qquad \qquad \,{\equals}\, \sigma ^{{\rm 2}} E\left[ {\left\{ {\mathop{\sum}\limits_{i\,{\equals}\,{\rm 1},j} {Z^{{\asterisk}} \left( {t,\,i} \right)} } \right\}.\left\{ {\mathop{\sum}\limits_{i\,{\equals}\,{\rm 1},k} {Z^{{\asterisk}} \left( {t,\,i} \right)} } \right\}} \right] \cr & \qquad \qquad \,{\equals}\, \sigma ^{{\rm 2}} E\left[ {\left\{ {\mathop{\sum}\limits_{i\,{\equals}\,{\rm 1},j} {Z\left( {t,\,i} \right)} -{j \mathord{\left/ {\vphantom {j n}} \right. \kern-\nulldelimiterspace} n}.\mathop{\sum}\limits_{i\,{\equals}\,{\rm 1},n} {Z\left( {t,\,i} \right)} } \right\}.\left\{ {\mathop{\sum}\limits_{i\,{\equals}\,{\rm 1},k} {Z\left( {t,\,i} \right)} -{k \mathord{\left/ {\vphantom {k n}} \right. \kern-\nulldelimiterspace} n}.\mathop{\sum}\limits_{i\,{\equals}\,{\rm 1},n} {Z\left( {t,\,i} \right)} } \right\}} \right] \cr & \qquad \qquad \,{\equals}\, \sigma ^{{\rm 2}} E^{{\rm 2}} \left[ {\left\{ {\mathop{\sum}\limits_{i\,{\equals}\,{\rm 1},j} {Z\left( {t,\,i} \right)\left( {{\rm 1}-{j \mathord{\left/ {\vphantom {j n}} \right. \kern-\nulldelimiterspace} n}} \right)} -\mathop{\sum}\limits_{i\,{\equals}\,j{\plus}{\rm 1},k} {Z\left( {t,\,i} \right){j \mathord{\left/ {\vphantom {j n}} \right. \kern-\nulldelimiterspace} n}} -\mathop{\sum}\limits_{i\,{\equals}\,k{\plus}{\rm 1},n} {Z\left( {t,\,i} \right){j \mathord{\left/ {\vphantom {j n}} \right. \kern-\nulldelimiterspace} n}} } \right\}} \right \cr & \qquad\qquad\qquad. \left {\left\{ {\mathop{\sum}\limits_{i\,{\equals}\,{\rm 1},j} {Z\left( {t,\,i} \right)\left( {{\rm 1}-{k \mathord{\left/ {\vphantom {k n}} \right. \kern-\nulldelimiterspace} n}} \right)} {\plus}\mathop{\sum}\limits_{i\,{\equals}\,j{\plus}{\rm 1},k} {Z\left( {t,\,i} \right)\left( {{\rm 1}-{k \mathord{\left/ {\vphantom {k n}} \right. \kern-\nulldelimiterspace} n}} \right)} -\mathop{\sum}\limits_{i\,{\equals}\,k{\plus}{\rm 1},n} {Z\left( {t,\,i} \right)Z\left( {t,\,i} \right)k\,/\,n} } \right\}} \right] \cr & \quad\quad\quad\quad \,{\equals}\, \, \sigma ^{{\rm 2}} \left\{ {j\left( {{\rm 1}-{j \mathord{\left/ {\vphantom {j n}} \right. \kern-\nulldelimiterspace} n}} \right).\left( {{\rm 1}-{k \mathord{\left/ {\vphantom {k n}} \right. \kern-\nulldelimiterspace} n}} \right).-\left( {k-j} \right).{j \mathord{\left/ {\vphantom {j n}} \right. \kern-\nulldelimiterspace} n}.\left( {{\rm 1}-{k \mathord{\left/ {\vphantom {k n}} \right. \kern-\nulldelimiterspace} n}} \right){\plus}\left( {n-k} \right).{j \mathord{\left/ {\vphantom {j n}} \right. \kern-\nulldelimiterspace} n}.{k \mathord{\left/ {\vphantom {k n}} \right. \kern-\nulldelimiterspace} n}} \right\} \cr & \quad \quad \quad \quad \,{\equals}\, j\left( {{\rm 1}-{k \mathord{\left/ {\vphantom {k n}} \right. \kern-\nulldelimiterspace} n}} \right)\sigma ^{{\rm 2}} $$
A2.3. In section 2.8, we state that Var[Df(t, j)]=(1−1/n).σ 2 and Covar[Df(t, j), Df(t, k)]=−σ 2/n. We have
 $$\eqalignno{ & Df\left( {t,\,j} \right)\,{\equals}\,\sigma .Z^{{\asterisk}} \left( {t,\,j} \right) \cr & E\left[ {Df\left( {t,\,j} \right)} \right]\,{\equals}\,{\rm 0} $$
Hence
 $$\eqalignno{ {\rm Var}\left[ {Df\left( {t,\,j} \right)} \right]\,{\equals}\, & E\left[ {Df\left( {t,\,j} \right)^{{\rm 2}} } \right] \cr \,{\equals}\, & \sigma ^{{\rm 2}} E\left[ {Z^{{\asterisk}} \left( {t,\,j} \right)^{{\rm 2}} } \right] \cr \,{\equals}\, & \sigma ^{{\rm 2}} {{\left( {n-{\rm 1}} \right)} \mathord{\left/ {\vphantom {{\left( {n-{\rm 1}} \right)} n}} \right. \kern-\nulldelimiterspace} n}\,{\equals}\,\left( {{\rm 1}-{1 \mathord{\left/ {\vphantom {1 n}} \right. \kern-\nulldelimiterspace} n}} \right).\sigma ^{{\rm 2}} \cr {\rm Covar}\left[ {Df\left( {t,\,j} \right),Df\left( {t,\,k} \right)} \right]\,{\equals}\, & E\left[ {Df\left( {t,\,j} \right).Df\left( {t,\,k} \right)} \right] \cr \,{\equals}\,& E\left[ {Z^{{\asterisk}} \left( {t,\,j} \right).Z^{{\asterisk}} \left( {t,\,k} \right)} \right] \cr \,{\equals}\, & -\!{{\sigma ^{{\rm 2}} } \mathord{\left/ {\vphantom {{\sigma ^{{\rm 2}} } n}} \right. \kern-\nulldelimiterspace} n} $$
A2.4. In section 2.8, we also state that Σ j=1,n Df(t, j)=0 with certainty
 $$\eqalignno{ \mathop{\sum}\limits_{j\,{\equals}\,{\rm 1},n} {Df\left( {t,\,j} \right)} \,{\equals}\, & \mathop{\sum}\limits_{j\,{\equals}\,{\rm 1},n} {\left\{ {\sigma .Z^{{\asterisk}} \left( {t,\,j} \right)} \right\}} \cr \,{\equals}\, & \sigma \,\mathop{\sum}\limits_{j\,{\equals}\,{\rm 1},n} {\left\{ {Z^{{\asterisk}} \left( {t,\,j} \right)} \right\}} \cr \,{\equals}\, & {\rm 0} $$
We also have
 $$\mathop{\sum}\limits_{j\,{\equals}\,{\rm 1},n} {Df\left( {t,\,j} \right)^{{\rm 2}} } \,{\equals}\,\left( {n-{\rm 1}} \right).\sigma ^{{\rm 2}} $$
A2.5. In section 2.9, we state that Var[Du(t, j)]=σ 2 and that Covar[Du(t, j), Du(t, k)]=0.
 $$\eqalignno{ Du\left( {t,\,j} \right)\,{\equals}\, & X\left( {t,\,j} \right)-E_{{\rm 3}} X\left( {t,\,j} \right) \cr \,{\equals}\, & \sigma _{y} .{{Z\left( t \right)} \mathord{\left/ {\vphantom {{Z\left( t \right)} n}} \right. \kern-\nulldelimiterspace} n}{\plus}\sigma {\rm }Z^{{\asterisk}} \left( {t,\,j} \right) \cr \,{\equals}\, & \sigma _{y} .{{Z\left( t \right)} \mathord{\left/ {\vphantom {{Z\left( t \right)} n}} \right. \kern-\nulldelimiterspace} n}{\plus}\sigma \left\{ {Z\left( {t,\,j} \right)-\mathop{\sum}\limits_{i\,{\equals}\,{\rm 1},n} {{{Z\left( {t,\,i} \right)} \mathord{\left/ {\vphantom {{Z\left( {t,\,i} \right)} n}} \right. \kern-\nulldelimiterspace} n}} } \right\} $$
 $$\eqalignno{ E\left[ {Du\left( {t,\,j} \right)} \right]\,{\equals}\, & {\rm 0} \cr {\rm Var}\left[ {Du\left( {t,\,j} \right)} \right]\,{\equals}\, & E\left[ {\left\{ {\sigma _{y} .{{Z\left( t \right)} \mathord{\left/ {\vphantom {{Z\left( t \right)} n}} \right. \kern-\nulldelimiterspace} n}{\plus}\sigma \left\{ {Z\left( {t,\,j} \right)-\mathop{\sum}\limits_{i\,{\equals}\,{\rm 1},n} {{{Z\left( {t,\,i} \right)} \mathord{\left/ {\vphantom {{Z\left( {t,\,i} \right)} n}} \right. \kern-\nulldelimiterspace} n}} } \right\}} \right\}^{{\rm 2}} } \right] \cr \,{\equals}\, & E\left[ {\left\{ {\sigma {\sqrt n.{{Z\left( t \right)} \mathord{\left/ {\vphantom {{Z\left( t \right)} n}} \right. \kern-\nulldelimiterspace} n}} {\plus}\sigma \left\{ {Z\left( {t,\,j} \right)-\mathop{\sum}\limits_{i\,{\equals}\,{\rm 1},n} {{{Z\left( {t,\,i} \right)} \mathord{\left/ {\vphantom {{Z\left( {t,\,i} \right)} n}} \right. \kern-\nulldelimiterspace} n}} } \right\}} \right\}^{{\rm 2}} } \right] \cr \,{\equals}\, & \sigma ^{{\rm 2}} \left\{ {{n \mathord{\left/ {\vphantom {n {n^{{\rm 2}} }}} \right. \kern-\nulldelimiterspace} {n^{{\rm 2}} }}{\plus}\left( {{\rm 1}-{1 \mathord{\left/ {\vphantom {1 n}} \right. \kern-\nulldelimiterspace} n}} \right)^{{\rm 2}} {\plus}{{\left( {n-{\rm 1}} \right)} \mathord{\left/ {\vphantom {{\left( {n-{\rm 1}} \right)} n}} \right. \kern-\nulldelimiterspace} n}^{{\rm 2}} } \right\} \cr \,{\equals}\, & \sigma ^{{\rm 2}} $$
 $$\eqalignno{ {\rm Covar}\left[ {Du\left( {t,\,j} \right),Du\left( {t,\,k} \right)} \right]\,{\equals}\, & E\left[ {Du\left( {t,\,j} \right).Du\left( {t,\,k} \right)} \right] \cr \,{\equals}\, & E\left[ {\left\{ {\sigma {\sqrt n.{{Z\left( t \right)} \mathord{\left/ {\vphantom {{Z\left( t \right)} n}} \right. \kern-\nulldelimiterspace} n}} {\plus}\sigma Z^{{\asterisk}} \left( {t,\,j} \right)} \right\}.\left\{ {\sigma {\sqrt n.{{Z\left( t \right)} \mathord{\left/ {\vphantom {{Z\left( t \right)} n}} \right. \kern-\nulldelimiterspace} n}} {\plus}\sigma Z^{{\asterisk}} \left( {t,k} \right)} \right\}} \right] \cr \,{\equals}\, & \sigma ^{{\rm 2}} {1 \mathord{\left/ {\vphantom {1 n}} \right. \kern-\nulldelimiterspace} n}-{{\sigma ^{{\rm 2}} } \mathord{\left/ {\vphantom {{\sigma ^{{\rm 2}} } n}} \right. \kern-\nulldelimiterspace} n} \cr \,{\equals}\, & {\rm 0} $$
A3. The Ornstein-Uhlenbeck bridge
A3.1. We next deal with the OU bridge, discussed in section 3. In section 3.3, we state that ∑ j=1,n {α n−j .Z*(t, j)}=0, E[Z*(t, j)]=0, Var[Z*(t, j)]=(1−α 2(n−j)/s n ) and also that if j≠k Covar[Z*(t, j), Z*(t, k)]=−α n−j α n−k /s n .
 $$Z^{{\asterisk}} \left( {t,\,j} \right)\,{\equals}\,Z\left( {t,\,j} \right)-\alpha ^{{n-j}} {{\left\{ {\mathop{\sum}\limits_{h\,{\equals}\,{\rm 1},n} {\alpha ^{{n-h}} Z\left( {t,\,h} \right)} } \right\}} \mathord{\left/ {\vphantom {{\left\{ {\mathop{\sum}\limits_{h\,{\equals}\,{\rm 1},n} {\alpha ^{{n-h}} Z\left( {t,\,h} \right)} } \right\}} {s_{n} }}} \right. \kern-\nulldelimiterspace} {s_{n} }}$$
We know that E[Z(t, j)]=0 for all j, so E[Z*(t, j)=0]
 $$\eqalignno{ \mathop{\sum}\limits_{j\,{\equals}\,{\rm 1},n} {\left\{ {\alpha ^{{n-j}} .Z^{{\asterisk}} \left( {t,\,j} \right)} \right\}} \,{\equals}\, & \mathop{\sum}\limits_{j\,{\equals}\,{\rm 1},n} {\alpha ^{{n-j}} } .\left\{ {Z\left( {t,\,j} \right)-\alpha ^{{n-j}} {{\left\{ {\mathop{\sum}\limits_{h\,{\equals}\,{\rm 1},n} {\alpha ^{{n-h}} Z\left( {t,\,h} \right)} } \right\}} \mathord{\left/ {\vphantom {{\left\{ {\mathop{\sum}\limits_{h\,{\equals}\,{\rm 1},n} {\alpha ^{{n-h}} Z\left( {t,\,h} \right)} } \right\}} {s_{n} }}} \right. \kern-\nulldelimiterspace} {s_{n} }}} \right\} \cr \,{\equals}\, & \mathop{\sum}\limits_{j\,{\equals}\,{\rm 1},n} {\alpha ^{{n-j}} } .\left\{ {Z\left( {t,\,j} \right)} \right\}-\mathop{\sum}\limits_{j\,{\equals}\,{\rm 1},n} {\alpha ^{{{\rm 2}\left( {n-j} \right)}} } {{\left\{ {\mathop{\sum}\limits_{h\,{\equals}\,{\rm 1},n} {\alpha ^{{n-h}} Z\left( {t,\,h} \right)} } \right\}} \mathord{\left/ {\vphantom {{\left\{ {\mathop{\sum}\limits_{h\,{\equals}\,{\rm 1},n} {\alpha ^{{n-h}} Z\left( {t,\,h} \right)} } \right\}} {s_{n} }}} \right. \kern-\nulldelimiterspace} {s_{n} }} \cr \,{\equals}\, & \mathop{\sum}\limits_{j\,{\equals}\,{\rm 1},n} {\alpha ^{{n-j}} } .\left\{ {Z\left( {t,\,j} \right)} \right\}-s_{n} {{\left\{ {\mathop{\sum}\limits_{h\,{\equals}\,{\rm 1},n} {\alpha ^{{n-h}} Z\left( {t,\,h} \right)} } \right\}} \mathord{\left/ {\vphantom {{\left\{ {\mathop{\sum}\limits_{h\,{\equals}\,{\rm 1},n} {\alpha ^{{n-h}} Z\left( {t,\,h} \right)} } \right\}} {s_{n} }}} \right. \kern-\nulldelimiterspace} {s_{n} }} \cr \,{\equals}\, & {\rm 0} $$
 $$\eqalignno{ {\rm Var}\left[ {Z^{{\asterisk}} \left( {t,\,j} \right)} \right]\,{\equals}\, & E\left[ {\left\{ {Z\left( {t,\,j} \right)-\alpha ^{{n-j}} {{\left\{ {\mathop{\sum}\limits_{h\,{\equals}\,{\rm 1},n} {\alpha ^{{n-h}} Z\left( {t,\,h} \right)} } \right\}} \mathord{\left/ {\vphantom {{\left\{ {\mathop{\sum}\limits_{h\,{\equals}\,{\rm 1},n} {\alpha ^{{n-h}} Z\left( {t,\,h} \right)} } \right\}} {s_{n} }}} \right. \kern-\nulldelimiterspace} {s_{n} }}} \right\}^{{\rm 2}} } \right] \cr \,{\equals}\, & E\left[ {Z\left( {t,\,j} \right)^{{\rm 2}} -{\rm 2}\alpha ^{{{\rm 2}\left( {n-j} \right)}} {{Z\left( {t,\,j} \right)^{{\rm 2}} } \mathord{\left/ {\vphantom {{Z\left( {t,\,j} \right)^{{\rm 2}} } {s_{n} }}} \right. \kern-\nulldelimiterspace} {s_{n} }}{\plus}\alpha ^{{{\rm 2}\left( {n-j} \right)}} \left\{ {\mathop{\sum}\limits_{h\,{\equals}\,{\rm 1},n} {\alpha ^{{{\rm 2}(n-h)}} Z\left( {t,\,h} \right)^{{\rm 2}} \,/\,s_{n}^{{\rm 2}} } } \right\}} \right] \cr \,{\equals}\, & {\rm 1}-{\rm 2}\alpha ^{{{\rm 2}\left( {n-j} \right)}} \,/\,s_{n} {\plus}\alpha ^{{{\rm 2}\left( {n-j} \right)}} {{\left\{ {\mathop{\sum}\limits_{h\,{\equals}\,{\rm 1},n} {\alpha ^{{{\rm 2}\left( {n-h} \right)}} } } \right\}} \mathord{\left/ {\vphantom {{\left\{ {\mathop{\sum}\limits_{h\,{\equals}\,{\rm 1},n} {\alpha ^{{{\rm 2}\left( {n-h} \right)}} } } \right\}} {s_{n}^{2} }}} \right. \kern-\nulldelimiterspace} {s_{n}^{2} }} \cr \,{\equals}\, & {\rm 1}-{{{\rm 2}\alpha ^{{{\rm 2}\left( {n-j} \right)}} } \mathord{\left/ {\vphantom {{{\rm 2}\alpha ^{{{\rm 2}\left( {n-j} \right)}} } {s_{n} }}} \right. \kern-\nulldelimiterspace} {s_{n} }}{\plus}{{\alpha ^{{{\rm 2}\left( {n-j} \right)}} s_{n} } \mathord{\left/ {\vphantom {{\alpha ^{{{\rm 2}\left( {n-j} \right)}} s_{n} } {s_{n}^{2} }}} \right. \kern-\nulldelimiterspace} {s_{n}^{2} }} \cr \,{\equals}\, & {\rm 1}-{{\alpha ^{{{\rm 2}\left( {n-j} \right)}} } \mathord{\left/ {\vphantom {{\alpha ^{{{\rm 2}\left( {n-j} \right)}} } {s_{n} }}} \right. \kern-\nulldelimiterspace} {s_{n} }}$$
If j≠k
 $$\eqalignno{ {\rm Covar}\left[ {Z^{{\asterisk}} \left( {t,\,j} \right),Z^{{\asterisk}} \left( {t,\,k} \right)} \right]\,&{\equals}\,E\left[ {Z^{{\asterisk}} \left( {t,\,j} \right).Z^{{\asterisk}} \left( {t,\,k} \right)} \right] \cr &\,{\equals}\, E\left[ {\left\{ {Z\left( {t,\,j} \right)-\alpha ^{{n-j}} {{\left\{ {\mathop{\sum}\limits_{h\,{\equals}\,{\rm 1},n} {\alpha ^{{n-h}} Z\left( {t,\,h} \right)} } \right\}} \mathord{\left/ {\vphantom {{\left\{ {\mathop{\sum}\limits_{h\,{\equals}\,{\rm 1},n} {\alpha ^{{n-h}} Z\left( {t,\,h} \right)} } \right\}} {s_{n} }}} \right. \kern-\nulldelimiterspace} {s_{n} }}} \right\}} \right. \cr & \qquad. \left. {\left\{ {Z\left( {t,\,k} \right)-\alpha ^{{n-k}} .{{\left\{ {\mathop{\sum}\limits_{h\,{\equals}\,{\rm 1},n} {\alpha ^{{n-h}} Z\left( {t,\,h} \right)} } \right\}} \mathord{\left/ {\vphantom {{\left\{ {\mathop{\sum}\limits_{h\,{\equals}\,{\rm 1},n} {\alpha ^{{n-h}} Z\left( {t,\,h} \right)} } \right\}} {s_{n} }}} \right. \kern-\nulldelimiterspace} {s_{n} }}} \right\}} \right] \cr &\,{\equals}\, E\left[ {-Z\left( {t,\,j} \right)\alpha ^{{n-k}} \alpha ^{{n-j}} {{Z\left( {t,\,j} \right)} \mathord{\left/ {\vphantom {{Z\left( {t,\,j} \right)} {s_{n} }}} \right. \kern-\nulldelimiterspace} {s_{n} }}-Z\left( {t,\,k} \right)\alpha ^{{n-j}} \alpha ^{{n-k}} {{Z\left( {t,\,k} \right)} \mathord{\left/ {\vphantom {{Z\left( {t,\,k} \right)} {s_{n} }}} \right. \kern-\nulldelimiterspace} {s_{n} }}} \right. \cr &\left. \quad {{\plus}\alpha ^{{n-j}} \alpha ^{{n-k}} {{\left\{ {\mathop{\sum}\limits_{h\,{\equals}\,{\rm 1},n} {\alpha ^{{n-h}} Z\left( {t,\,h} \right)\alpha ^{{n-h}} Z\left( {t,\,h} \right)} } \right\}} \mathord{\left/ {\vphantom {{\left\{ {\mathop{\sum}\limits_{h\,{\equals}\,{\rm 1},n} {\alpha ^{{n-h}} Z\left( {t,\,h} \right)\alpha ^{{n-h}} Z\left( {t,\,h} \right)} } \right\}} {s_{n}^{{\rm 2}} }}} \right. \kern-\nulldelimiterspace} {s_{n}^{{\rm 2}} }}} \right] \cr &\,{\equals}\, \alpha ^{{n-j}} .\alpha ^{{n-k}} \left\{ {-{{\rm 2} \mathord{\left/ {\vphantom {{\rm 2} {s_{n} }}} \right. \kern-\nulldelimiterspace} {s_{n} }}{\plus}\mathop{\sum}\limits_{h\,{\equals}\,{\rm 1},n} {{{\alpha ^{{{\rm 2}\left( {n-h} \right)}} } \mathord{\left/ {\vphantom {{\alpha ^{{{\rm 2}\left( {n-h} \right)}} } {s_{n}^{{\rm 2}} }}} \right. \kern-\nulldelimiterspace} {s_{n}^{{\rm 2}} }}} } \right\} \cr &\,{\equals}\, \alpha ^{{n-j}} \alpha ^{{n-k}} \left\{ {-{{\rm 2} \mathord{\left/ {\vphantom {{\rm 2} {s_{n} }}} \right. \kern-\nulldelimiterspace} {s_{n} }}{\plus}{{\rm 1} \mathord{\left/ {\vphantom {{\rm 1} {s_{n} }}} \right. \kern-\nulldelimiterspace} {s_{n} }}} \right\} \cr &\,{\equals}\, -{{\alpha ^{{n-j}} \alpha ^{{n-k}} } \mathord{\left/ {\vphantom {{\alpha ^{{n-j}} \alpha ^{{n-k}} } {s_{n} }}} \right. \kern-\nulldelimiterspace} {s_{n} }} $$
A3.2. In section 3.5, we state that for the OU bridge E 1 X(t, j) is calculated as
 $$\eqalignno{ & E_{{\rm 1}} X\left( {t,\,j} \right)\,{\equals}\,\mu {\plus}\alpha ^{j} \left( {X\left( {t,\,{\rm 0}} \right)-\mu } \right){\plus}\mathop{\sum}\limits_{i\,{\equals}\,1,j} {\alpha ^{{n-i}} .\alpha ^{{j-i}} .\lambda \left( t \right)} \cr & \,{\equals}\,{{{{\mu {\plus}\left( {X\left( {t,\,{\rm 0}} \right)-\mu } \right).\alpha ^{j} .\left( {{\rm 1}-\alpha ^{{{\rm 2}\left( {n-j} \right)}} } \right)} \mathord{\left/ {\vphantom {{\mu {\plus}\left( {X\left( {t,\,{\rm 0}} \right)-\mu } \right).\alpha ^{j} .\left( {{\rm 1}-\alpha ^{{{\rm 2}\left( {n-j} \right)}} } \right)} {\left( {{\rm 1}-\alpha ^{{{\rm 2}n}} } \right){\plus}\left( {X\left( {t{\plus}{\rm 1},\,{\rm 0}} \right)-\mu } \right).\alpha ^{{n-j}} .\left( {{\rm 1}-\alpha ^{{{\rm 2}j}} } \right)}}} \right. \kern-\nulldelimiterspace} {\left( {{\rm 1}-\alpha ^{{{\rm 2}n}} } \right){\plus}\left( {X\left( {t{\plus}{\rm 1},\,{\rm 0}} \right)-\mu } \right).\alpha ^{{n-j}} .\left( {{\rm 1}-\alpha ^{{{\rm 2}j}} } \right)}}} \mathord{\left/ {\vphantom {{{{\mu {\plus}\left( {X\left( {t,\,{\rm 0}} \right)-\mu } \right).\alpha ^{j} .\left( {{\rm 1}-\alpha ^{{{\rm 2}\left( {n-j} \right)}} } \right)} \mathord{\left/ {\vphantom {{\mu {\plus}\left( {X\left( {t,\,{\rm 0}} \right)-\mu } \right).\alpha ^{j} .\left( {{\rm 1}-\alpha ^{{{\rm 2}\left( {n-j} \right)}} } \right)} {\left( {{\rm 1}-\alpha ^{{{\rm 2}n}} } \right){\plus}\left( {X\left( {t{\plus}{\rm 1},\,{\rm 0}} \right)-\mu } \right).\alpha ^{{n-j}} .\left( {{\rm 1}-\alpha ^{{{\rm 2}j}} } \right)}}} \right. \kern-\nulldelimiterspace} {\left( {{\rm 1}-\alpha ^{{{\rm 2}n}} } \right){\plus}\left( {X\left( {t{\plus}{\rm 1},\,{\rm 0}} \right)-\mu } \right).\alpha ^{{n-j}} .\left( {{\rm 1}-\alpha ^{{{\rm 2}j}} } \right)}}} {\left( {{\rm 1}-\alpha ^{{{\rm 2}n}} } \right)}}} \right. \kern-\nulldelimiterspace} {\left( {{\rm 1}-\alpha ^{{{\rm 2}n}} } \right)}} $$
We have
 $\quad \lambda \left( t \right)\,{\equals}\,{{\left\{ {X\left( {t{\plus}{\rm 1},\,{\rm 0}} \right)-\mu -\alpha ^{n} \left( {X\left( {t,\,{\rm 0}} \right)-\mu } \right)} \right\}} \mathord{\left/ {\vphantom {{\left\{ {X\left( {t{\plus}{\rm 1},\,{\rm 0}} \right)-\mu -\alpha ^{n} \left( {X\left( {t,\,{\rm 0}} \right)-\mu } \right)} \right\}} {s_{n} }}} \right. \kern-\nulldelimiterspace} {s_{n} }} $
 $$\hskip-19pc \rm and \quad s_{n} \,{\equals}\,{{\left( {{\rm 1}-\alpha ^{{{\rm 2}n}} } \right)} \mathord{\left/ {\vphantom {{\left( {{\rm 1}-\alpha ^{{{\rm 2}n}} } \right)} {\left( {{\rm 1}-\alpha ^{{\rm 2}} } \right)}}} \right. \kern-\nulldelimiterspace} {\left( {{\rm 1}-\alpha ^{{\rm 2}} } \right)}}$$
 $$\eqalignno{ \mathop{\sum}\limits_{i\,{\equals}\,{\rm 1},j} {\alpha ^{{n-i}} .\alpha ^{{j-i}} } &\,{\equals}\,\alpha ^{{n-j}} \mathop{\sum}\limits_{i\,{\equals}\,{\rm 1},j} {\alpha ^{{{\rm 2}(j-i)}} } \cr & \,{\equals}\,\alpha ^{{n-j}} .\mathop{\sum}\limits_{i\,{\equals}\,{\rm 1},j} {\alpha ^{{{\rm 2}\left( {i-1} \right)}} } \cr & \,{\equals}\,\alpha ^{{n-j}} .{\rm }s_{j} \cr & \,{\equals}\,{{\alpha ^{{n-j}} \left( {{\rm 1}-\alpha ^{{{\rm 2}j}} } \right)} \mathord{\left/ {\vphantom {{\alpha ^{{n-j}} \left( {{\rm 1}-\alpha ^{{{\rm 2}j}} } \right)} {\left( {{\rm 1}-\alpha ^{{\rm 2}} } \right)}}} \right. \kern-\nulldelimiterspace} {\left( {{\rm 1}-\alpha ^{{\rm 2}} } \right)}} $$
 $$\eqalignno{ & {\rm So}\quad E_{{\rm 1}} X\left( {t,\,j} \right)\,{\equals}\,\mu {\plus}\alpha ^{j} \left( {X\left( {t,\,{\rm 0}} \right)-\mu } \right) \cr & \qquad \quad {\plus}{{\alpha ^{{n-j}} \left( {{\rm 1}-\alpha ^{{{\rm 2}j}} } \right)} \mathord{\left/ {\vphantom {{\alpha ^{{n-j}} \left( {{\rm 1}-\alpha ^{{{\rm 2}j}} } \right)} {\left( {{\rm 1}-\alpha ^{{\rm 2}} } \right){{\left\{ {X\left( {t{\plus}{\rm 1},\,{\rm 0}} \right)-\mu -\alpha ^{n} \left( {X\left( {t,\,{\rm 0}} \right)-\mu } \right)} \right\}} \mathord{\left/ {\vphantom {{\left\{ {X\left( {t{\plus}{\rm 1},\,{\rm 0}} \right)-\mu -\alpha ^{n} \left( {X\left( {t,\,{\rm 0}} \right)-\mu } \right)} \right\}} {\left\{ {{{\left( {{\rm 1}-\alpha ^{{{\rm 2}n}} } \right)} \mathord{\left/ {\vphantom {{\left( {{\rm 1}-\alpha ^{{{\rm 2}n}} } \right)} {\left( {{\rm 1}-\alpha ^{{\rm 2}} } \right)}}} \right. \kern-\nulldelimiterspace} {\left( {{\rm 1}-\alpha ^{{\rm 2}} } \right)}}} \right\}}}} \right. \kern-\nulldelimiterspace} {\left\{ {{{\left( {{\rm 1}-\alpha ^{{{\rm 2}n}} } \right)} \mathord{\left/ {\vphantom {{\left( {{\rm 1}-\alpha ^{{{\rm 2}n}} } \right)} {\left( {{\rm 1}-\alpha ^{{\rm 2}} } \right)}}} \right. \kern-\nulldelimiterspace} {\left( {{\rm 1}-\alpha ^{{\rm 2}} } \right)}}} \right\}}}}}} \right. \kern-\nulldelimiterspace} {\left( {{\rm 1}-\alpha ^{{\rm 2}} } \right){{\left\{ {X\left( {t{\plus}{\rm 1},\,{\rm 0}} \right)-\mu -\alpha ^{n} \left( {X\left( {t,\,{\rm 0}} \right)-\mu } \right)} \right\}} \mathord{\left/ {\vphantom {{\left\{ {X\left( {t{\plus}{\rm 1},\,{\rm 0}} \right)-\mu -\alpha ^{n} \left( {X\left( {t,\,{\rm 0}} \right)-\mu } \right)} \right\}} {\left\{ {{{\left( {{\rm 1}-\alpha ^{{{\rm 2}n}} } \right)} \mathord{\left/ {\vphantom {{\left( {{\rm 1}-\alpha ^{{{\rm 2}n}} } \right)} {\left( {{\rm 1}-\alpha ^{{\rm 2}} } \right)}}} \right. \kern-\nulldelimiterspace} {\left( {{\rm 1}-\alpha ^{{\rm 2}} } \right)}}} \right\}}}} \right. \kern-\nulldelimiterspace} {\left\{ {{{\left( {{\rm 1}-\alpha ^{{{\rm 2}n}} } \right)} \mathord{\left/ {\vphantom {{\left( {{\rm 1}-\alpha ^{{{\rm 2}n}} } \right)} {\left( {{\rm 1}-\alpha ^{{\rm 2}} } \right)}}} \right. \kern-\nulldelimiterspace} {\left( {{\rm 1}-\alpha ^{{\rm 2}} } \right)}}} \right\}}}}} \cr & \qquad \,{\equals}\,\mu {\plus}{{\left\{ {\left( {X\left( {t,\,{\rm 0}} \right)-\mu } \right).\alpha ^{j} \left( {{\rm 1}-\alpha ^{{{\rm 2}(n-j)}} } \right){\plus}\left( {X\left( {t{\plus}{\rm 1},\,{\rm 0}} \right)-\mu } \right)\alpha ^{{n-j}} \left( {{\rm 1}-\alpha ^{{{\rm 2}j}} } \right)} \right\}} \mathord{\left/ {\vphantom {{\left\{ {\left( {X\left( {t,\,{\rm 0}} \right)-\mu } \right).\alpha ^{j} \left( {{\rm 1}-\alpha ^{{{\rm 2}(n-j)}} } \right){\plus}\left( {X\left( {t{\plus}{\rm 1},\,{\rm 0}} \right)-\mu } \right)\alpha ^{{n-j}} \left( {{\rm 1}-\alpha ^{{{\rm 2}j}} } \right)} \right\}} {\left( {{\rm 1}-\alpha ^{{{\rm 2}n}} } \right)}}} \right. \kern-\nulldelimiterspace} {\left( {{\rm 1}-\alpha ^{{{\rm 2}n}} } \right)}} $$
Barczy & Kern assume that μ=0, use a continuous parameter q=ln(α) and then express this expectation as the equivalent of
 $$\equals \, {{{{X\left( {t,\,{\rm 0}} \right).{\rm sinh}\left( {q\left( {n-j} \right)} \right)} \mathord{\left/ {\vphantom {{X\left( {t,\,{\rm 0}} \right).{\rm sinh}\left( {q\left( {n-j} \right)} \right)} {\sinh \left( {qn} \right){\plus}X\left( {t{\plus}{\rm 1},\,{\rm 0}} \right).{\rm sinh}\left( {qj} \right)}}} \right. \kern-\nulldelimiterspace} {\sinh \left( {qn} \right){\plus}X\left( {t{\plus}{\rm 1},\,{\rm 0}} \right).{\rm sinh}\left( {qj} \right)}}} \mathord{\left/ {\vphantom {{{{X\left( {t,\,{\rm 0}} \right).{\rm sinh}\left( {q\left( {n-j} \right)} \right)} \mathord{\left/ {\vphantom {{X\left( {t,\,{\rm 0}} \right).{\rm sinh}\left( {q\left( {n-j} \right)} \right)} {\sinh \left( {qn} \right){\plus}X\left( {t{\plus}{\rm 1},\,{\rm 0}} \right).{\rm sinh}\left( {qj} \right)}}} \right. \kern-\nulldelimiterspace} {\sinh \left( {qn} \right){\plus}X\left( {t{\plus}{\rm 1},\,{\rm 0}} \right).{\rm sinh}\left( {qj} \right)}}} {{\rm sinh}\left( {qn} \right)}}} \right. \kern-\nulldelimiterspace} {{\rm sinh}\left( {qn} \right)}}$$
A3.3. In section 3.5, we state that for the OU bridge
 $$\eqalignno{ & {\rm Var}\left[ {Ds\left( {t,\,j} \right)} \right]\,{\equals}\,{{\left\{ {\left( {{\rm 1}-\alpha ^{{{\rm 2}(n-j)}} } \right).\left( {{\rm 1}-\alpha ^{{{\rm 2}j}} } \right)} \right\}} \mathord{\left/ {\vphantom {{\left\{ {\left( {{\rm 1}-\alpha ^{{{\rm 2}(n-j)}} } \right).\left( {{\rm 1}-\alpha ^{{{\rm 2}j}} } \right)} \right\}} {\left\{ {\left( {{\rm 1}-\alpha ^{{\rm 2}} } \right)\,\left( {{\rm 1}-\alpha ^{{{\rm 2}n}} } \right)} \right\}\sigma ^{{\rm 2}} }}} \right. \kern-\nulldelimiterspace} {\left\{ {\left( {{\rm 1}-\alpha ^{{\rm 2}} } \right)\,\left( {{\rm 1}-\alpha ^{{{\rm 2}n}} } \right)} \right\}\sigma ^{{\rm 2}} }} \cr & {\rm and}\,{\rm Covar}\left[ {Ds\left( {t,\,j} \right),\,Ds\left( {t,\,k} \right)} \right]\,{\equals}\,{{\left\{ {\alpha ^{{k-j}} \left( {{\rm 1}-\alpha ^{{{\rm 2}\left( {n-k} \right)}} } \right).\left( {{\rm 1}-\alpha ^{{{\rm 2}j}} } \right)} \right\}} \mathord{\left/ {\vphantom {{\left\{ {\alpha ^{{k-j}} \left( {{\rm 1}-\alpha ^{{{\rm 2}\left( {n-k} \right)}} } \right).\left( {{\rm 1}-\alpha ^{{{\rm 2}j}} } \right)} \right\}} {\left\{ {\left( {{\rm 1}-\alpha ^{{\rm 2}} } \right)\,\left( {{\rm 1}-\alpha ^{{{\rm 2}n}} } \right)} \right\}\sigma ^{{\rm 2}} }}} \right. \kern-\nulldelimiterspace} {\left\{ {\left( {{\rm 1}-\alpha ^{{\rm 2}} } \right)\,\left( {{\rm 1}-\alpha ^{{{\rm 2}n}} } \right)} \right\}\sigma ^{{\rm 2}} }} $$
We have
 $$Ds\left( {t,\,j} \right)\,{\equals}\,\sigma .\mathop{\sum}\limits_{i\,{\equals}\,{\rm 1},j} {\alpha ^{{j-i}} .Z^{{\asterisk}} \left( {t,\,i} \right)} $$
, so
 $$E\left[ {Ds\left( {t,\,j} \right)} \right]\,{\equals}\,{\rm 0}$$
. Then
 $$\eqalignno{ Ds\left( {t,\,j} \right)\,{\equals}\, & \sigma .\mathop{\sum}\limits_{i\,{\equals}\,{\rm 1},j} {\alpha ^{{j-i}} .Z^{{\asterisk}} \left( {t,\,i} \right)} \cr \,{\equals}\, & \sigma .\mathop{\sum}\limits_{i\,{\equals}\,{\rm 1},j} {\alpha ^{{j-i}} .\left\{ {Z\left( {t,\,i} \right)-\alpha ^{{n-i}} {{\left\{ {\mathop{\sum}\limits_{h\,{\equals}\,{\rm 1},n} {\alpha ^{n} ^{{^-{^h}}} Z\left( {t,\,h} \right)} } \right\}} \mathord{\left/ {\vphantom {{\left\{ {\mathop{\sum}\limits_{h\,{\equals}\,{\rm 1},n} {\alpha ^{n} ^{{-h}} Z\left( {t,\,h} \right)} } \right\}} {s_{n} }}} \right. \kern-\nulldelimiterspace} {s_{n} }}} \right\}} \cr \,{\equals}\, & \sigma .{{\mathop{\sum}\limits_{i\,{\equals}\,{\rm 1},j} {\left\{ {\alpha ^{{j-i}} .Z\left( {t,\,i} \right)} \right\}-\sigma .\mathop{\sum}\limits_{i\,{\equals}\,{\rm 1},j} {\left\{ {\alpha ^{{j-i}} .\alpha ^{{n-i}} \mathop{\sum}\limits_{h\,{\equals}\,{\rm 1},n} {\alpha ^{{n-h}} Z\left( {t,\,h} \right)} } \right\}} } } \mathord{\left/ {\vphantom {{\mathop{\sum}\limits_{i\,{\equals}\,{\rm 1},j} {\left\{ {\alpha ^{{j-i}} .Z\left( {t,\,i} \right)} \right\}-\sigma .\mathop{\sum}\limits_{i\,{\equals}\,{\rm 1},j} {\left\{ {\alpha ^{{j-i}} .\alpha ^{{n-i}} \mathop{\sum}\limits_{h\,{\equals}\,{\rm 1},n} {\alpha ^{{n-h}} Z\left( {t,\,h} \right)} } \right\}} } } {s_{n} }}} \right. \kern-\nulldelimiterspace} {s_{n} }} \cr \,{\equals}\, & \sigma .{{\mathop{\sum}\limits_{i\,{\equals}\,{\rm 1},j} {\left\{ {\alpha ^{{j-i}} .Z\left( {t,\,i} \right)} \right\}-\sigma .\alpha ^{{n-j}} s_{j} \left\{ {\mathop{\sum}\limits_{h\,{\equals}\,{\rm 1},n} {\alpha ^{{n-h}} Z\left( {t,\,h} \right)} } \right\}} } \mathord{\left/ {\vphantom {{\mathop{\sum}\limits_{i\,{\equals}\,{\rm 1},j} {\left\{ {\alpha ^{{j-i}} .Z\left( {t,\,i} \right)} \right\}-\sigma .\alpha ^{{n-j}} s_{j} \left\{ {\mathop{\sum}\limits_{h\,{\equals}\,{\rm 1},n} {\alpha ^{{n-h}} Z\left( {t,\,h} \right)} } \right\}} } {s_{n} }}} \right. \kern-\nulldelimiterspace} {s_{n} }} $$
 $$\eqalignno{ {\rm Var}\left[ {Ds\left( {t,\,j} \right)} \right]\,&{\equals}\,E\left[ {Ds\left( {t,\,j} \right)^{{\rm 2}} } \right] \cr & \,{\equals}\,{\rm }E\left[ {\left\{ {\sigma .\mathop{\sum}\limits_{i\,{\equals}\,{\rm 1},j} {{{\left( {\alpha ^{{j-i}} .Z\left( {t,\,i} \right)} \right)-\sigma .\alpha ^{{n-j}} s_{j} \left( {\mathop{\sum}\limits_{h\,{\equals}\,{\rm 1},n} {\alpha ^{{n-h}} Z\left( {t,\,h} \right)} } \right)} \mathord{\left/ {\vphantom {{\left( {\alpha ^{{j-i}} .Z\left( {t,\,i} \right)} \right)-\sigma .\alpha ^{{n-j}} s_{j} \left( {\mathop{\sum}\limits_{h\,{\equals}\,{\rm 1},n} {\alpha ^{{n-h}} Z\left( {t,\,h} \right)} } \right)} {s_{n} }}} \right. \kern-\nulldelimiterspace} {s_{n} }}} } \right\}^{2} } \right] \cr & \,{\equals}\,\sigma ^{{\rm 2}} .\mathop{\sum}\limits_{i\,{\equals}\,{\rm 1},j} {\left( {\alpha ^{{{\rm 2}\left( {j-i} \right)}} } \right)-{\rm 2}.\sigma ^{{\rm 2}} .\mathop{\sum}\limits_{i\,{\equals}\,{\rm 1},j} {\left. {\left( {{{\alpha ^{{j-i}} .\alpha ^{{n-j}} s_{j} .\alpha ^{{n-i}} } \mathord{\left/ {\vphantom {{\alpha ^{{j-i}} .\alpha ^{{n-j}} s_{j} .\alpha ^{{n-i}} } {s_{n} }}} \right. \kern-\nulldelimiterspace} {s_{n} }}} \right.} \right\}} } \cr & \qquad {\plus}\sigma ^{{\rm 2}} .\left. {\left( {{{\alpha ^{{n-j}} s_{j} } \mathord{\left/ {\vphantom {{\alpha ^{{n-j}} s_{j} } {s_{n} }}} \right. \kern-\nulldelimiterspace} {s_{n} }}} \right.} \right\}^{{\rm 2}} .\mathop{\sum}\limits_{h\,{\equals}\,{\rm 1},n} {\left\{ {\alpha ^{{{\rm 2}\left( {n-h} \right)}} } \right\}} \cr & \,{\equals}\,\left\{ {{{s_{j} -{\rm 2}.\alpha ^{{{\rm 2}\left( {n-j} \right)}} s_{j} } \mathord{\left/ {\vphantom {{s_{j} -{\rm 2}.\alpha ^{{{\rm 2}\left( {n-j} \right)}} s_{j} } {s_{n} \mathop{\sum}\limits_{i\,{\equals}\,{\rm 1},j} {\left( {\alpha ^{{{\rm 2}(j-i)}} } \right){\rm }{\plus}{\rm }\left. {\left( {{{\alpha ^{n} ^{{-j}} s_{j} } \mathord{\left/ {\vphantom {{\alpha ^{n} ^{{-j}} s_{j} } {s_{n} }}} \right. \kern-\nulldelimiterspace} {s_{n} }}} \right.} \right\}} }}} \right. \kern-\nulldelimiterspace} {s_{n} \mathop{\sum}\limits_{i\,{\equals}\,{\rm 1},j} {\left( {\alpha ^{{{\rm 2}(j-i)}} } \right){\rm }{\plus}{\rm }\left. {\left( {{{\alpha ^{n} ^{{^-{^j}}} s_{j} } \mathord{\left/ {\vphantom {{\alpha ^{n} ^{{-j}} s_{j} } {s_{n} }}} \right. \kern-\nulldelimiterspace} {s_{n} }}} \right.} \right\}} }}{{\rm ^2}} .s_{n} } \right\}.\,\sigma ^{{\rm 2}} \cr & \,{\equals}\,s_{j} \left( {{\rm 1}-{{\alpha ^{{{\rm 2}\left( {n-j} \right)}} s_{j} } \mathord{\left/ {\vphantom {{\alpha ^{{{\rm 2}\left( {n-j} \right)}} s_{j} } {s_{n} }}} \right. \kern-\nulldelimiterspace} {s_{n} }}} \right).\sigma ^{{\rm 2}} \cr & \,{\equals}\,{\rm }{{\left\{ {\left( {{\rm 1}-\alpha ^{{{\rm 2}j}} } \right)\left( {{\rm 1}-\alpha ^{{{\rm 2}\left( {n-j} \right)}} } \right)} \right\}} \mathord{\left/ {\vphantom {{\left\{ {\left( {{\rm 1}-\alpha ^{{{\rm 2}j}} } \right)\left( {{\rm 1}-\alpha ^{{{\rm 2}\left( {n-j} \right)}} } \right)} \right\}} {\left\{ {\left( {{\rm 1}-\alpha ^{{\rm 2}} } \right)\left( {{\rm 1}-\alpha ^{{{\rm 2}n}} } \right)} \right\}}}} \right. \kern-\nulldelimiterspace} {\left\{ {\left( {{\rm 1}-\alpha ^{{\rm 2}} } \right)\left( {{\rm 1}-\alpha ^{{{\rm 2}n}} } \right)} \right\}}}\sigma ^{{\rm 2}} $$
Barczy & Kern use a continuous standard deviation s, where s 2=−2q.σ 2/(1−α 2) and express this variance as the equivalent of
 $${{s^{{\rm 2}} } \mathord{\left/ {\vphantom {{s^{{\rm 2}} } q}} \right. \kern-\nulldelimiterspace} q}.\,{\rm sinh}\left( {qj} \right).\,{{{\rm sinh}\left( {q\left( {n-j} \right)} \right)} \mathord{\left/ {\vphantom {{{\rm sinh}\left( {q\left( {n-j} \right)} \right)} {{\rm sinh}\left( {qn} \right)}}} \right. \kern-\nulldelimiterspace} {{\rm sinh}\left( {qn} \right)}}$$
If j<k
 $$\eqalignno{ {\rm Covar}\left[ {Ds\left( {t,\,j} \right),Ds\left( {t,\,k} \right)} \right]\,&{\equals}\,E\left[ {Ds\left( {t,\,j} \right).Ds\left( {t,\,k} \right)} \right] \cr & \,{\equals}\,E\left[ {\left\{ {\sigma .\mathop{\sum}\limits_{i\,{\equals}\,{\rm 1},j} {\left( {\alpha ^{{j-i}} .Z\left( {t,\,i} \right)} \right)} -\sigma .\alpha ^{{n-j}} s_{j} {{\left( {\mathop{\sum}\limits_{h\,{\equals}\,{\rm 1},n} {\alpha ^{{n-h}} Z\left( {t,\,h} \right)} } \right)} \mathord{\left/ {\vphantom {{\left( {\mathop{\sum}\limits_{h\,{\equals}\,{\rm 1},n} {\alpha ^{{n-h}} Z\left( {t,\,h} \right)} } \right)} {s_{n} }}} \right. \kern-\nulldelimiterspace} {s_{n} }}} \right\}} \right \cr & \qquad . \, \left. {\left\{ {\sigma .\mathop{\sum}\limits_{i\,{\equals}\,{\rm 1},k} {\left( {\alpha ^{{k-i}} .Z\left( {t,i} \right)} \right)} -\sigma .\alpha ^{{n-k}} s_{k} .{{\left( {\mathop{\sum}\limits_{h\,{\equals}\,{\rm 1},n} {\alpha ^{{n-h}} Z\left( {t,\,h} \right)} } \right)} \mathord{\left/ {\vphantom {{\left( {\mathop{\sum}\limits_{h\,{\equals}\,{\rm 1},n} {\alpha ^{{n-h}} Z\left( {t,\,h} \right)} } \right)} {s_{n} }}} \right. \kern-\nulldelimiterspace} {s_{n} }}} \right\}} \right] \cr & \equals \, E\left[ {\left\{ {\mathop{\sum}\limits_{i\,{\equals}\,{\rm 1},j} {\left( {\alpha ^{{j-i}} .Z\left( {t,\,i} \right)} \right)} -\left( {\mathop{\sum}\limits_{h\,{\equals}\,{\rm 1},n} {\alpha ^{{n-j}} \alpha ^{{n-h}} Z\left( {t,\,h} \right)} } \right){{s_{j} } \mathord{\left/ {\vphantom {{s_{j} } {s_{n} }}} \right. \kern-\nulldelimiterspace} {s_{n} }}} \right\}} \right. \cr & \qquad . \left. {\left\{ {\mathop{\sum}\limits_{i\,{\equals}\,{\rm 1},k} {\left( {\alpha ^{{k-i}} .Z\left( {t,i} \right)} \right)} -\left( {\mathop{\sum}\limits_{h\,{\equals}\,{\rm 1},n} {\alpha ^{n} ^{{^-{^k}}} \alpha ^{n} ^{{^-{^h}}} Z\left( {t,h} \right)} } \right){{s_{k} } \mathord{\left/ {\vphantom {{s_{k} } {s_{n} }}} \right. \kern-\nulldelimiterspace} {s_{n} }}} \right\}} \right].\sigma ^{{\rm 2}} \cr & \equals \, \left\{ {\alpha ^{{k-j}} \mathop{\sum}\limits_{i\,{\equals}\,{\rm 1},j} {\left( {\alpha ^{{-{\rm 2}\left( {j-i} \right)}} } \right)} -\alpha ^{{{\rm 2}n-k-j}} s_{k} \mathop{\sum}\limits_{i\,{\equals}\,{\rm 1},j} {\left. {{{\left( {\alpha ^{{{\rm 2}(j-i)}} } \right)} \mathord{\left/ {\vphantom {{\left( {\alpha ^{{{\rm 2}(j-i)}} } \right)} {s_{n} }}} \right. \kern-\nulldelimiterspace} {s_{n} }}} \right)} } \right. \cr & \qquad -\alpha ^{{{\rm 2}n-j-k}} s_{j} \mathop{\sum}\limits_{i\,{\equals}\,{\rm 1},k} {\left. {{{\left( {\alpha ^{{{\rm 2}\left( {k-i} \right)}} } \right)} \mathord{\left/ {\vphantom {{\left( {\alpha ^{{{\rm 2}\left( {k-i} \right)}} } \right)} {s_{n} }}} \right. \kern-\nulldelimiterspace} {s_{n} }}} \right)} \cr & \left. \qquad {{\plus}\alpha ^{{{\rm 2}n-j-k}} s_{j} \,s_{k} \mathop{\sum}\limits_{h\,{\equals}\,{\rm 1},n} {{{\left( {\alpha ^{{{\rm 2}(n-h)}} } \right)} \mathord{\left/ {\vphantom {{\left( {\alpha ^{{{\rm 2}(n-h)}} } \right)} {s_{n}^{{\rm 2}} }}} \right. \kern-\nulldelimiterspace} {s_{n}^{{\rm 2}} }}} } \right\}.\sigma ^{{\rm 2}} \cr & \,{\equals}\,{\rm }\left\{ {\alpha ^{{k-j}} s_{j} -\alpha ^{{{\rm 2}n-k-j}} s_{k} s_{j} \,/\,s_{n} -\alpha ^{{{\rm 2}n-k-j}} s_{j} s_{k} \,/\,s_{n} {\plus}\alpha ^{{{\rm 2}n-j-k}} s_{j} s_{k} s_{n} \,/\,s_{n} ^{{\rm 2}} } \right\}.\,\sigma ^{{\rm 2}} \cr & \,{\equals}\,{{s_{j} \left\{ {\alpha ^{{k-j}} s_{n} -\alpha ^{{{\rm 2}n-k-j}} s_{k} } \right\}} \mathord{\left/ {\vphantom {{s_{j} \left\{ {\alpha ^{{k-j}} s_{n} -\alpha ^{{{\rm 2}n-k-j}} s_{k} } \right\}} {s_{n} }}} \right. \kern-\nulldelimiterspace} {s_{n} }}.\sigma ^{{\rm 2}} \cr & \,{\equals}\,{{\left( {{\rm 1}-\alpha ^{{{\rm 2}j}} } \right)} \mathord{\left/ {\vphantom {{\left( {{\rm 1}-\alpha ^{{{\rm 2}j}} } \right)} {\left( {{\rm 1}-\alpha ^{{\rm 2}} } \right)}}} \right. \kern-\nulldelimiterspace} {\left( {{\rm 1}-\alpha ^{{\rm 2}} } \right)}}{{\left\{ {\alpha ^{{k-j}} \left( {{\rm 1}-\alpha ^{{{\rm 2}n}} } \right)-\alpha ^{{k-j}} \alpha ^{{{\rm 2}\left( {n-k} \right)}} \left( {{\rm 1}-\alpha ^{{{\rm 2}k}} } \right)} \right\}} \mathord{\left/ {\vphantom {{\left\{ {\alpha ^{{k-j}} \left( {{\rm 1}-\alpha ^{{{\rm 2}n}} } \right)-\alpha ^{{k-j}} \alpha ^{{{\rm 2}\left( {n-k} \right)}} \left( {{\rm 1}-\alpha ^{{{\rm 2}k}} } \right)} \right\}} {\left( {{\rm 1}-\alpha ^{{{\rm 2}n}} } \right)}}} \right. \kern-\nulldelimiterspace} {\left( {{\rm 1}-\alpha ^{{{\rm 2}n}} } \right)}}\sigma ^{{\rm 2}} \cr & \,{\equals}\,{\rm }{{\left\{ {\alpha ^{{k-j}} \left( {{\rm 1}-\alpha ^{{{\rm 2}j}} } \right).\left( {1-\alpha ^{{{\rm 2}\left( {n-k} \right)}} } \right)} \right\}} \mathord{\left/ {\vphantom {{\left\{ {\alpha ^{{k-j}} \left( {{\rm 1}-\alpha ^{{{\rm 2}j}} } \right).\left( {1-\alpha ^{{{\rm 2}\left( {n-k} \right)}} } \right)} \right\}} {\left\{ {\left( {{\rm 1}-\alpha ^{{\rm 2}} } \right)\left( {{\rm 1}-\alpha ^{{{\rm 2}n}} } \right)} \right\}}}} \right. \kern-\nulldelimiterspace} {\left\{ {\left( {{\rm 1}-\alpha ^{{\rm 2}} } \right)\left( {{\rm 1}-\alpha ^{{{\rm 2}n}} } \right)} \right\}}}\sigma ^{{\rm 2}} $$
Barczy & Kern express this covariance as the equivalent of
 $${{s^{{\rm 2}} } \mathord{\left/ {\vphantom {{s^{{\rm 2}} } q}} \right. \kern-\nulldelimiterspace} q}.{\rm sinh}\left( {qj} \right).{\rm sinh}{{\left( {q\left( {n-k} \right)} \right)} \mathord{\left/ {\vphantom {{\left( {q\left( {n-k} \right)} \right)} {{\rm sinh}\left( {qn} \right)}}} \right. \kern-\nulldelimiterspace} {{\rm sinh}\left( {qn} \right)}}$$
which agrees with the variance when j=k, as does our expression.
A3.4. In section 3.7, we state that Var[Du(t, j)]=σ 2 and Covar[Du(t, j), Du(t, k)]=0, j≠k.
 $$\eqalignno{ &\hskip -4.8pc Du\left( {t,\,j} \right)\,{\equals}\,{{\alpha ^{{n-j}} \sigma _{y} .Z\left( t \right)} \mathord{\left/ {\vphantom {{\alpha ^{{n-j}} \sigma _{y} .Z\left( t \right)} {s_{n} {\plus}\sigma {\rm }Z^{{\asterisk}} \left( {t,\,j} \right)}}} \right. \kern-\nulldelimiterspace} {s_{n} {\plus}\sigma {\rm }Z^{{\asterisk}} \left( {t,\,j} \right)}} \cr {\rm Var}\left[ {Du\left( {t,\,j} \right)} \right]\,&{\equals}\,\alpha ^{{{\rm 2}\left( {n-j} \right)}} \sigma ^{{\rm 2}} {{{{\left( {{\rm 1}-\alpha _{y}^{{\rm 2}} } \right)} \mathord{\left/ {\vphantom {{\left( {{\rm 1}-\alpha _{y}^{{\rm 2}} } \right)} {\left( {{\rm 1}-\alpha ^{{\rm 2}} } \right)}}} \right. \kern-\nulldelimiterspace} {\left( {{\rm 1}-\alpha ^{{\rm 2}} } \right)}}} \mathord{\left/ {\vphantom {{{{\left( {{\rm 1}-\alpha _{y}^{{\rm 2}} } \right)} \mathord{\left/ {\vphantom {{\left( {{\rm 1}-\alpha _{y}^{{\rm 2}} } \right)} {\left( {{\rm 1}-\alpha ^{{\rm 2}} } \right)}}} \right. \kern-\nulldelimiterspace} {\left( {{\rm 1}-\alpha ^{{\rm 2}} } \right)}}} {s_{n} ^{{\rm 2}} }}} \right. \kern-\nulldelimiterspace} {s_{n} ^{{\rm 2}} }}{\plus}\sigma ^{{\rm 2}} .\left( {{{{\rm 1}- \alpha ^{{{\rm 2}\left( {n-j} \right)}} } \mathord{\left/ {\vphantom {{{\rm 1}- \alpha ^{{{\rm 2}\left( {n-j} \right)}} } {s_{n} }}} \right. \kern-\nulldelimiterspace} {s_{n} }} } \right) \cr & \,{\equals}\,\sigma ^{{\rm 2}} \left( {\alpha ^{{{\rm 2}(n-j)}} {{s_{n} } \mathord{\left/ {\vphantom {{s_{n} } {s_{n}^{{\rm 2}} }}} \right. \kern-\nulldelimiterspace} {s_{n}^{{\rm 2}} }}{\plus}{\rm 1}- {{\alpha ^{{{\rm 2}\left( {n-j} \right)}} } \mathord{\left/ {\vphantom {{\alpha ^{{{\rm 2}\left( {n-j} \right)}} } {s_{n} }}} \right. \kern-\nulldelimiterspace} {s_{n} }}} \right) \cr & \,{\equals}\,\sigma ^{{\rm 2}} $$
If j≠k
 $$\eqalignno{ {\rm Covar}\left[ {Du\left( {t,\,j} \right),\,Du\left( {t,\,k} \right)} \right]\,& {\equals}\,E\left[ {\left\{ {{{\alpha ^{{n-j}} \sigma _{y} .Z\left( t \right)} \mathord{\left/ {\vphantom {{\alpha ^{{n-j}} \sigma _{y} .Z\left( t \right)} {s_{n} }}} \right. \kern-\nulldelimiterspace} {s_{n} }}{\plus}\sigma \,Z^{{\asterisk}} \left( {t,\,j} \right)} \right\}} \right. \cr & \left. {.\left\{ {{{\alpha ^{{n-k}} \sigma _{y} .Z\left( t \right)} \mathord{\left/ {\vphantom {{\alpha ^{{n-k}} \sigma _{y} .Z\left( t \right)} {s_{n} }}} \right. \kern-\nulldelimiterspace} {s_{n} }}{\plus}\sigma \,Z^{{\asterisk}} \left( {t,\,k} \right)} \right\}} \right] \cr & \,{\equals}\,\sigma ^{{\rm 2}} \left( {{{\alpha ^{{n-j}} \alpha ^{{n-k)}} } \mathord{\left/ {\vphantom {{\alpha ^{{n-j}} \alpha ^{{n-k)}} } {s_{n} }}} \right. \kern-\nulldelimiterspace} {s_{n} }}-{{\alpha ^{{n-j}} \alpha ^{{n-k}} } \mathord{\left/ {\vphantom {{\alpha ^{{n-j}} \alpha ^{{n-k}} } {s_{n} }}} \right. \kern-\nulldelimiterspace} {s_{n} }}} \right) \cr & \,{\equals}\,{\rm 0} $$