Introduction
The notion of tailoring properties of amorphous alloys through the introduction of structural heterogeneities akin to microstructural engineering in crystalline metals was demonstrated in early experiments on the consolidation of nanometer-sized glassy clusters to produce a new class of disordered solid widely referred to as metallic nanoglasses [Reference Jing, Kramer, Birringer, Gleiter and Gonser1]. These materials contain glass–glass interface networks [Reference Gleiter2], which may be thought of as an amorphous matrix material that forms from the surface layers of the glassy clusters during consolidation and binds together the nanoparticle cores to produce an amorphous grain structure. The interfacial regions are generally characterized by a reduced density, enhanced free volume, and defective short-range ordering relative to the amorphous grains [Reference Gleiter2, Reference Fang, Vainio, Puff, Wurschum, Wang, Wang, Ghafari, Jiang, Sun, Hahn and Gleiter3, Reference Chen, Louzguine-Luzgin, Xie, Sharma, Perepezko, Esashi, Yavari and Inoue4, Reference Chen, Frank, Asao, Louzguine-Luzgin, Sharma, Wang, Xie, Ishikawa, Hatakeyama, Lin, Esashi, Yamamoto and Inoue5, Reference Guo, Fang, Wu, Lan, Peng, Wang, Hahn, Gleiter and Feng6, Reference Cao, Liu, Yang, Xu, Yao, Minkow, Fecht, Ivanisenko, Chen, Wang, Qu and Jiang7, Reference Shao, Xu, Shi, Yu, Hahn, Gleiter and Li8]. Atomistic models of glass–glass interfaces constructed by joining two planar relaxed glassy surfaces have confirmed the excess free volume and defective short-range ordering reported through experiment [Reference Ritter, Sopu, Gleiter and Albe9]. Nanoparticle-based models have also demonstrated an inherent connection between structural and chemical heterogeneities due to surface segregation prior to nanoparticle consolidation [Reference Adjaoud and Albe10, Reference Adjaoud and Albe11]. A range of unique properties in nanoglasses has been attributed to the presence of these interfacial regions [Reference Witte, Feng, Fang, Fischer, Ghafari, Kruk, Brand, Wang, Hahn and Gleiter12, Reference Chen, Wang, Feng, Kruk, Yao, Louzguine-Luzgin, Hahn and Gleiter13, Reference Wang, Chen, Liu, Wang, Louzguine-Luzgin, Chen and Perepezko14] including improved mechanical performance relative to monolithic metallic glasses [Reference Wang, Jiang, Hahn, Li, Gleiter, Sun and Fang15, Reference Li, Wang, He, Sun, Guo, Feng and Yang16].
A major focus in the pursuit of nanoglass architectures has been on the ability of the interface network to combat shear instabilities that plague metallic glasses [Reference Schuh, Hufnagel and Ramamurty17, Reference Gleiter, Schimmel and Hahn18]. In a scandium-based nanoglass [Reference Wang, Jiang, Hahn, Li, Gleiter, Sun and Fang15], nanoindentation revealed the absence of discrete displacement bursts characteristic of shear band activity in amorphous solids [Reference Schuh and Nieh19], indicating plasticity transpired through a more homogenous process. This same nanoglass demonstrated 43% strain to failure during in situ compression testing whereas a metallic glass of nominally identical composition failed shortly beyond the elastic limit via shear localization [Reference Wang, Jiang, Hahn, Li, Gleiter, Sun and Fang15]. The ability to accumulate plastic strain was also manifested in the in situ tensile response, which exhibited a plastic strain to failure of approximately 15% and was accompanied by macroscopic necking in the gauge section of the sample. Plasticity was attributed to the interfaces promoting the distributed nucleation of many small shear bands, thereby inhibiting severe strain localization through the formation of large primary shear bands [Reference Wang, Jiang, Hahn, Li, Gleiter, Sun and Fang15].
Mechanistic insights into the role of structural length scales on nanoglass plasticity have been gained through atomistic modeling using molecular dynamics (MD) simulations. One particular idealized structure containing columnar amorphous grains with hexagonal cross-sections was prepared by Sopu et al. [Reference Sopu, Ritter, Gleiter and Albe20] through the consolidation of glassy nanoparticles extracted from a quenched Cu64Zr36 amorphous alloy. An alternative approach reported by Adibi et al. [Reference Adibi, Branicio, Zhang and Joshi21] applied a Poisson-Voronoi tessellation to a quenched Cu64Zr36 metallic glass slab with random atomic position shifts performed within each Voronoi cell, which was followed by relaxation simultaneously with the application of an external hydrostatic pressure to minimize internal porosity. Both models demonstrated that catastrophic failure via the formation of a primary shear band in the monolithic glass under uniaxial loading was suppressed by the presence of the glass–glass interfaces in the nanoglass. Additional insights into the process of localization were extracted from the columnar nanoglass model where shear strain was initially observed to partition to interfacial regions, in turn promoting the formation of multiple shear bands with increasing strain [Reference Sopu, Ritter, Gleiter and Albe20].
An inherent consequence of the interconnected interfacial network in nanoglasses is the advent of structural length scales defined by the amorphous grain size and interface geometry (e.g., width and heterogeneity [Reference Cheng and Trelewicz22]). These length scales have important implications for size effects in plasticity. Extrinsic size effects common in monolithic metallic glasses [Reference Wang, Ding, Cheng, Wan, Tian, Sun, Shan, Li and Ma23, Reference Ghidelli, Gravier, Blandin, Djemia, Mompiou, Abadias, Raskin and Pardoen24, Reference Kumar, Desai and Schroers25] have been shown to be absent in nanoglasses albeit only over a narrow size range [Reference Wang, Jiang, Hahn, Li, Gleiter, Sun and Fang26] and attributed to distributed plasticity promoted by the heterogeneities in the underlying amorphous structure. However, these heterogeneities are simultaneously responsible for an intrinsic size effect akin to the scaling behavior that derives from the role of microstructural length scales on plasticity in crystalline solids. In the columnar nanoglass model, homogenous flow from the distributed accumulation of shear strain transitioned to incipient plasticity due to the formation of large, primary shear bands at a critical amorphous grain size of 10 nm [Reference Sopu, Ritter, Gleiter and Albe20]. This cross-over transpired at a finer amorphous grain size of 5 nm for the Voronoi-tessellated columnar nanoglass model [Reference Şopu and Albe27, Reference Adibi, Sha, Branicio, Joshi, Liu and Zhang28] and was explained in the context of the rapid decrease in atom fraction composing the interfaces with increasing grain size [Reference Adibi, Branicio, Zhang and Joshi21] (though this rationale applies to both nanoglass models). Insights into the pursuit of tensile ductility from nanoglass pillar simulations containing free surfaces have also suggested that finer amorphous grain sizes promote a more homogenous plastic response, which inhibits necking instabilities deriving from shear localization prevalent at larger grain sizes [Reference Adibi, Branicio and Joshi29].
The connection between interface structural state, alloy chemistry, and chemical distribution also has important implications for the deformation behavior of nanoglasses. In the Cu–Zr system, the evolution in topological disorder that accompanies compositional changes has been demonstrated to influence the mechanical behavior including both the strength and propensity for localization [Reference Adibi, Branicio, Zhang and Joshi21, Reference Şopu and Albe27]. Increases in strength have also been reported for annealed nanoglass structures and attributed to relaxation of the interfaces influencing the activation of shear transformation zone (STZ) plasticity [Reference Fang, Vainio, Puff, Wurschum, Wang, Wang, Ghafari, Jiang, Sun, Hahn and Gleiter3, Reference Franke, Leisen, Gleiter and Hahn30]. It is important to note that changes to the interfacial regions will also be accompanied by structural evolution within the amorphous grains [Reference Şopu and Albe27, Reference Adibi, Sha, Branicio, Joshi, Liu and Zhang28]. The combined effects must, therefore, be considered when understanding the implications for mechanical behavior as highlighted by the transition to unstable shear flow in nanoglasses annealed under conditions that fully homogenized the nanoglass structure [Reference Sopu, Ritter, Gleiter and Albe20].
While intrinsic size effects in nanoglass plasticity have been connected to the structural length scales imposed by the interfacial network, the collective role of grain size and interface structural state in underlying deformation mechanism transitions remains to be elucidated. In this paper, we employ MD simulations to probe the process of strain delocalization in nanoglass models produced through high-pressure consolidation of amorphous nanoparticles of varying size. Structural properties of the interfaces, including interfacial volume fraction and width, excess free volume, and short-range ordering, are quantified as a function of both grain size and annealing condition. Flow curves are produced for each of the nanoglass models through simulated uniaxial tensile testing with plastic strain partitioning and the degree of localization quantified as a function of applied strain. By establishing correlations between the properties of the interfaces and mechanical behavior, we show that the structure of the interfaces relative to the amorphous grains plays a critical role in the perceived grain size effect and transition to homogenous flow in nanoglass plasticity.
Structural characterization of the consolidated nanoglasses
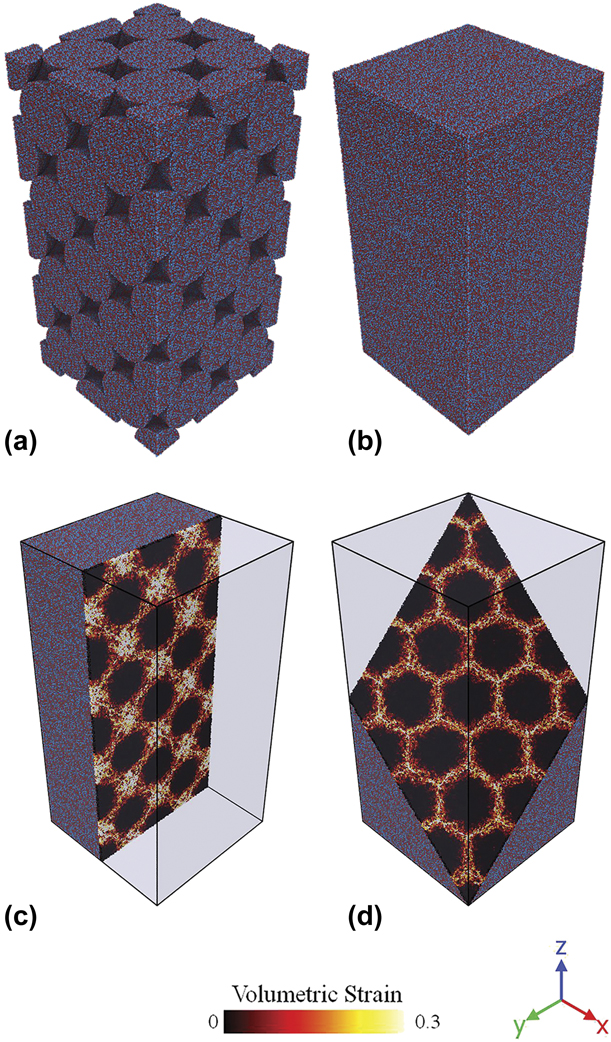
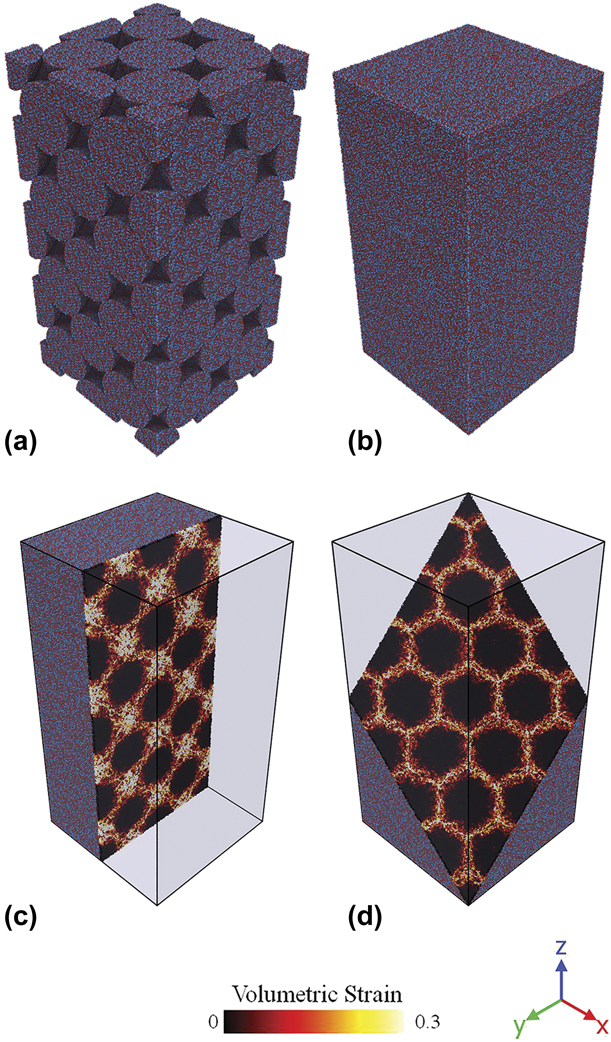
Interfaces in nanoglasses produced from the consolidation of amorphous nanoparticles exhibit distinctive features that are analogous to interface topologies in crystalline materials. The initial FCC stacking configuration for the 10-nm diameter amorphous nanoparticles is shown in Fig. 1(a), where Cu and Zr atoms are colored red and blue, respectively. The consolidated nanoglass structure for this configuration shown in Fig. 1(b) appeared structurally homogenous and free of surface voids. Indexing of the atoms based on their value of volumetric strain as shown in Figs. 1(c) and 1(d) for slices along the y–z and close-packed planes, respectively, revealed the interfacial regions deriving from material flow in the surface layers of the nanoparticles during consolidation. Two characteristic features are evident from the structures indexed by volumetric strain. First, interfaces separating the amorphous grains that specifically derived from the matting surfaces of two adjacent nanoparticles are apparent on both slices as shown in Figs. 1(c) and 1(d). Second, larger interfacial regions that formed from the free space between four matting nanoparticles are evident along the y–z plane and denoted herein as triple junctions in light of the analogy with interface networks in crystalline materials. Quantitative characterization of the interfacial regions demonstrated enhanced excess free volume and reduced short-range ordering relative to the amorphous grains, both of which varied between the interfaces and triple junctions [Reference Cheng and Trelewicz22], and the dependence of these characteristics on grain size and annealing temperature is the remaining focus of this section.
(a) Initial FCC stacking configuration of the Cu64Zr36 nanoparticles where the Cu and Zr atoms are colored red and blue, respectively. (b) 3D representation of the consolidated nanoglass structure. (c) Atomic configuration of the consolidated nanoglass along the y–z plane with atoms indexed according to the volumetric strain. (d) Slice taken along the close-packed plane relative the initial FCC stacking configuration of the amorphous spheres.
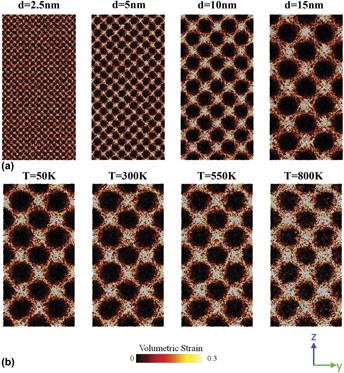
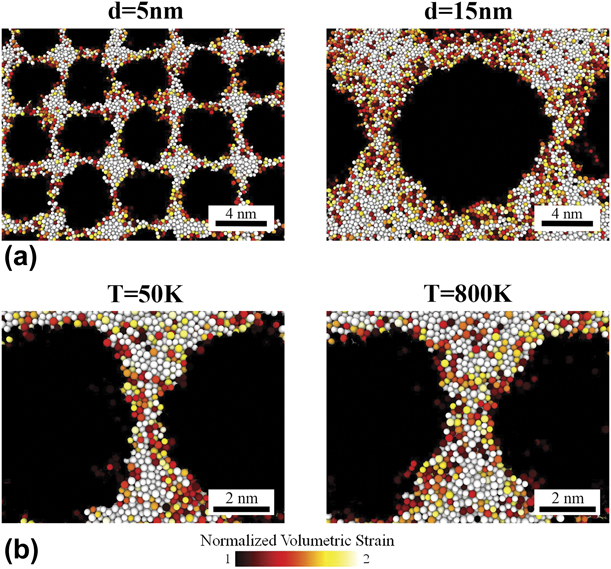
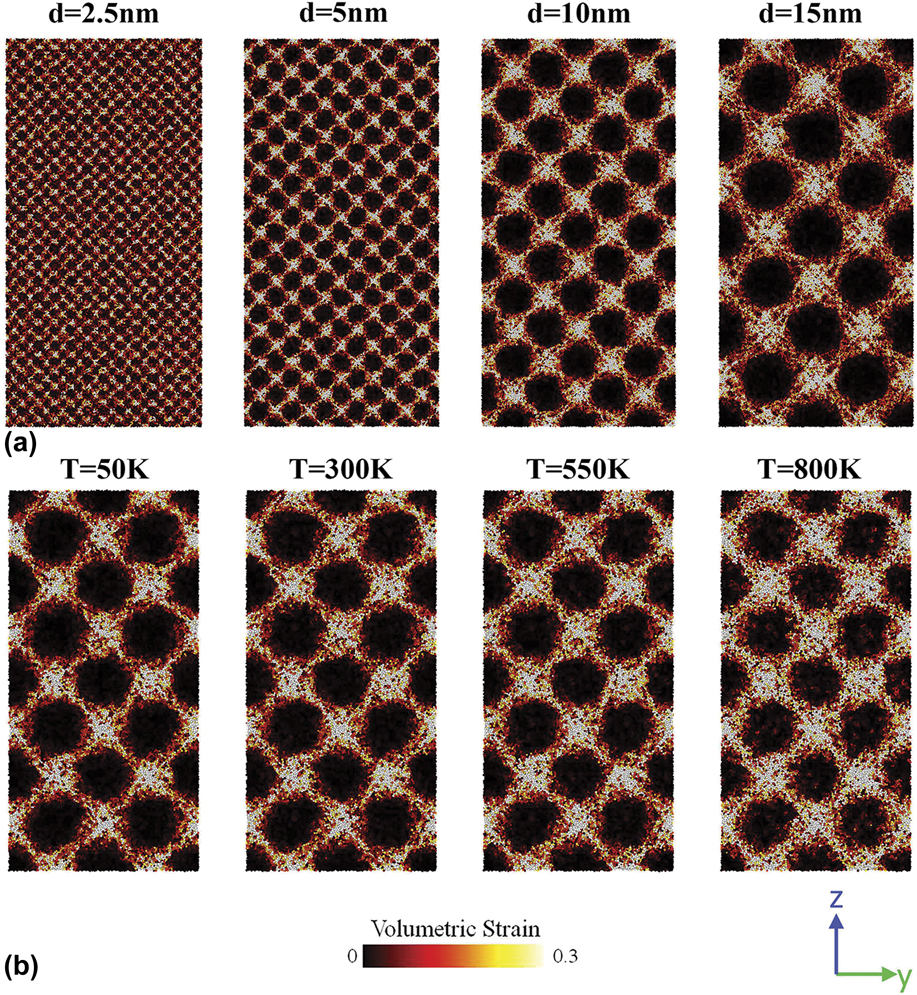
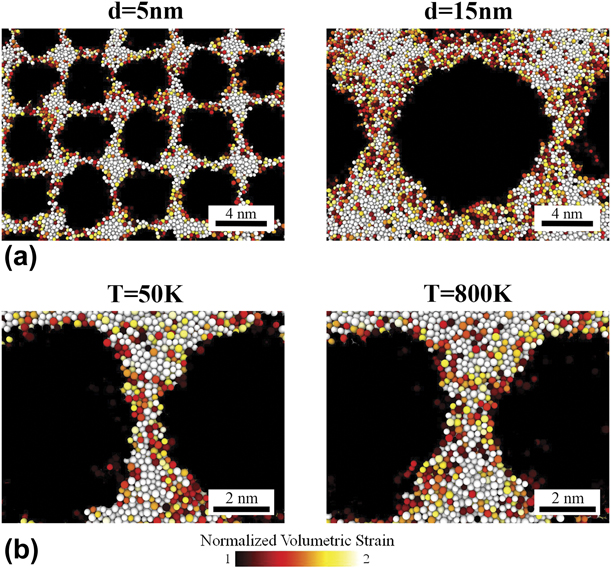
Interfaces formed in the nanoglass structures with different grain sizes are depicted in Fig. 2(a) along the y–z plane with atoms indexed based on volumetric strain, which captures both of the interfacial features described above. Due to the consistent simulation domain (defined by nanoparticle periodicity and total sample size) employed for these samples, the snapshots can be directly compared. With increasing grain size, geometric consistency in the interface networks was accompanied by an increase in the effective width of the interfaces with the most pronounced changes apparent in the triple junctions. Magnified views of the interfaces with atomic-level resolution are shown in Fig. 3(a) specifically for the 5- and 15-nm grain size samples. We note that the volumetric strain was normalized by the threshold value in this representation, which allows for changes in the interfacial characteristics to be more clearly delineated from the amorphous grains in the different structures since the threshold volumetric strain was sample dependent. Using this normalization, larger interfacial regions are now conspicuously evident in the 15-nm grain size structure and attributed to material flow transpiring over larger volumes during consolidation. Increased interfacial widths are also apparent as a function of annealing temperature as shown in Fig. 2(b) and concentrated primarily in the regions formed between two matting nanoparticles. However, rather than deriving from fundamental aspects of material flow during consolidation of larger diameter nanoparticles, the increase in the interfacial width evident in Fig. 3(b) upon annealing was attributed to a thickening effect described in greater depth below.
Cross-sectional views of the nanoglasses along the y–z plane with atoms indexed according to volumetric strain. (a) Selected variations in the initial nanoparticle diameters of 2.5, 5, 10, and 15 nm with geometric consistency maintained across the samples due to the identical stacking configurations. (b) As-consolidated 10-nm grain size nanoglass (50 K) and after subsequent annealing at temperatures of 300, 550, and 800 K.
Magnified snapshots of interfaces in the nanoglasses (a) with grain sizes of 5 and 15 nm and (b) annealed at 800 K relative to the as-consolidated structure at 50 K. Atoms are indexed based on their normalized volumetric strain, which allows for changes in the interfacial characteristics to be more clearly delineated from the amorphous grains.
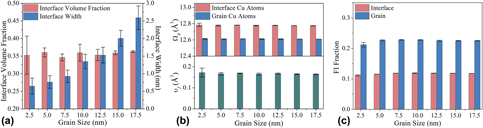
Geometric characteristics of the interfaces are quantified as a function of grain size as shown in Fig. 4(a) and substantiate the increase in the average interfacial width observed in the snapshots following consolidation. Over the grain size range of 2.5–17.5 nm, the width increased by nearly 5×, which when coupled with the decreased surface area with increasing nanoparticle size produced an interfacial volume fraction that was independent of amorphous grain size. With the different grain size samples produced using a consistent set of consolidation parameters (e.g., temperature, pressure, etc.), the structural properties of both the amorphous grains and interfaces including the average atomic volume (Ω0) and FI fraction were invariant with grain size as shown in Figs. 4(b) and 4(c), respectively. The consequence of the former is that the excess free volume (υf) was also independent of grain size despite the larger nanoparticle sizes producing wider interfacial regions. The difference in FI fraction between the amorphous grains and interfaces also substantiates the reduced short-range order in the interfacial regions and is thus consistent with the excess free volume of ∼0.17 Å3 reported for all grain size samples.
Grain size dependence of the (a) interfacial volume fraction and width, (b) average atomic volume (Ω0) of Cu atoms occupying the interfaces and amorphous grains with the corresponding excess free volume (υf) depicted in the lower panel, and (c) Cu-centered full icosahedra (FI) fraction delineated for the interfaces and grains.
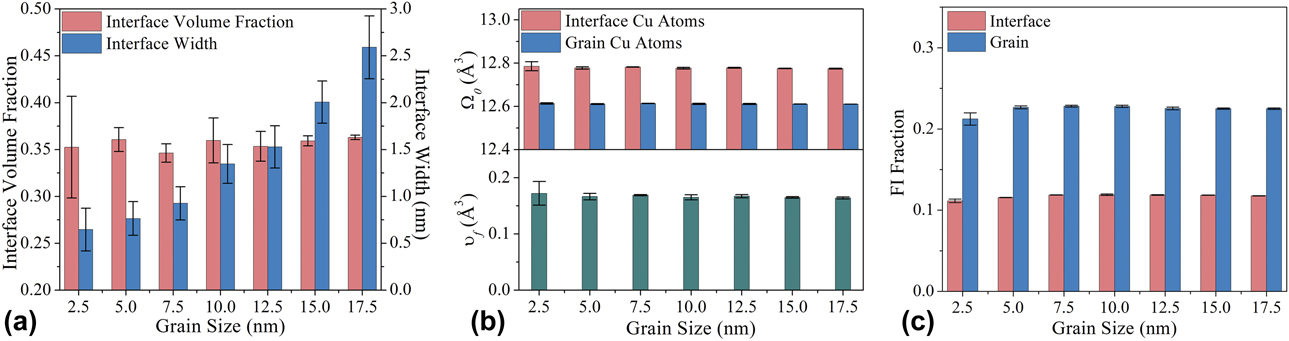
While experimental data are not available to systematically confirm this grain size effect, the reported values from the 7.5-nm grain size structure of 0.35 and 0.93 nm for the interfacial volume fraction and width, respectively, are consistent with experimental measurements of 0.35 and 0.8 nm acquired on Sc75Fe25 nanoglasses consolidated from 7-nm diameter amorphous nanoparticles [Reference Fang, Vainio, Puff, Wurschum, Wang, Wang, Ghafari, Jiang, Sun, Hahn and Gleiter3]. We attribute the grain size effect to material flow transpiring over greater volumes during the consolidation of larger diameter nanoparticles. The outer shells of the amorphous nanoparticles prior to consolidation are inherently higher energy sites due to local relaxation at the surfaces and thus characterized by reduced density and atomic packing fractions [Reference Adjaoud and Albe11]. Configurations containing finer nanoparticle sizes inherently have a higher surface-to-volume ratio, which facilitates highly localized flow under hydrostatic compression and in turn the formation of sharper interfacial regions. An increase in nanoparticle size reduced the surface-to-volume ratio and effectively delocalized material flow during consolidation, thereby producing more diffuse interfacial regions.
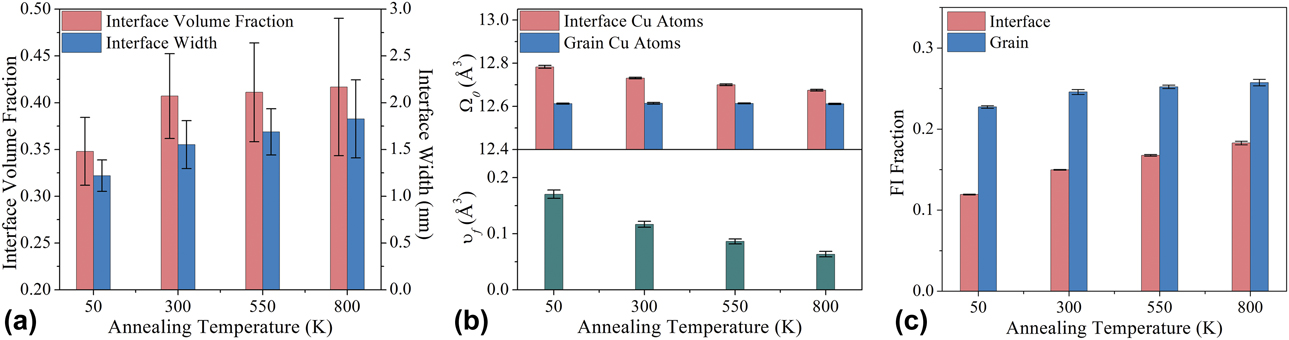
The effect of annealing was characterized for a constant amorphous grain size of 10 nm with the interfacial volume fraction and width plotted as a function of annealing temperature as shown in Fig. 5(a). The width of the interfaces increased monotonically with annealing temperature, which for a constant grain size resulted in an increase in the interfacial volume fraction. This mutually consistent scaling in the geometric characteristics of the interfaces accounts for the thickening effect produced by annealing noted above, which is fundamentally different from the grain size effect where increasing the initial nanoparticle size instead promoted the formation of larger interfacial regions during consolidation. Annealing also produced intrinsic structural changes in the interfaces as evidenced in Fig. 5(b) by the marked decrease in excess free volume from 0.16 to 0.06 Å3. This derived primarily from a reduction in the average Voronoi volume of atoms composing the interfacial region and was accompanied by an increase in the FI fraction in both regions of the nanoglass as shown in Fig. 5(c), which collectively are consistent with relaxation processes in disordered solids [Reference Sopu, Ritter, Gleiter and Albe20, Reference Cubuk, Ivancic, Schoenholz, Strickland, Basu, Davidson, Fontaine, Hor, Huang, Jiang, Keim, Koshigan, Lefever, Liu, Ma, Magagnosc, Morrow, Ortiz, Rieser, Shavit, Still, Xu, Zhang, Nordstrom, Arratia, Carpick, Durian, Fakhraai, Jerolmack, Lee, Li, Riggleman, Turner, Yodh, Gianola and Liu31]. However, the pronounced increase in the FI fraction of the interfaces relative to the amorphous grains indicates that recovery was biased to the interfacial regions of the nanoglass during annealing.
Dependence of the interface structural characteristics on annealing temperature including (a) interfacial volume fraction and width, (b) average atomic volume (Ω0) of Cu atoms occupying the interfaces and amorphous grains with the corresponding excess free volume (υf) depicted in the lower panel, and (c) Cu-centered full icosahedra (FI) fraction delineated for the interfaces and grains.
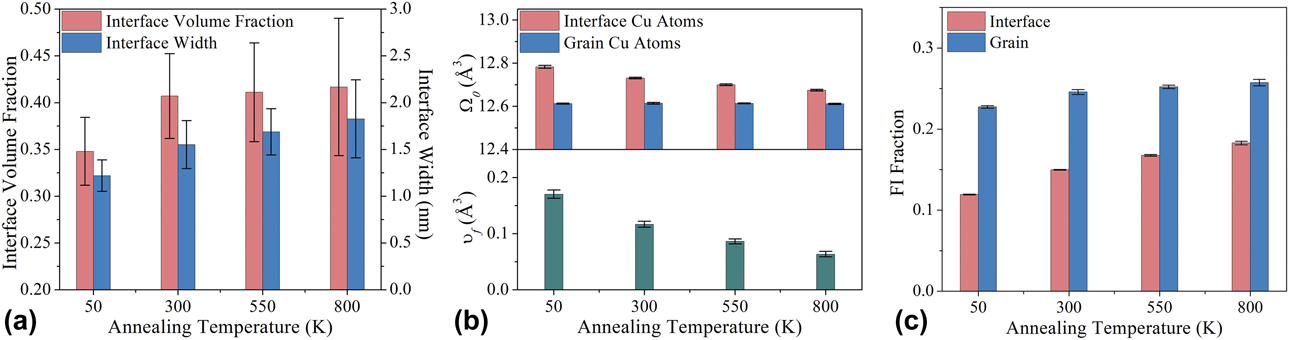
Thickening of the interfaces and simultaneous structural relaxation was driven by enhanced atomic mobility at elevated temperatures [Reference Franke, Leisen, Gleiter and Hahn30]. The excess free volume and defective short-range order in the interfaces formed at 50 K prior to annealing were initially concentrated within the central regions due to localized flow during consolidation as discussed above and shown in Fig. 3(b). During annealing, elevated temperatures enhanced local atomic mobility, thus facilitating the redistribution of excess free volume and concomitant broadening of the interfaces. Recovery of the short-range order also accompanied this redistribution of excess free volume with a biasing to the interfaces, which we attribute to interfacial atoms exhibiting greater mobility relative to those occupying the amorphous grains. The thickening effect observed in our simulations was consistent with increases in the interfacial volume fraction and width reported by Fang et al. [Reference Fang, Vainio, Puff, Wurschum, Wang, Wang, Ghafari, Jiang, Sun, Hahn and Gleiter3] during annealing of a Sc75Fe25 nanoglass. However, by extracting details of the atomic structure of the interfaces relative to the amorphous grains, our results indicate that interfacial thickening upon annealing is also accompanied by partial homogenization of the alloy, which has important implications for the mechanisms of strain delocalization.
Intrinsic size effects in nanoglass plasticity
An increase in the amorphous grain size produced changes in the geometric characteristics of the interfaces while annealing triggered a dynamic thickening effect where geometric variations were also accompanied by the evolution of fundamental structural properties of the interfaces. The implications of these changes in the interfacial network for nanoglass plasticity are explored in this section through uniaxial tensile deformation under a constant strain rate of 108 s−1 at a temperature of 50 K. The use of periodic boundary conditions inhibits necking and/or failure along shear bands common in MD simulations of amorphous solids containing free surfaces [Reference Adibi, Branicio and Joshi29, Reference Cheng, Cao, Sheng and Ma32], and the severity of localization is instead quantified using the shear localization factor defined in Eq. (1). Flow curves are first presented with results grouped based on grain size and annealing condition and used in the determination of mechanical properties. Localization characteristics are then described with shear strain accumulation delineated for the amorphous grains and interfaces as a function of grain size and annealing temperature. Finally, through comparison with a bulk metallic glass (BMG) counterpart of identical composition, implications for shear delocalization are discussed in the context of intrinsic size effects in nanoglass plasticity.
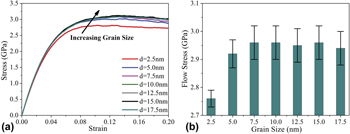
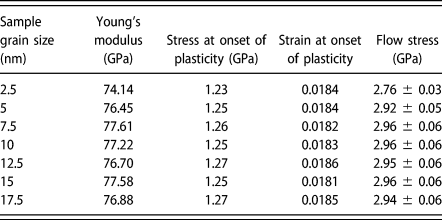
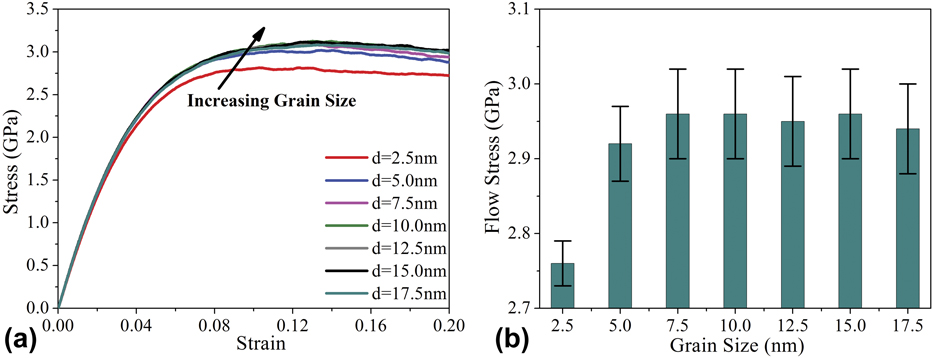
Stress–strain curves for the different grain size nanoglasses are shown in Fig. 6(a) with corresponding mechanical properties summarized in Table I. In general, the flow curves were independent of grain size (i.e., with nuances for the 2.5-nm grain size sample discussed further below) and free of discontinuities, indicating the absence of severe localization. The identical elastic responses produced a grain size independent Young’s modulus in Table I that was attributed to the consistent interfacial volume fraction across all samples. The stress and strain at the onset of plasticity (defining the elastic limit) were determined by applying a 0.2% strain offset criterion to the linear portion of the flow curves. Based on the values in Table I, the onset of plasticity was also independent of grain size despite the deviation in the flow curve for the finest grain size nanoglass. Conversely, the flow stress, which represents a common descriptor of strength determined from atomistic simulations [Reference Schiotz, Vegge, Di Tolla and Jacobsen33], captured this difference in flow behavior for the finer grain size samples as evident in Fig. 6(b). The reduced flow stresses for the 2.5- and 5-nm grain size nanoglasses are indicative of a lower activation barrier to stable plasticity following a limited strain hardening regime post-yield.
(a) Flow curves for the different grain size nanoglasses with the direction of increasing grain size indicated relative the curves. (b) Average flow stress determined from the flow curves as a function of grain size.
Mechanical properties of the nanoglasses with different grain sizes extracted from the flow curves.

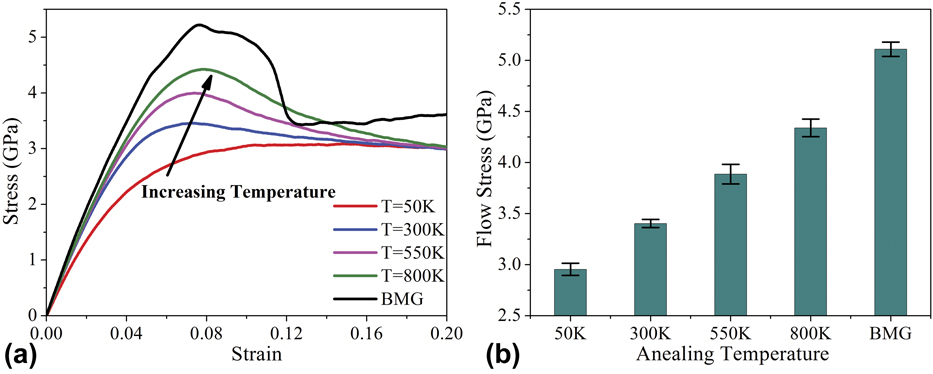
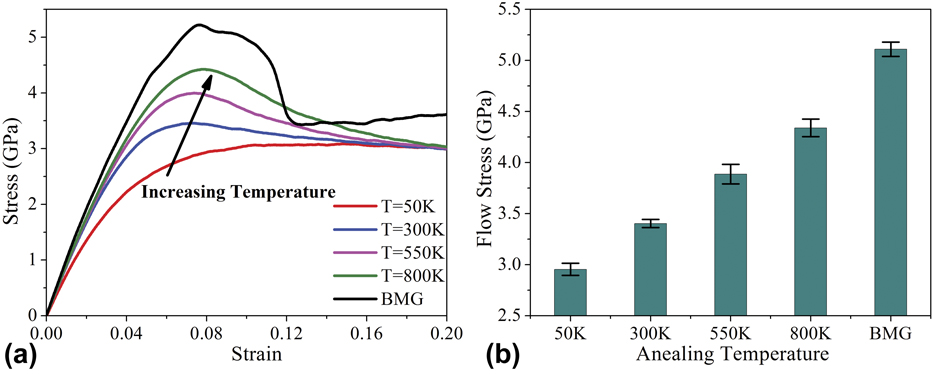
Flow curves for the 10-nm grain size structure annealed at temperatures of 300, 550, and 800 K are shown in Fig. 7(a) with the as-consolidated nanoglass and BMG counterpart also included for reference. Annealing at 300 K produced a subtle stress overshoot, which became more pronounced with increasing annealing temperature and eventually converged toward the behavior of the BMG sample. This convergence suggests that annealing of the nanoglasses, which produced both geometric and structural changes to the interfacial regions, promoted a transition to localized plasticity characteristic of metallic glasses where the rapid decline following the peak stress derives from the formation of a primary shear band. The scaling of flow stress with annealing temperature as shown in Fig. 7(b) as well as the stress and strain at the onset of plasticity cataloged in Table II bridged the values of the as-consolidated nanoglass and BMG, further substantiating the transition to localized plasticity upon annealing. Conversely, the Young’s modulus exhibited only a single increase from the value of 76.85 GPa in the as-consolidated state to 91.51 GPa for the 300 K anneal with very little additional change as the annealing temperature was further increased. This was also reflected in the flow curves by the close grouping of the elastic range for all the annealed structures and clear deviation below and above this range for the as-consolidated nanoglass and BMG, respectively.
(a) Flow curves for the 10-nm grain size nanoglass annealed to three temperatures of 300, 550, and 800 K relative to the as-consolidated structure (50 K) and BMG. The direction of increasing temperature is indicated with respect to the flow curves. (b) Average flow stress as a function of annealing condition with the average value for the BMG included for reference.
Mechanical properties of the annealed nanoglasses for a constant amorphous grain size of 10 nm extracted from the flow curves. Results for a monolithic amorphous alloy of identical composition (BMG) are also included for reference.

A number of observations described thus far provide insights into the mechanisms responsible for the influence of annealing on the flow behavior as well as the grain size independent mechanical properties. First, annealing resulted in a pronounced increase in the interfacial volume fraction from 0.35 in the as-consolidated state to 0.41 at 300 K, followed by an effective plateau in the range of 0.42 with increasing annealing temperature. The elastic modulus followed an identical trend and its scaling with annealing temperature is thus attributed to the increased volume fraction of interfacial material, which exhibits distinct elastic properties relative to the amorphous grains. Second, the interface structural properties evolved during annealing and specifically involved a monotonic reduction in the excess free volume deriving primarily from the decreases in the Voronoi volume in the interfaces, which was also accompanied by an increase in the interfacial FI fraction. The gradual transition in the strength of the nanoglasses [i.e., both the onset of plasticity and flow stress with the latter plotted in Fig. 7(b)] from the as-consolidated state to the BMG thus aligned with the homogenization process defined by the convergence of the structural characteristics of the interfaces toward the properties of the amorphous grains. Finally, in light of the two structure–property connections established for annealing, we can now understand the grain size independent elastic and plastic properties of the nanoglasses being a consequence of the grain size not impacting either the interfacial volume fraction or structural properties of the interfaces.
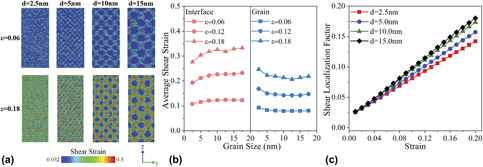
To provide mechanistic insights into the dependence of the mechanical behavior on the interface structural state, plastic strain partitioning between the amorphous grains and interfaces was quantified as a function of both grain size and annealing temperature. Snapshots of the nanoglass structure for four different grain sizes and two strains are shown in Fig. 8(a) with atoms colored according to their Von Mises shear strain. A shear strain criterion [Reference Cheng and Trelewicz34] was adopted to highlight atoms contributing to STZ plasticity. Using the undeformed structures as a reference state, the threshold shear strain was determined to be 0.032 and used as the lower bound for indexing in the snapshots. Following the onset of plasticity, shear strain immediately partitioned to the interfacial regions, which amplified with increasing strain from 0.06 to 0.18 as shown in Fig. 8(a). Biasing of shear strain accumulation was most evident for the larger grain size sample, but became difficult to discern as grain size approached the lower limit of 2.5 nm.
(a) Deformation snapshots for the nanoglasses with grain sizes of 2.5, 5, 10, and 15 nm at strains of 0.06 and 0.18 where atoms are indexed based on the Von Mises shear strain. (b) Average atomic shear strain within the interfaces and grains as a function of grain size for three strains of 0.06, 0.12, and 0.18. (c) Shear localization factor as a function of strain for the grain size samples shown in (a).
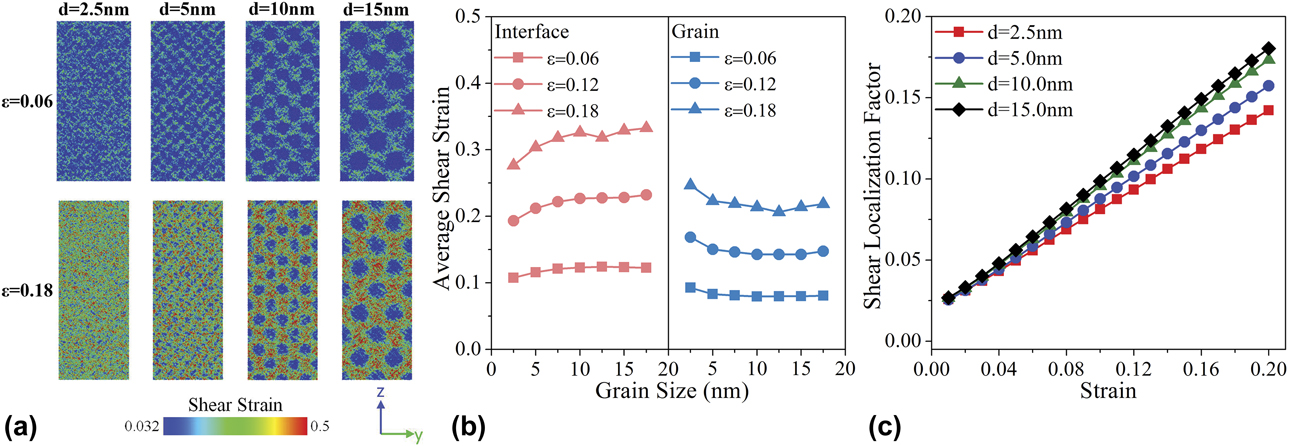
The average shear strain plotted separately for the interfaces and grains as a function of grain size as shown in Fig. 8(b) for three different strains confirmed the qualitative observations from the deformation snapshots. For all grain sizes, shear strain was preferentially accommodated by the interfacial regions, and the degree of partitioning diminished with decreasing grain size. The fundamental driving force for the biased strain accumulation derives from the presence of excess free volume and enhanced disorder reducing the barrier for the onset of STZ plasticity through local dilatation [Reference Argon35]. Because the interface structural properties were invariant with grain size, the degree of localization was also grain size independent particularly in the nanoglasses with grain sizes exceeding 7.5 nm. This was captured by the consistent scaling of the shear localization factor as shown in Fig. 8(c) for the 10- and 15-nm grain size samples. The deviation in this behavior for the finest two grain sizes of 2.5 and 5 nm was attributed to enhanced delocalization promoted by the length scale of the grain structure facilitating strain distribution across the grains and effective bridging of adjacent interfacial regions. Consequently, the slope of the shear localization as a function of applied strain was reduced relative to the larger grain size samples as shown in Fig. 8(c) and consistent with homogenous superplastic flow reported in Voronoi based nanoglass models [Reference Adibi, Sha, Branicio, Joshi, Liu and Zhang28]. Despite these nuanced grain size effects, the presence of interfaces acted to distribute plastic strain throughout the interfacial network and in turn inhibited severe strain localization through formation of a dominant shear band, which is common in atomistic simulations of metallic glass deformation under these conditions [Reference Shi and Falk36].
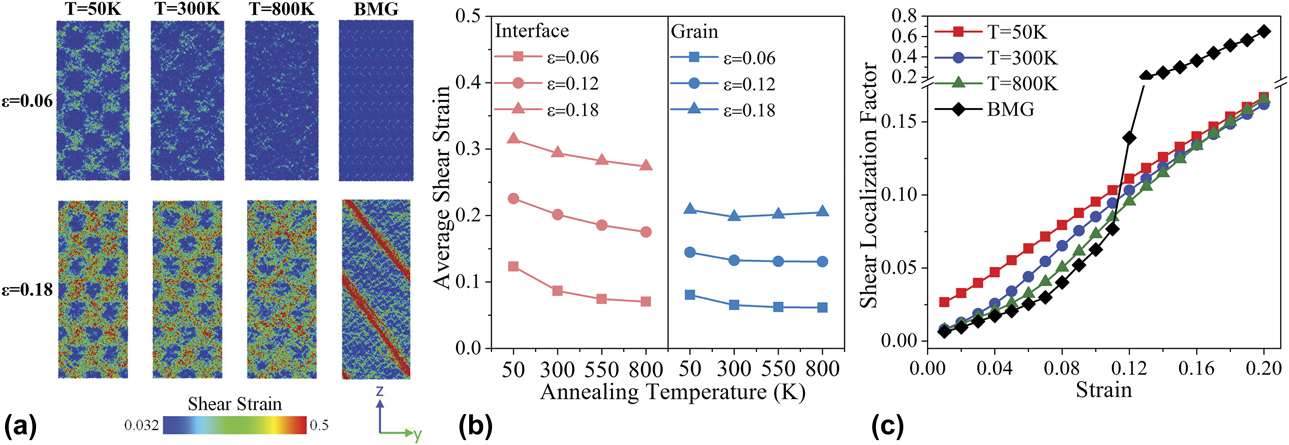
The deformation snapshots at two strains for annealing temperatures of 300 and 800 K are shown in Fig. 9(a) along with the as-consolidated nanoglass and BMG sample. Relative to the latter, the early onset of STZ plasticity in the interfacial regions at a strain of 0.06 was most pronounced in the as-consolidated nanoglass and delayed in the annealed nanoglasses due to the evolution of the interface structure upon annealing. In particular, the reduction in excess free volume and concomitant increase in short-range order elevated the barrier for local atomic dilatations, thereby raising the stress required for the onset of STZ plasticity. This increase is consistent with the strength increments reported in Table II. At the larger strain of 0.18 as shown in Fig. 8(a), the propensity for delocalization in the nanoglasses is now conspicuously evident relative to the BMG sample. The formation of a primary shear band in the BMG under periodic boundary conditions was inhibited by the presence of the interfacial regions distributing the process of plastic strain accumulation in the nanoglasses, which was also reflected in the varying grain size samples. This mechanism accounts for the primary delocalization effect in nanoglasses, where strain concentrates to the interfacial regions due to their unique structural properties relative to the amorphous grains.
(a) Deformation snapshots for the 10-nm grain size nanoglass annealed at 300 and 800 K and deformed to strains of 0.06 and 0.18 relative to the as-consolidated structure (50 K) and BMG reference. Atoms are indexed based on the Von Mises shear strain. (b) Average atomic shear strain within the interfaces and grains as a function of annealing temperature for three strains of 0.06, 0.12, and 0.18. (c) Shear localization factor as a function of strain for the nanoglass samples shown in (a) including the BMG reference structure.
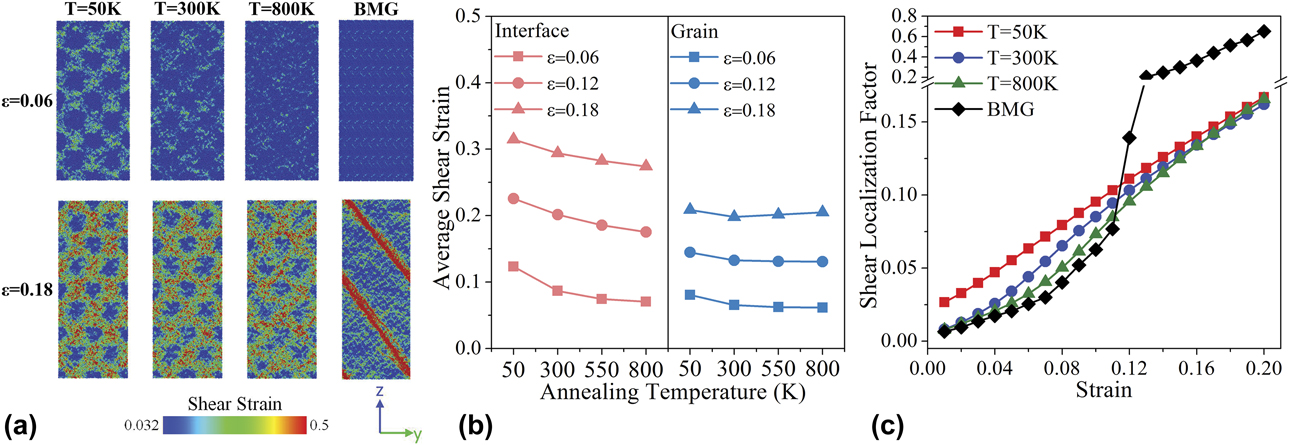
A second-order albeit important effect in the search for tailorable mechanical properties in nanoglasses is the delocalization of STZ plasticity promoted solely by annealing as shown in Fig. 9(a), where atoms within the grains were activated during deformation particularly at the higher strain of 0.18. This process manifested as a reduction in the average shear strain partitioning to the interfaces with increasing annealing temperature as shown in Fig. 9(b), which was accompanied by a subtle increase in the average shear strain accommodated within the grains at high strains. An effective reduction in strain partitioning between the interfaces and amorphous grains was attributed to homogenization of the nanoglass structure via relaxation of the interfaces promoted by annealing (see Fig. 5). Interestingly, the shear localization factor exhibited a complex dependency on the applied strain as shown in Fig. 9(c). At low plastic strains, the degree of localization converged toward the trend for the BMG and is reflective of homogenization of the nanoglass structure. However, with increasing strain where the localization factor for the BMG diverged to large values corresponding to the onset of the primary shear band as shown in Fig. 9(a), the annealed samples instead exhibited localization factors that aligned with the as-consolidated nanoglass. This demonstrates that even though annealing acted to homogenize the structure of the nanoglass with an attendant increase in strength as shown in Fig. 7(b), the flow curves in Fig. 7(a) remained smooth and continuous due to the interfaces inhibiting the formation of a primary shear band through effective distribution of accumulated plastic strain.
Intrinsic size effects in nanoglass plasticity thus derived not only from the inherent structural length scales imposed by the interfacial network but also from the structural state of the interfaces defined by their excess free volume and degree of short-range ordering. This is a consequence of biased strain accumulation within the interfacial regions across all grain sizes rather than the interfaces fundamentally augmenting the deformation mechanisms operating with the amorphous grains. Interfacial relaxation and structural homogenization upon annealing produced a convergence in the mechanical properties of the nanoglasses toward the BMG. However, rather than being accompanied by enhanced localization as this property convergence suggests, the simultaneous activation of STZs within the interfaces and amorphous grains instead promoted a further reduction in the degree of localization that scaled with the applied strain. The structure of the interfaces relative to the amorphous grains collectively with the effective grain size thus plays a critical role in exploiting intrinsic size effects for enhancing homogenous plasticity in nanoglasses.
Conclusions
The process of strain delocalization in nanoglasses produced through high-pressure consolidation of amorphous nanoparticles was quantified as a function of both amorphous grain size and annealing condition. By establishing correlations between the properties of the interfaces and mechanical behavior, we show that the structure of the interfaces relative to the amorphous grains plays a critical role in the perceived grain size effect and transition to homogenous flow in nanoglass plasticity. In particular, we demonstrated that the elastic properties of the nanoglasses scaled with the interfacial volume fraction while strength scaling upon annealing depended on the evolution of the excess free volume and degree of short-range ordering in the interfaces. Structural homogenization promoted through annealing was also accompanied by a convergence in the strength of the nanoglasses toward the value of the BMG. However, the flow curves remained smooth and continuous indicative of homogenous flow, which was attributed to the partitioning of strain to the interfaces inhibiting the formation of a primary shear band. Based on these findings, intrinsic size effects in nanoglass plasticity can now be understood to originate from biased plastic strain accumulation within the interfacial regions during deformation. The structural state of the interfaces combined with the inherent length scales of the amorphous grain structure will thus govern strain delocalization in nanoglasses and the associated transition to homogenous flow.
Methods
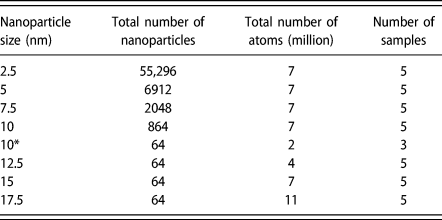
The nanoglass models employed herein were constructed from a Cu64Zr36 amorphous alloy, which was first heated to 2000 K and equilibrated for 2 ns, followed by a quench to 50 K at a cooling rate of 0.01 K/ps. Four amorphous spheres were extracted from the quenched amorphous alloy and served as the fundamental unit cell to produce the close-packed face-centered cubic (FCC) stacked nanoparticle configuration. By controlling the diameter of the amorphous spheres extracted from the quenched glass (and thus the nanoparticle diameter in the unit cell), the effective amorphous grain size of the consolidated nanoglasses was systematically varied. Seven grain sizes were explored in this study as summarized in Table III, which also contains the total number of nanoparticles and atoms in each structure. We note that the structures with grain sizes of 2.5, 5, 7.5, 10, and 15 nm have the same simulation domain as indicated by the consistent total number of atoms. The simulation domain for the samples with grain sizes of 12.5 and 17.5 nm was augmented to maintain a periodic FCC stacking sequence of the amorphous nanoparticles by holding the total number of nanoparticles constant rather than the total sample size. Five distinct structures were built for each grain size condition and used in determining average values of mechanical properties from the flow curves.
Summary of the initial nanoparticle configurations used for the production of the consolidated nanoglass structures. All samples were used in the study of amorphous grain size effects, and the sample marked with an asterisk was specifically employed to explore the role of interface structural state in plasticity via simulated annealing.

The large-scale atomic/molecular massively parallel simulator (LAMMPS) platform [Reference Plimpton37] was employed to carry out the MD simulations, where atomic interactions were defined using the embedded-atom method (EAM) potential developed by Mendelev et al. [Reference Mendelev, Sordelet and Kramer38] The ordered nanoparticle configurations were subjected to an energy minimization prior to consolidation with a final relative energy convergence of 10−12 to eliminate atom overlap resulting from the stacking procedure. Consolidation was accomplished by hydrostatically loading the simulation cells at a rate of 1.5 GPa/ps to a pressure of 9 GPa where they were held for 100 ps prior to removal of the load to achieve a pressure-free condition on all faces. Because consolidation temperature was previously shown to influence the structural state of the interfaces [Reference Cheng and Trelewicz22], a consistent temperature of 50 K was used for consolidation of all the structures.
Thermal evolution was investigated through simulated annealing of the nanoglass structure prepared from 64 nanoparticles with a diameter of 10 nm. Compared with the 10-nm nanoparticle diameter model used to study the effect of amorphous grain size that contained a total of 864 nanoparticles and a total of 7 million atoms from Table III, this smaller structure contained only 2 million atoms, which made longer simulation times for annealing computationally accessible. A monolithic metallic glass of identical composition was also prepared to serve as a reference for both the deformation and relaxation behavior of the nanoglasses and referred to as the BMG sample. Simulated annealing was performed for 2 ns at temperatures of 300, 550, and 800 K using a ramp rate of 1 K ps1 and subsequently cooled to 50 K using the same rate. Uniaxial tensile loading was applied in the z-direction at a temperature of 50 K and a strain rate of 108 s−1 with pressure in the x- and y-direction relaxed to zero to allow for lateral contraction. An isothermal-isobaric (NPT) ensemble with the Nose–Hoover thermostat/barostat was applied to control temperature and pressure with an integration time step of 2 fs for both deformation and annealing.
Structural characterization of the consolidated nanoglasses employed the volumetric strain (i.e., the hydrostatic part of strain tensor) to visualize interfacial regions and quantify their volume fraction, excess free volume, and degree of short-range ordering using the Cu-centered full icosahedral (FI) fraction. A computational framework has been developed for the determination of a volumetric strain threshold that enables interfacial regions to be distinguished from amorphous grains based on the correlation between dilatation and atomic volume distributions [Reference Cheng and Trelewicz22]. We employ the same method in this work using the BMG sample as a reference state for calculation of this threshold value, which was uniquely determined for each sample iteration over grain size and annealing condition. With the threshold value of the volumetric strain derived from the correlation between volumetric strain and atomic volume distributions, this approach captures local structural dilatation in different regions of the consolidated nanoglasses without requiring any assumptions, a priori, about the change in structure upon hydrostatic compression of the amorphous nanoparticles. Atomic volume was determined using the Voronoi tessellation method described in Ritter et al. [Reference Ritter, Sopu, Gleiter and Albe9] with the Voronoi index also cataloged for each atom’s polyhedron and used to identify Cu-centered full icosahedra [Reference Cheng, Sheng and Ma39]. Plastic strain accumulation was quantified using the Von Mises shear strain [Reference Shimizu, Ogata and Li40] and used to determine the shear localization factor, ψ, defined as
 $$\psi = \sqrt {{1 \over N}\sum\limits_{i = 1}^N {{{\left( {\eta _i^{{\rm{Mises}}} - \eta _{{\rm{ave}}}^{{\rm{Mises}}}} \right)}^2}} \quad ,}$$
where N is the total number of atoms in the simulation domain,  $\eta _i^{{\rm{Mises}}}$ the Von Mises shear strain of atom i, and
 $\eta _{{\rm{ave}}}^{{\rm{Mises}}}$ the average Von Mises shear strain of all atoms [Reference Cheng, Cao and Ma41]. Generally, a larger shear localization factor is indicative of a severely localized deformation mode. The open-source OVITO software [Reference Stukowski42] package was used in quantification and visualization of the deformed nanoglass structures.
Acknowledgments
Support for this work was provided through the National Science Foundation under Award 1554411. The authors would like to thank Stony Brook Research Computing and Cyberinfrastructure and the Institute for Advanced Computational Science at Stony Brook University for access to the high-performance SeaWulf computing system, which was made possible by National Science Foundation Award 1531492. The authors also gratefully acknowledge the use of computing resources at the Center for Functional Nanomaterials, which is a US DOE Office of Science Facility at Brookhaven National Laboratory under Contract No. DE-SC0012704.