




No CrossRef data available.
Article contents
Parasite (Schistosoma mansoni) and host (Biomphalaria glabrata) genetic diversity: population structure in a fragmented landscape
Published online by Cambridge University Press: 07 August 2001
Abstract
Random amplified polymorphic DNA (RAPD) markers were used to quantify genetic diversity within and between 5 populations of Schistosoma mansoni within its definitive host (Rattus rattus) and the 5 corresponding populations of the snail intermediate host (Biomphalaria glabrata) from a limited endemic area of murine schistosomiasis on the island of Guadeloupe. Analysis of molecular variance (AMOVA) and canonical correspondence analysis (CCA) were used to test the significance of genetic differentiation between populations. Both methods gave similar results. Of total gene diversity, 15.1% (AMOVA) and 18.8% (CCA) was partitioned between localities for S. mansoni with an absence of association between genetic and geographical distances. Geographical localities accounted for 20.5% (CCA) of the total diversity for B. glabrata populations. The genetic distances between pairs of parasite populations were not correlated with the genetic distances between the corresponding pairs of snail host populations. Such strong patterns of local differentiation of both parasite and snail populations are consistent with predictions based on metapopulation dynamics and may have implications on host–parasite susceptibility relationship through local adaptation processes.
Information
- Type
- Research Article
- Information
- Copyright
- 2001 Cambridge University Press
INTRODUCTION
Recent studies have shown the potential utility of molecular markers for understanding transmission processes of macroparasites by analysing the amount and partitioning of genetic diversity within and between hosts and within and between populations (Nadler, 1990, 1995; Simpson et al. 1993). The life-history parameters of parasites (i.e. direct or indirect life-cycle, asexual multiplication within intermediate host, reproductive systems, larval dispersion …) represent some of the forces that will shape the genetic structure of helminth populations (Bullini et al. 1986; Mulvey et al. 1991; Blouin, Liu & Berry, 1999). Host factors (i.e. demography, behaviour, dispersal ability, immunity …) coupled with the geographical and ecological characteristics of the transmission area have also to be considered (Blouin et al. 1995; Dybdahl & Lively, 1996).
We still know little about populations of adult schistosomes within their definitive hosts (Barral et al. 1996). Most genetic studies on schistosome species have focused on searching for genetic markers to distinguish phenotypic variants or differentiate geographical isolates (McCutchan et al. 1984; Vieira et al. 1991; Dias Neto et al. 1993; Minchella et al. 1994; Gasser et al. 1996; Chilton et al. 1999), rather than on partitioning genetic diversity within and between neighbouring populations (Curtis & Minchella, 2000). In contrast, much more attention has been devoted to genetic diversity of the larval stages within the snail intermediate hosts (Minchella, Sollenberger & Pereira de Sousa, 1995; Dabo et al. 1997; Sire et al. 1999; Davies et al. 1999). This probably reflects the difficulty in obtaining direct samples of worms from definitive hosts.
On the island of Guadeloupe, the blood fluke Schistosoma mansoni is abundant within a natural murine host, the black rat Rattus rattus (Théron et al. 1992). This particular epidemiological situation provides an opportunity to investigate the genetic variation directly at the level of adult worm infrapopulations and its hierarchical distribution at different spatial scales of an endemic zone. Here we focus on a limited transmission area and examine genetic diversity and differentiation within and between local populations of schistosomes, using RAPD markers. The study area has particular ecological and epidemiological characteristics including patchy distribution of the fresh water transmission sites along the edge of a swampy forest, spatial and temporal asynchrony of the local transmission dynamics of the parasite (Théron et al. 1992), limited movement of the rats (Delattre & Le Louarn, 1981), little dispersal ability of snails and infective larvae in these standing water habitats. Previous and re-analysed results on the genetic structure of the intermediate snail host populations of Biomphalaria glabrata from the same localities (Langand et al. 1999) sampled at the same period, allowed a direct comparison between parasite and snail host population structures. Such a comparison is of importance for a better understanding of host–parasite relationships and the epidemiology of disease transmission.
MATERIALS AND METHODS
Transmission sites and parasite recovery
Rattus rattus were captured at 5 localities (Fig. 1) of the swampy forest focus of Grande Terre in Guadeloupe (see Théron et al. 1992 for the description of this focus of murine schistosomiasis). These localities constitute transmission sites for the parasite with the presence of B. glabrata snail host populations (Langand et al. 1999). They include: Dubelloy (DUB), Geffrier (GEF), Dans Fond (DFO), Belle Plaine (BLP), and Jacquot (JAC). The geographical distance between localities ranges between 1.7 km (DFO–GEF) and 8.8 km (DUB–JAC). Transmission sites are located along the border of a marshy forest fragmented into 4 main patches of different size (Fig. 1).

Fig. 1. Map of the sampled sites (JAC, BLP, DFO, GEF, DUB) for Schistosoma mansoni populations within definitive hosts (Rattus rattus) and their corresponding populations of intermediate snail host (Biomphalaria glabrata) at the edge of the swampy forest in Guadeloupe.
The same number of traps (36), baited with coconut, was used at each locality. The total number of rats captured at the end of the rainy season (November), is listed in Table 1. Schistosomes were recovered from each infected host by hepatic perfusion (Duvall & Dewitt, 1967) and careful examination of the liver and lungs. Worms were washed in physiological saline and stored in 70% ethanol at −20 °C until DNA extraction after isolation of male and female paired worms. Samples taken from infected rats within each locality were considered as local parasite populations, schistosomes sampled from all rats from all localities were considered as the regional parasite population (Table 1).

Schistosome DNA extraction
DNA was extracted from individual adult worms as follows. Frozen worms were individually homogenized with a pestle in 100 μl of 10 mM Tris–HCl pH 8; 1 mM EDTA, 10 mM NaCl and 70 mM sucrose (extraction buffer). The pestle was rinsed in an Eppendorf tube with 10% sodium dodecyl sulphate and 12 μl of proteinase K (10 mg/ml). The homogenate was incubated at 57 °C for 2 h, then extracted once with an equal volume of phenol and once with chloroform. The solution was adjusted to 0.3 M with sodium acetate and precipitated at −20 °C overnight with 2 volumes of absolute ethanol. DNA was pelleted the following day by centrifugation (15000 g, 20 min, 4 °C), then rinsed with ethanol 70%, dried and finally resuspended in 100 μl of TE (10 mM Tris–HCl, pH 8, and 1 mM EDTA). This extraction protocol yielded sufficient DNA for approximately 12 RAPD reactions/worm.
PCR amplification
Fifteen oligonucleotides (from kits A and B; Operon Technologies Inc. USA) were used for the amplification of random DNA markers to reveal genetic diversity between individuals. The RAPD protocol previously described (Barral et al. 1993) was followed with minor modifications. The volume for each amplification reaction was 25 μl with approximately 20–35 ng of total DNA, 100 μM of each dNTP, 3 mM MgCl2 and 250 nM primer. Taq DNA polymerase (1 unit) and amplification buffer were purchased from Promega Biotech. (Madison, WI, USA). Amplification was routinely performed in a HybaidTM DNA Thermal cycler or a PTC 100TM M. J. Research Inc., programmed for a preliminary 3 min 50 sec denaturation at 92 °C followed by 40 cycles at 92 °C for 1 min, 35 °C for 2 min and 72 °C for 2 min for denaturating, annealing, and primer extension, respectively. Each amplification series finished with an incubation at 72 °C for 5 min to ensure that primer extension reactions proceeded to completion. Amplification products were analysed by electrophoresis in 1% agarose gels and detected by staining with ethidium bromide. For each primer used, a tube containing all the components except for the template DNA was included as a control to detect potential contamination. Controls were always negative. Controls with host DNA gave a pattern completely different and RAPD markers detected between individual worms were not correlated to a potential host DNA contamination. The major criteria for taking a fragment into account are reproducibility and sharpness of the fragments.
Data analysis
Several studies have shown that the RAPD technique can be applied successfully to helminths (Dias Neto et al. 1993; Barral et al. 1996; Gasser et al. 1996; Dabo et al. 1997; Fisher & Viney, 1998; Sire et al. 1999; Davies et al. 1999) for estimating differentiation among parasite populations (Nadler, Lindquist & Near, 1995). However, with such dominant markers, heterozygous individuals cannot be distinguished from homozygous ones (Hadrys, Balick & Schierwater, 1992), limiting the use of classical indices of population genetics, Fst, Fis, etc based on allelic frequencies. Under these conditions, we have used analysis of molecular variance (AMOVA, Escoffier, Smouse & Quattro, 1992) and canonical analysis (CANOCO, Ter Braak, 1990) adapted to such RAPD data.
RAPD patterns generated by discriminant primers were scored using (1) and (0) for presence or absence of bands at polymorphic loci. The diversity was calculated for each marker using Shannon's index according to the formula:
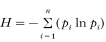
with pi the frequency of the marker i. H host provides a measure of the average diversity within schistosome infrapopulations in the hosts, H loc a measure of the mean diversity within a population at the scale of the localities and H reg is the diversity calculated with all parasites recovered at the regional scale. Shannon's index was used to partition the diversity into within-(H host/H reg) and between- ((H reg−H host)/H reg) host components, within- (H loc/H reg) and between- ((H reg−H loc)/H reg) local populations.
The software GENEPOP V3 (Raymond & Rousset, 1995) was used to detect associations of RAPD marker pairs and to test for the significance of differentiation between pairs of population pairs. Probabilities of differentiation of population pairs given by GENEPOP for each marker were combined according to the Fisher method to obtain a probability for all the markers.
The analysis of molecular variance (AMOVA, Escoffier et al. 1992) adapted to RAPD profiles (Huff, Peakall & Smouse, 1993; Gabrielsen et al. 1997) was used to quantify the amount of variation between individuals from hosts trapped from the same and different localities. The analysis was conducted using AMOVA-PREP and AMOVA 1.5 (Escoffier, University of Geneva), and significance levels of the variance components were based on 1000 permutations.
Canonical analyses (canonical correspondence analysis: CCA) were carried out using individual data of presence/absence of RAPD markers. Permutation tests helped to determine whether the groups actually exist or not, and which were the axes which discriminate between groups. The rate between the sum of all canonical eigenvalues (given by the canonical analysis) and the sum of all unconstrained eigenvalues (given by the correspondence analysis) represented the part of the variance due to groups. The software CANOCO (Version 3.11, Ter Braak, 1990) was used to perform canonical analyses and permutation tests.
A Mantel t-test (software R4, program Mantel, Casgrain & Legendre, available at www.fas.umontreal.ca/biol/casgrain/fr/labo/R/index.htm) was carried out to detect a correlation between geographical distances and Euclidean distances based on the frequencies of RAPD markers for each population pair.
Snail population structure
The genetic structure of 9 populations of B. glabrata from the same geographical zone has been previously published (see Langand et al. 1999). Here we re-analyse these data obtained with RAPDs, taking into account only the 5 populations of snails, corresponding to the same localities (DUB, GEF, DFO, BLP and JAC) at the same period where S. mansoni parasites from rats have been sampled. Canonical analyses (CANOCO) were performed with these data to test the differentiation between populations and their geographical structure. A Mantel t-test was carried out to detect a correlation between genetic distances of parasite and host populations.
RESULTS
Rat infection pattern
Of the 49 R. rattus trapped at each transmission site, 39 (79%) were parasitized by S. mansoni and a total of 3450 worms were collected (Table 1). Sex ratio, biased towards males, was 1.40. The mean overall abundance was high (70.40 worms/trapped rat). The highest worm burden was of 343 schistosomes in 1 rat and parasitic loads up to 100 worms per host were commonly encountered (31%).
RAPD patterns
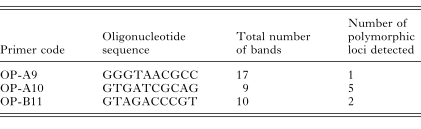
Out of 15 oligonucleotides assayed, 3 primers (Table 2) revealed an unambiguous genetic polymorphism between individuals and were retained for this study. Primers OP-A9, OP-A10 and OP-B11 allowed the detection of 8 polymorphic markers. RAPD patterns often demonstrate individual differences by the absence or the presence of a single product. No significant genotypic disequilibrium was detected between pairs of markers, meaning that each marker provides independent information.
Partition and differentiation of S. mansoni genetic diversity
Among the 756 schistosomes analysed (22% of the population randomly sampled) from 26 infected hosts, 142 different genotypes were recognized (Table 3). All the hosts harboured multiple parasite genotypes with a maximum diversity reaching 29 genotypes within an infrapopulation of 57 worms and a mean number of genotypes per host ±S.E. of 14.4±1.53 with a variance (s2) of 61.4. The maximum repetition of an identical genotype within a host was of 22 for 122 worms analysed within a rat harbouring 343 schistosomes.

Estimated genetic diversity ±S.E. obtained with Shannon's index within hosts ranged between 0.69 and 1.85 with an average (H host) of 1.36±0.25. Parasite diversity occurs on average more within (69.4%) than among (30.6%) hosts (Table 4). Between 43 (DFO) and 58 (BLP) different genotypes were encountered within localities and each local population showed a substantial number of private genotypes, between 7 (JAC) to 24 (DUB), (Table 3). Parasite diversity was of the same order of magnitude for each locality (Table 4), ranging from 1.55 (DFO) to 1.82 (BLP) with an average (H loc) of 1.69±0.32 (Table 4). Genetic diversity occurs more within (86.2%) than between (13.8%) localities (Table 4). Analysis of molecular variance (AMOVA) as well as canonical analysis (CCA) showed significant differences (P<0.001) between local populations at different transmission sites, 15.1% and 18.8% of the genetic diversity occurring between localities respectively (Table 5, Fig. 2A).

Fig. 2. Genetic structure of (A) parasite (Schistosoma mansoni) and (C) host (Biomphalaria glabrata) populations within (B) the marshy forest patches in Guadeloupe. The 5 populations have been projected on the first 2 axes of the canonical analysis. Centroids of groups (= local populations) and ellipses, which represent 95% confidence intervals, are marked on the ordination diagram.


Geographical structure of local populations of S. mansoni
The canonical analysis was performed considering 5 groups corresponding to the local populations of parasites sampled at the 5 localities. The 2 first axes of the canonical analysis described 57.1% and 42.9% of the total inertia, and 57.2% and 23.1% of the canonical inertia respectively. The first axis of the canonical analysis differentiated the population of DFO from those of DUB and GEF. OP-A10-1 and OP-A10-2 markers were the most important on this axis. This second axis isolated BLP and JAC from DUB and GEF, OP-B11-2 and OP-A10-1 markers were the most important on this axis. We note that this additional differentiation is geographically correlated with the different forest patches occurring at the transmission area. DUB and GEF populations were sampled from the northern forest patch, BLP and JAC from the southern while the transmission site of DFO is located within a central isolated fragment of forest (Fig. 2A and B). No significant correlation (Mantel t-test) was observed between geographical and euclidian distances using frequencies of RAPD markers (P = 0.40).
Geographical differentiation of local populations of B. glabrata snail hosts
Results of the canonical analysis considering 5 groups corresponding to the local populations of snails sampled at the 5 localities (Fig. 2C) confirm that there was a significant differentiation between localities (20.5% of the total variation occurring between populations, P<0.001). The 2 first axes of the canonical analysis described 50.7% and 32.4% of the canonical inertia (Fig. 2C). No significant correlation (Mantel t-test) was observed between geographical and euclidian distances using frequencies of RAPD markers (P = 0.48) neither a particular geographical structure related with the forest patches.
Co-structure between parasite and host (Fig. 2)
Populations of adult schistosomes and their mollusc intermediate hosts exhibited a similar level of differentiation at this regional geographical scale (18.8% and 20.5% respectively). However, no significant correlation occurred between parasite and host genetic distances (Mantel t-test, P = 0.41).
DISCUSSION
Most of the data available on population genetic structure in helminth species are concerned with parasitic nematodes (Leslie et al. 1982; Anderson, Romero-Abal & Jaenike, 1993, 1995; Blouin et al. 1992, 1995, 1999; Nadler et al. 1995; Nadler, 1996; Fisher & Viney, 1998; see Anderson, Blouin & Beech, 1998 for a synthesis). Results showed that genetic diversity and its distribution within and among populations were primarily determined by effective size of populations and gene flow (Blouin et al. 1995). As these two characters are strongly linked with life-cycle patterns and life-histories of both parasites and hosts, then, population genetic structures of nematodes may well differ among different species (Blouin et al. 1995). As an example, Heterorhaditis marelatus, an entomopathogenic nematode with small effective population size and little dispersal ability, shows low genetic diversity within populations and strong differentiation among populations (78% of the total variation) on a small scale (Blouin et al. 1999). In contrast, Ostertagia ostertagi, a nematode parasite of livestock and with large effective population size, has almost all the genetic diversity (98%) distributed within, rather than among populations, as a result of the high rate at which livestock are transported around large geographical regions (Blouin et al. 1992).
Population genetic structures of adult digeneans within definitive hosts have been less investigated. Fascioloides magna, a trematode of the white-tailed deer, showed populations with low differentiation between hunt units of a 800 km2 area (mean Fst = 0.016) but substantial levels of differentiation between different states (mean Fst = 0.176) with an isolation pattern by distance (Lydeard et al. 1989; Mulvey et al. 1991). However, within a locality, 99% of the total genetic variation occurred among flukes infecting different deer. Asexual multiplication of the larval parasite within intermediate snail hosts and clumping of metacercariae representing the same clone may generate such a distribution as attested by the occurrence of many individuals of the same multi-locus genotype in a host (Mulvey et al. 1991).
Our study on S. mansoni populations, using RAPD markers associated to AMOVA and canonical analyses, revealed a clear genetic differentiation between the 5 local populations sampled from this limited endemic area. A substantial and significant part (15.1%, AMOVA and 18.8%, CANOCO) of the total variation occurs among local populations with an absence of association between genetic distance and geographical proximity. Additionally, canonical analyses discriminate between 3 groups of local populations (JAC–BLP), (DFO), (GEF–DUB) belonging to 3 different forest patches. Spatial differentiation and absence of correlation between genetic and geographical distances are suggestive of low gene flow among local populations at the regional scale. This means that parasite movements through definitive or intermediate host migration and/or propagule dispersion are restricted between localities. Concerning the definitive hosts, no case of human infection has been detected in the last 10 years (unpublished data) and rats alone now maintain the parasite life-cycle.
In these forest habitats, populations of the black rats are present in high densities and show sedentarity, marked territoriality and little movement of individuals (Delattre & Le Louarn, 1981) contributing to limit exchange between local populations of parasites. Transmission sites along the marshy forest are patchy standing water habitats with abundant aquatic vegetation limiting passive dispersion both for infected snails (present in very low prevalences (Sire et al. 1999)) and free-living cercariae. The population genetic structure we described for S. mansoni within rodent definitive hosts, corroborates previous results on the population dynamics of these spatially fragmented populations of parasites. From a long-term survey, Théron et al. (1992) demonstrated that local population dynamics of adult schistosomes were locally in non-equilibrium and fluctuated in spatio-temporal asynchrony, breaking up the regional population into quasi-independent subpopulations, while the regional population remained relatively stable during the 10-year period studied. A result consistent with predictions based on metapopulation dynamics theory (Hanski & Gilpin, 1997) and susceptible to increased interpopulation genetic divergence through random genetic drift and reduced gene flow between localities (Hastings & Harrison, 1994).
Corresponding B. glabrata intermediate snail host populations also showed a significant genetic differentiation between localities, however, with no correspondence with the geographical structure described for the parasite. Several studies of co-structure between host and parasite populations also failed to show such positive correlations (Mulvey et al. 1991; Davies et al. 1999; Jobet et al. 2000). This absence of a cross-correlation between snail and schistosome RAPD profiles across sites may be due to different modes of dispersal as previously suggested by Davies et al. (1999) for S. haematobium and Bulinus globosus. However, such strong local differentiation of both parasite and snail populations may have implications on host–parasite relationship through local adaptation processes (Gandon et al. 1996; Gandon & Van Zandt, 1998) since several studies have shown the higher compatibility of digenetic populations to their sympatric snail populations (Manning, Woolhouse & Ndamba, 1995; Dybdahl & Lively, 1996).
As emphasized by Bush et al. (1995), population genetic studies of parasites have to be coupled with strong ecological and epidemiological knowledge of the host/parasite/environment system studied. The pattern and degree of connectedness between local populations appear as a critical feature in such a model of spatially structured population. The key to better understanding of the dynamics and genetics of parasite metapopulation will be to estimate with appropriate codominant markers (Jarne & Lagoda, 1996; Curtis & Minchella, 2000) levels of gene flow between local populations and their importance in maintaining regional dynamic stability and genetic diversity. Recent characterization of high polymorphic microsatellite markers in S. mansoni (Durand, Sire & Théron, 2000) as well as in Biomphalaria (Jones et al. 1999; Charbonnel et al. 2000) would greatly improve our knowledge of schistosome population genetic structure and epidemiological processes occurring at various geographical scales and for different ecological systems.
We dedicate this paper to the memory of Véronique Barral. We must thank P. Durand for advice on schistosome RAPDs. We are indebted to D. Rollinson (The Natural History Museum, London) and P. Jarne (CEFE, Montpellier) for valuable comments on the manuscript. This work received financial support from the CNRS (Programme Environnement, Vie et Société, PNDBE), and the Ministère de l'Education Nationale, de la Recherche et de la Technologie (PRFMMIP).
References
ANDERSON, T. J. C., BLOUIN, M. S. & BEECH, R. N. (1998). Population biology of parasitic nematodes: application of genetic markers. Advances in Parasitology 41, 219–283.CrossRefGoogle Scholar
ANDERSON, T. J. C., ROMERO-ABAL, M. E. & JAENIKE, J. (1993). Genetic structure and epidemiology of Ascaris population: patterns of host affiliation in Guatemala. Parasitology 107, 319–334.CrossRefGoogle Scholar
ANDERSON, T. J. C., ROMERO-ABAL, M. E. & JAENIKE, J. (1995). Mitochondrial DNA and Ascaris microepidemiology: the composition of parasite populations from individual hosts, families and villages. Parasitology 110, 221–229.CrossRefGoogle Scholar
BARRAL, V., MORAND, S., POINTIER, J. P. & THÉRON, A. (1996). Distribution of schistosome genetic diversity within naturally infected Rattus rattus detected by RAPD markers. Parasitology 113, 511–517.CrossRefGoogle Scholar
BARRAL, V., THIS, P., IMBERT-ESTABLET, D., COMBES, C. & DELSENY, M. (1993). Genetic variability and evolution of the Schistosoma genome analysed by using random amplified polymorphic DNA markers. Molecular and Biochemical Parasitology 59, 211–222.CrossRefGoogle Scholar
BLOUIN, M. S., DAME, J. B., TARRANT, C. A. & COURTNEY, C. H. (1992). Unusual population genetics of a parasitic nematode: mtDNA variation within and among populations. Evolution 46, 470–476.CrossRefGoogle Scholar
BLOUIN, M. S., LIU, J. & BERRY, R. E. (1999). Life cycle variation and the genetic structure of nematode populations. Heredity 83, 253–259.CrossRefGoogle Scholar
BLOUIN, M. S., YOWELL, C. A., COURTNEY, C. H. & DAME, J. B. (1995). Host movement and the genetic structure of populations of parasitic nematodes. Genetics 141, 1007–1014.Google Scholar
BULLINI, L., NASCETTI, G., PAGGI, L., ORECCHIA, P., MATTIUCCI, S. & BERLAND, B. (1986). Genetic variation of ascaridoid worms with different life cycles. Evolution 40, 434–440.Google Scholar
BUSH, A. O., CAIRA, J. N., MINCHELLA, D. J., NADLER, S. A. & SEED, J. R. (1995). Parasitology year 2000. Journal of Parasitology 81, 835–842.CrossRefGoogle Scholar
CHARBONNEL, N., ANGERS, B., RAZATAVONJIZAY, R., BREMOND, P. & JARNE, P. (2000). Microsatellite variation in the freshwater snail Biomphalaria pfeifferi. Molecular Ecology 9, 1006.CrossRefGoogle Scholar
CHILTON, N. B., BAO-ZHEN, Q., BOGH, H. O. & NANSEN, P. (1999). An electrophoretic comparison of Schistosoma japonicum (Trematoda) from different provinces in the People's Republic of China suggests the existence of cryptic species. Parasitology 119, 375–383.CrossRefGoogle Scholar
CURTIS, J. & MINCHELLA, D. J. (2000). Schistosome population genetic structure: when clumping worms is not just splitting hairs. Parasitology Today 16, 68–71.CrossRefGoogle Scholar
DABO, A., DURAND, P., MORAND, S., LANGAND, J., IMBERT-ESTABLET, D., DOUMBO, O. & JOURDANE, J. (1997). Dispersion and genetic diversity of Schistosoma haematobium within its Bulinid intermediate hosts in Mali. Acta Tropica 66, 15–26.CrossRefGoogle Scholar
DAVIES, C. M., WEBSTER, J. P., KRÜGER, O., MUNATSI, A., NDAMBA, J. & WOOLHOUSE, M. E. J. (1999). Host–parasite population genetics, a cross-sectional comparison of Bulinus globosus and Schistosoma haematobium. Parasitology 119, 295–302.CrossRefGoogle Scholar
DELATTRE, P. & LE LOUARN, H. (1981). Dynamique des populations du rat noir, Rattus rattus, en mangrove lacustre. Mammalia 45, 275–288.CrossRefGoogle Scholar
DIAS NETO, E., PEREIRA DE SOUZA, C., ROLLINSON, D., KATZ, N., PENA, S. D. J. & SIMPSON, A. J. G. (1993). The random amplification of polymorphic DNA allows the identification of strains and species of schistosomes. Molecular and Biochemical Parasitology 57, 83–88.CrossRefGoogle Scholar
DYBDAHL, M. F. & LIVELY, C. M. (1996). The geography of coevolution: comparative population structures for a snail and its trematode parasite. Evolution 50, 2264–2275.CrossRefGoogle Scholar
DURAND, P., SIRE, C. & THÉRON, A. (2000). Isolation of microsatellite markers in the digenetic trematode Schistosoma mansoni from Guadeloupe island. Molecular Ecology 9, 997–998.CrossRefGoogle Scholar
DUVALL, R. H. & DEWITT, W. B. (1967). An improved perfusion technique for recovering adult schistosomes from laboratory animals. American Journal of Tropical Medicine and Hygiene 16, 483–486.CrossRefGoogle Scholar
ESCOFFIER, L., SMOUSE, P. E. & QUATTRO, J. M. (1992). Analysis of molecular variance inferred from metric distances among DNA haplotypes: application to human mitochondrial DNA restriction data. Genetics 131, 479–491.Google Scholar
FISHER, M. C. & VINEY, M. E. (1998). The population genetic structure of the facultatively sexual parasitic nematode Strongyloides ratti in wild rats. Proceedings of the Royal Society of London, B 265, 703–709.CrossRefGoogle Scholar
GABRIELSEN, M., BACHMANN, K., JAKOBSEN, K. S. & BROCHMAN, C. (1997). Glacial survival does not matter: RAPD phylogeography of Nordic Saxifraga oppositifolia. Molecular Ecology 6, 834–842.Google Scholar
GANDON, S., CAPOWIEZ, Y., DUBOIS, Y., MICHALAKIS, Y. & OLIVIERI, I. (1996). Local adaptation and gene for gene coevolution in a metapopulation model. Proceedings of the Royal Society of London, B 263, 1003–1009.CrossRefGoogle Scholar
GANDON, S. & VAN ZANDT, P. A. (1998). Local adaptation and host-parasite interactions. Trends in Ecology and Evolution 13, 214–216.CrossRefGoogle Scholar
GASSER, R. B., BAO-ZHEN, Q., NANSEN, P., JOHANSEN, M. V. & BOGH, H. (1996). Use of RAPD for the detection of genetic variation in the human blood fluke, Schistosoma japonicum, from mainland China. Molecular and Cellular Probes 10, 353–358.CrossRefGoogle Scholar
HADRYS, H., BALICK, M. & SCHIERWATER, B. (1992). Application of random amplified polymorphic DNA (RAPD) in molecular ecology. Molecular Ecology 1, 55–63.CrossRefGoogle Scholar
HANSKI, I. & GILPIN, M. (1997). Metapopulation Biology:Ecology, Genetics and Evolution. Academic Press, London.
HASTINGS, A. & HARRISON, S. (1994). Metapopulation dynamics and genetics. Annual Review of Ecology and Systematics 25, 167–188.CrossRefGoogle Scholar
HUFF, D. R., PEAKALL, R. & SMOUSE, P. E. (1993). RAPD variation within and among natural populations of outcrossing buffalograss (Buchlöe dactyloides (Nutt.) Englem.). Theoretical and Applied Genetics 86, 927–934.Google Scholar
JARNE, P. & LAGODA, P. J. L. (1996). Microsatellites, from molecules to populations and back. Trends in Ecology and Evolution 11, 424–429.CrossRefGoogle Scholar
JOBET, E., DURAND, P., LANGAND, J., MÜLLER-GRAF, C. D. M., HUGOT, J-P., BOUGNOUX, M-E., RIVAULT, C., COAREC, A. & MORAND, S. (2000). Comparative genetic diversity of parasites and their host: population structure of an urban cockroach and its haplo-diploid parasite (oxyuroid nematode). Molecular Ecology 9, 481–486.CrossRefGoogle Scholar
JONES, C. S., LOCKYER, A. E., ROLLINSON, D., PIERTNEY, S. B. & NOBLE, L. R. (1999). Isolation and characterization of microsatellite loci in the freshwater gasteropode, Biomphalaria glabrata, an intermediate host for Schistosoma mansoni. Molecular Ecology 8, 2149–2151.CrossRefGoogle Scholar
LANGAND, J., THÉRON, A., POINTIER, J. P., DELAY, B. & JOURDANE, J. (1999). Population structure of Biomphalaria glabrata, intermediate host of Schistosoma mansoni in Guadeloupe Island, using RAPD markers. Journal of Molluscan Studies 65, 425–433.CrossRefGoogle Scholar
LESLIE, J. F., CAIN, G. G., MEFFE, G. K. & VRIJENHOEK, R. C. (1982). Enzyme polymorphism in Ascaris suum (Nematoda). Journal of Parasitology 68, 576–587.CrossRefGoogle Scholar
LYDEARD, C., MULVEY, M., AHO, J. M. & KENNEDY, P. K. (1989). Genetic variability among natural populations of the liver fluke, Fascioloides magna, in the white-tailed deer, Odocoileus virginianus. Canadian Journal of Zoology 67, 2021–2025.CrossRefGoogle Scholar
MANNING, S. D., WOOLHOUSE, M. E. J. & NDAMBA, J. (1995). Geographic compatibility of the freshwater snail Bulinus globosus and schistosomes from the Zimbabwe highveld. International Journal for Parasitology 25, 37–42.CrossRefGoogle Scholar
MCCUTCHAN, T. F., SIMPSON, A. J., MULLINS, J. A., SHER, A., NASH, T. E., LEWIS, F. & RICHARDS, C. (1984). Differenciation of schistosomes by species, strain, and sex by using coled DNA markers. Proceedings of the National Academy of Sciences, USA 81, 889–893.CrossRefGoogle Scholar
MINCHELLA, D. J., LEWIS, F. A., SOLLENBERGER, K. M. & WILLIAMS, J. A. (1994). Genetic diversity of Schistosoma mansoni. Molecular and Biochemical Parasitology 68, 307–313.CrossRefGoogle Scholar
MINCHELLA, D. J., SOLLENBERGER, K. M. & PEREIRA DESOUSA, C. (1995). Distribution of schistosome genetic diversity within molluscan intermediate hosts. Parasitology 111, 217–220.CrossRefGoogle Scholar
MULVEY, M., AHO, J. M., LYDEARD, C., LEBERG, P. L. & SMITH, M. H. (1991). Comparative population genetic structure of a parasite (Fascioloides magna) and its definitive host. Evolution 45, 1628–1640.Google Scholar
NADLER, S. A. (1990). Molecular approaches to studying helminth population genetics and phylogeny. International Journal for Parasitology 20, 11–29.CrossRefGoogle Scholar
NADLER, S. A., LINDQUIST, R. L. & NEAR, T. J. (1995). Genetic structure of midwestern Ascaris suum populations: a comparison of isoenzyme and RAPD markers. Journal of Parasitology 81, 385–394.CrossRefGoogle Scholar
NADLER, S. A. (1995). Microevolution and the genetic structure of parasite populations. Journal of Parasitology 81, 395–403.CrossRefGoogle Scholar
NADLER, S. A. (1996). Microevolutionary patterns and molecular markers: the genetics of geographic variation in Ascaris suum. Journal of Nematology 28, 277–285.Google Scholar
RAYMOND, M. & ROUSSET, F. (1995). GENEPOP v1.2, a population genetics software for exact tests and ecumenicism. Journal of Heredity 86, 248–249.Google Scholar
SIMPSON, A. J. G., DIAS NETO, E., JOHNSTON, D. A., KAUKAS, A. & ROLLINSON, D. (1993). Recent molecular approach to the study of schistosome genetics. Experimental Parasitology 77, 376–379.CrossRefGoogle Scholar
SIRE, C., DURAND, P., POINTIER, J. P. & THÉRON, A. (1999). Genetic diversity and recruitment pattern of Schistosoma mansoni in a Biomphalaria glabrata snail population: a field study using random-amplified polymorphic DNA markers. Journal of Parasitology 85, 436–441.CrossRefGoogle Scholar
TER BRAAK, C. J. F. (1990). CANOCO – a FORTRAM program for canonical community ordination by [partial] [detrended] [canonical] correspondence analysis, principal components analysis and redundancy analysis. Microcomputer Power, Ithaca, New York.
THÉRON, A., POINTIER, J. P., MORAND, S., IMBERT-ESTABLET, D. & BOREL, G. (1992). Long-term dynamics of natural populations of Schistosoma mansoni among Rattus rattus in patchy environment. Parasitology 104, 291–298.CrossRefGoogle Scholar
VIEIRA, L. Q., CORREA-OLIVEIRA, R., KATZ, N., DE SOUZA, C. P., CARVALHO, O. S., ARAUJO, N., SHER, A. & BRINDLEY, P. J. (1991). Genomic variability in field populations of S. mansoni in Brazil as detected with a ribosomal gene probe. American Journal of Tropical and Medical Hygiene 44, 69–78.Google Scholar
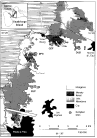
Fig. 1. Map of the sampled sites (JAC, BLP, DFO, GEF, DUB) for Schistosoma mansoni populations within definitive hosts (Rattus rattus) and their corresponding populations of intermediate snail host (Biomphalaria glabrata) at the edge of the swampy forest in Guadeloupe.
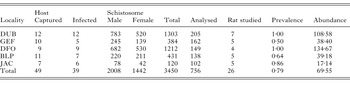
Table 1. Host (Rattus rattus) infection by adult schistosomes and number of rats and worms used for the study (Prevalence = infected hosts/captured hosts; abundance = average number of worms per trapped host.)
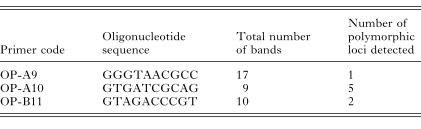
Table 2. Oligonucleotides sequences (5′ to 3′) of the primers used to reveal polymorphism
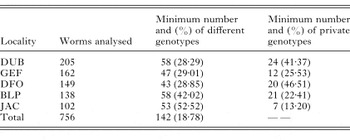
Table 3. Minimum number and percentage of different and private genotypes of Schistosoma mansoni at each locality, revealed by the 3 primers used
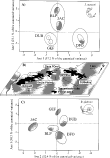
Fig. 2. Genetic structure of (A) parasite (Schistosoma mansoni) and (C) host (Biomphalaria glabrata) populations within (B) the marshy forest patches in Guadeloupe. The 5 populations have been projected on the first 2 axes of the canonical analysis. Centroids of groups (= local populations) and ellipses, which represent 95% confidence intervals, are marked on the ordination diagram.
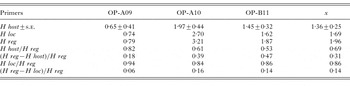
Table 4. Host (H host), local (H loc) and regional (H reg) diversity of Schistosoma mansoni from the swampy forest focus of Guadeloupe revealed by 3 RAPD primers calculated with Shannon's index (Partition of the diversity as the proportion of diversity within (H host/H reg) and between (H reg−H host)/H reg) host; within (H loc/H reg) and between ((H reg−H loc)/H reg) local populations (x is the average diversity for the 3 markers).)
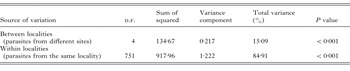
Table 5. AMOVA results for Schistosoma mansoni
 You have
Access
- 48
- Cited by