

INTRODUCTION
Social structure and group identities are expressed in a variety of materially visible ways, including modification of the landscape, which perhaps receives less attention from Romanists than its scale, ubiquity and scope for comparative study merit. Developments over time and a continual accretion of features make landscape a powerful medium (and form of material culture) through which to explore social constructs in Iron Age (IA) and Roman Britain. Physical and symbolic connections between settlements, burials, ritual sites and natural features reflect these constructs and can be studied through a consideration of how people in the past created and understood meaning through structures and movement in the landscape. Manipulations of temporality, for example, can be seen in the deliberate construction of relationships between earlier features of the Bronze Age/IA and Roman-period burial monuments. By relating these to other landscape features and aspects of visibility and symbolic connections, we can begin to uncover the links between identity construction, communication and belief.Footnote 1
Kent provides evidence of complex changes to social structure and organisation in the Late Pre-Roman Iron Age (LPRIA) and Roman periods. The relationship between the pre-Roman and Roman groupings has been a subject for external commentary since the first century b.c. when Caesar remarked that four rulers controlled ‘ei qui Cantium incolunt’ ‘those who live in Cantium’ (B.G. 5.22). Modern scholars tend to turn to the Roman ‘civitas capital’, Durovernum (Canterbury), in reconstructions of the tribal organisation of Kent, assuming a key focus for IA settlement there and/or a sanctuary which may have united multiple LPRIA groups.Footnote 2 They also regularly mention the stark difference in the distribution and density of high-status Roman-period structural complexes (‘villas’) between the west and the east/south of the modern county. In the Darent and Medway valleys, north-west and nearer to Londinium, ‘villa’-type architecture is particularly well documented and high-status Roman-period buildings on sites with IA occupation levels (e.g. the mid-first-century a.d. villa building overlying an IA settlement at Eccles, or the development of villa buildings on a site with roundhouses at Thurnham) provide evidence that perhaps the local elite in the western part of Kent were early adopters of new architectural forms.Footnote 3 In the east such sites are found in lower numbers and primarily on the coast, and not, apparently, in close proximity to Durovernum. This difference in distribution has been taken as a reflection of dissimilarities between groups of people also evident in earlier periods in the distributions of coinage, pottery and burial sites and a perceived lack of hillforts/oppida in the east.Footnote 4 These discussions of Roman Britain lose much of the regional patterning in synthesis. We suggest that by exploring how landscapes of settlement, burial and ritual created and communicated group identities, social hierarchies and ties between people and place we can further our understanding of the communities in Kent immediately before and during the Roman period. In this article, we focus in particular on the hinterland of Canterbury, where the relative lack of archaeological investigations has had a distorting effect on interpretations.
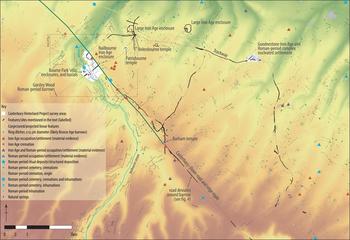
The Canterbury Hinterland Project (CHP) has combined extensive analysis of aerial photography and LiDAR from across east Kent, with results of earlier investigations and new multiple-technique geophysical surveys over several sites in the hinterland of Canterbury (fig. 1). The results have revealed evidence for settlement (three large, probably IA, enclosures which may represent previously unknown hillforts; multiple IA and Roman-period enclosures; a high-status Roman-period ‘villa’-type building; a possible Roman-period provisioning centre; an IA/Roman-period nucleated settlement), burial (numerous Bronze Age to Saxon barrows; a probable LPRIA cemetery), ritual (several Roman-period temples) and movement (trackways, pathways, roads).Footnote 5 This has led to the identification of a group based in the territory of the Nailbourne hilltop enclosure (?hillfort) in Bourne Park/Bridge (fig. 2). It is argued here that the group appears to have used landscape features to communicate status and group identities, connecting people in a more complex network of features and ‘places’ than the traditional focus on high-status sites in isolation might indicate. We suggest that they have made the landscape communicate meaning in two main ways: a ‘public’ face of power oriented towards the Dover to Canterbury road route and a more local or rural expression of ritual and remembrance.
DEM of east Kent showing sites mentioned in the text, the CHP survey areas, selected features identified through the aerial photographic and geophysical surveys, the likely ‘villas’ from Blanning's (Reference Blanning2014) core dataset of rural settlement sites, Roman roads, likely Iron Age ‘hillforts’ and large enclosures, Iron Age burial areas and major streams. (Lacey Wallace and Chris Blair-Myers with Kent Historic Environment record data, DEM data (Crown copyright/database right 2017, an Ordnance Survey/EDINA supplied service), Roman roads from the Pleiades Project database (licensed under Creative Commons CC-BY 3.0), streams containing Environment Agency information (© Environment Agency and database right))

Area of the major trackway, including the Bourne Park, Patrixbourne and Goodnestone survey areas, showing results of multiple survey techniques and other study by the CHP. (NB: polygons representing features are exaggerated with thickened outlines here to make them more visible at this scale.) (Lacey Wallace and Chris Blair-Myers with Kent Historic Environment record data and background DEM data; Crown copyright/database right 2017, an Ordnance Survey/EDINA supplied service)

This high-resolution analysis of the hinterland of Canterbury, where power, belief and memory intersected in the symbolic connections between people and the landscape, allows us to see the social interactions in higher definition than presented in works of synthesis. The complex and long-term development of meaning from the Bronze Age to the Roman period found within this case study area demonstrates that the binding values imbued in the landscape, and reinforced through the movement and presence of people, could be durable and potent.
SOCIAL ORGANISATION IN KENT
The ‘hillfort’ landscape and social patterning of IA Kent are still poorly understood. Though IA Kent is often grouped with the whole of South-East England in generalising discussions, it looks rather different from the so-called ‘hillfort zone’ further to the west. In Kent, hillforts can be tentatively dated to the Middle and LPRIA (generally starting and finishing later than elsewhere),Footnote 6 do not often provide evidence for dense occupation and may be positioned on the fringes of habitation. Here, perhaps even more than elsewhere, the connotations which attach themselves to ‘fort’ may be misleading and we have to be aware of a possible range of functions beyond a central defended place within a hierarchically dependent landscape. It has generally been assumed that western Kent contains a larger number of hillforts, with well-known examples at Oldbury, Tonbridge and Tunbridge Wells.Footnote 7 Until recently, east Kent could only offer ‘one proven hillfort’ — Bigbury/Bigberry near Canterbury (fig. 1).Footnote 8 This 15 ha site is positioned to the west of Canterbury overlooking the river Stour and seems to have been in use from approximately the third century b.c. to the first century a.d. If Bigbury served as a defensive location, or one from which to control the movement of people, the group/individual who built/controlled Bigbury may have ‘controlled’ a 6 km stretch along the ridge south-west of the hillfort and to the north as far as what becomes Watling Street (a possible ‘territory’ of at least 700 ha).Footnote 9 It has generally been thought to be a precursor to pre-Roman Canterbury, but the precise function of the site is still debated, with some rejecting the traditional notion of an elite residence and promoting possible ritual functions.Footnote 10 The relationship with LPRIA Canterbury cannot be ascertained on current evidence. Indeed, new evidence for other possible hillforts in the area has recently come to light and should be added to the ongoing debate on social patterning in ancient Kent. A hillfort at Homestall Wood, Harbledown, has been identified through LiDAR imagery,Footnote 11 sited on elevated land on the other side of a tributary of the Stour west of Canterbury, opposite Bigbury (fig. 1). The period of occupation is not yet securely known, but finds associated with the site suggest that it was in use in the LPRIA if not before. Many of these sites have only been identified, or better understood, in recent years and much work remains to be done to understand the implications of our newly populated vision of the landscape of east Kent.
In general terms, Kent, like the rest of the South-East, underwent significant social change in the LPRIA, in part as a result of close connections across the Channel and the coming of Rome.Footnote 12 One of the changes which is thought to characterise occupation in the South-East is the abandonment of hillforts (although several hillforts in Kent extend into the LPRIA) and the creation of enclosed/unenclosed oppida, which tend to have characteristics such as extensive dyke systems, non-hilltop locations, dense occupation and town-like economic functions. Champion identifies five such sites — Canterbury, Rochester, Quarry Wood camp (Loose),Footnote 13 Bigbury and Oldbury — but these, like the hillforts more generally, develop differently and may have served varied functions.Footnote 14 The occupied landscape of LPRIA Kent seems to have been heterogeneous. Since there was no systematic or imperially-defined method for people in Britain to follow to negotiate their status within the new Roman socio-political system, complex patterning in the rural landscape continues into the Roman period, though it is not necessarily of the same type. In some areas there is continuity of settlement without much change, in others continuity with radical changes, at least in form, and, in some areas, settlements are created on sites with little, or no, earlier activity.Footnote 15
The major Kentish Roman centres have diverse trajectories of development and several indigenous sites where social power may have concentrated in the LPRIA seem to have been abandoned by, or during, the early years of the Roman conquest, including Bigbury. The features of IA and early Roman Canterbury do not neatly conform to the traditional conception of the development of a civitas capital, as, for example, typified by a centre such as Verulamium. The Ver valley is marked by differentiation in farmstead sizes, extensive dyke systems, new cemeteries and the prominently positioned elite burial at Folly Lane.Footnote 16 The valley location that would accommodate Roman Canterbury (Durovernum Cantiacorum) offers evidence of settlement, enclosures and coin minting, though without clear traces of the results of a perhaps more coercive hierarchy, as in the Ver valley.Footnote 17 From the IA features, especially in the area that becomes the later Roman temple/theatre area, Millett has argued that it probably developed as a cult centre or sanctuary.Footnote 18 He further suggests that Canterbury may have been chosen as the civitas centre by the Roman administration ‘because the religious centre was a neutral meeting point where different tribal groups came together’.Footnote 19 Although the Roman administration and authors of our textual sources grouped the people of Kent together as the ‘Cantiaci’ or ‘Cantii’,Footnote 20 explorations of the LPRIA landscape around Canterbury suggest that there may have been several contemporaneous hillforts/enclosed oppida (e.g. at Bigbury, Homestall Wood and Bourne Park) which may reflect separate social groups and their ‘territories’, and that the Roman administration may have ignored and/or simplified pre-Roman social-territorial groupings. Cantium was positioned at a bustling nexus of interactions between the rest of Britain and the Continent and a neutral meeting point which did not ‘belong’ to a single social group may have been attractive.Footnote 21
As we have seen, the area surrounding Canterbury is allegedly not home to high-status rural Roman-period settlements and various hypotheses have been provided to explain this settlement distribution.Footnote 22 One could try to argue that perhaps the early lack of villas may be related to Canterbury's slow development, but even by the second century a.d., when the road network connected Canterbury to each of the well-developed port townsFootnote 23 and a recognisably urban settlement was constructed, the urban elite still chose not to build villa-type architecture in the hinterland. The proposal that the local elite lived solely in Canterbury, rather than in lavish country houses, is further undermined by a lack of elaborate town-house architecture in the civitas capital.Footnote 24 Andrews’ suggestion that the presence of the military and the classis Britannica acted to depress the local economy, resulting in the local elite not having the resources to expend on elaborate architecture,Footnote 25 seems unlikely given the relatively small numbers and irregular occupation of troops present. Black's argument that east Kent was annexed by the Romans before the west, and that the west was then a zone of resistance populated by Gauls who brought their villa traditions to confiscated land,Footnote 26 is not based on sufficient evidence and creates an overly schematised social distribution. Mattingly has suggested imperial ownership and investment in the case of the so-called ‘villa’ at Ickham (between Canterbury and Richborough, labelled ‘Ickham/Wingham’ on fig. 1), private non-civitas ownership in the north-west of the modern county, and a group representing the civitas of the Cantiaci in the north-east not interested in villa building.Footnote 27 This characterisation relies on Romano-centric concerns and the standard interpretation of the Ickham finds as an ‘imperial villa’, which may be overturned by current research.Footnote 28 It seems that, in all these interpretations, endogenous concerns and local patterning have been underplayed. Blanning (Reference Blanning2014), for example, has demonstrated that the choice of where to build a high-status complex may be closely linked to the geology of the area: the boundary between different bedrock geologies apparently being the factor with the highest correlation to villa distribution in Kent, strongly linked to the opportunity for mixed farming.Footnote 29 No doubt a constantly changing mixture of environmental and local and external social factors will have determined the distribution of elaborated rural architecture.
Millett compellingly asserts that we should instead regard lack of investment in high-status architectural complexes in the hinterland of Canterbury as a cultural decision.Footnote 30 It may not be that the local elites were missing from the landscapes or that they did not have adequate resources to build villas, but rather that they expressed prestige in other ways.Footnote 31 Certainly, the LPRIA elite in the South-East seem to have communicated and constructed their status, at least in part, through burial (e.g. the first-century b.c. high-status burials of the so-called ‘Aylesford-Swarling culture’ and the ‘warrior’ burials and barrow mounds at Brisley Farm, Ashford, and Mill Hill, Deal)Footnote 32 and it is likely that in certain areas they continued to do so,Footnote 33 choosing not to expend their wealth on new forms of masonry architecture. Roman-period burial mounds (e.g. around Canterbury and at Gorsley Wood, discussed below) and extensive extra-urban cemeteries and funerary structures represent changes in the form of burial in the Roman period,Footnote 34 but may also indicate a continuation of the social significance of the funerary ritual and monuments.
It became clear, however, at the beginning of our investigations that the vision of a villa-free hinterland around the civitas capital was itself an over-simplification. Significant sites of Roman-period settlement are indeed comparatively infrequent in the c. 10 km radius of rural areas surrounding Roman Canterbury, but those examples that have been recovered and recorded by the HER rarely make it into broader works and syntheses, making the apparent absence appear more stark.Footnote 35 As our analysis of the area south of Canterbury has shown, this absence of well-known sites may be partly a product of the agro-pastoral nature of the area and the relative paucity of development- and research-led archaeological inquiry. Work elsewhere in Kent — for example, on the Channel Tunnel Rail Link (HS1), at Westhawk Farm in Ashford and on Thanet — has demonstrated how much can be recovered in large-scale developer-funded excavations.Footnote 36 Indeed one major infrastructure project in the Canterbury hinterland, the construction of the A2 Bridge by-pass in the 1970s, resulted in the identification of many new features in the area.Footnote 37 Analysis by the project team of a range of evidence has brought to light the first villa likely to be associated with Canterbury, in Bourne Park, Bishopsbourne.Footnote 38 The aisled hall and bath-house at Wingham — which is, in any case, approximately equidistant to Richborough and nearer the Wantsum Channel than Canterbury — and the less convincing surface scatter of masonry at Blean (north of Canterbury) and the remains of walls at Swarling are the other contenders for high-status rural sites in the hinterland of Canterbury (fig. 1).Footnote 39 In order to explore the social identities and interactions in the hinterland of Canterbury, we need a more complete view of the archaeological record.Footnote 40 We must also avoid the generalising social commentary which splits IA and Roman Kent into, for example, east and west zones and be sensitive to local patterns within their broader context.Footnote 41
THE CANTERBURY HINTERLAND PROJECT
The CHP is one of several recent projects which are focusing attention on the countryside and landscape in antiquity. The impressive results from the Rural Settlement of Roman Britain Project are derived primarily from compilation of data from excavations, while the English Landscapes and Identities Project worked with ‘characterful’ databases, such as site data from the Historic Environment Record.Footnote 42 A key strength of the former is that it brings to light data previously available only through ‘grey literature’, while the latter examines changes across multiple periods. These projects, although combining large amounts of information for the first time and allowing for analyses of ancient rural Britain previously impossible, nevertheless leave gaps.Footnote 43
Analysis on a large scale (e.g. ‘the South-East’) does not allow for individual features to be visible, resulting in site-type designations and symbols on a map, while the site scale does not show the landscape with which the inhabitants would have been familiar. The landscapes that people created gave meaning to, and derived much significance from, smaller site-scale features. Our compilation of data on a sub-regional scale benefits from both large- and small-scale investigations. The use of geophysics as a precursor to excavation or in areas with known features is common;Footnote 44 the use of large-scale geophysics to investigate landscapes less so. The methodology here draws on the successes of other large-scale geophysical surveys — such as, in Britain, the Vale of Pickering surveyFootnote 45 — which have demonstrated that geophysical prospection over large areas can serve to join and make sense of seemingly ‘empty’ areas between ‘sites’ identified through other means.Footnote 46
Decontextualised, period-specific, broad-scale surveys are problematic, given that dots on the map from specific periods are commonly linked to each other, without awareness of the pathways, boundaries and intervisibility between them. The division, for example, in some studies between settlement and funerary ‘sites’ can also be unhelpful; rigid categorisation and narrow focus prevent integrated views of complex material. Bourne Park, with its apparent mixture of funerary and settlement features and overlapping material from the Bronze Age through to the early medieval period,Footnote 47 is a particularly good example of where site-type rigidity and narrow chronological focus would be misleading; to call it simply a ‘Roman villa site’, for example, would underplay the complexity of the archaeological realities. Indeed, in the context of the current discussion, it is not even clear that the term ‘site’, with its implicit notion of a bounded area of activity, is valid at all.
The CHP has, therefore, been conducted on a multi-period, sub-regional scale, putting a combination of evidence into a wider context and considering the physical and symbolic relationships between ‘places’ and features. We have employed a mixture of targeted large-scale geophysical and topographical analysis, comprehensive investigation of available aerial photographs, satellite and LiDAR imagery, metal-detected finds, and synthesis of results of antiquarian, commercial and academic excavation.Footnote 48 Each technique employed provides different information for a more complete understanding of the landscape and a balance between scale and resolution has been struck through full aerial photographic coverage of the whole of east Kent and areas targeted for more intensive investigations.Footnote 49 Examining connections to, and incorporation of, natural features and topography in how people moved through and perceived the landscape as they made choices and changes complements the study of the morphology of archaeological remains. This article focuses on the largest survey area at Bourne Park, Bishopsbourne (fig. 2), and includes results from investigations of the surrounding landscape, drawing also on our other surveys at Patrixbourne and Goodnestone (fig. 1).
PREVIOUS WORK IN BOURNE PARK
Bourne Park is an area of c. 70 ha of relatively open parkland between the villages of Bridge to the north and Bishopsbourne to the south, 5 km to the south-east of Canterbury (fig. 1). As is common across east Kent, there are a large number of barrow mounds or tumuli in Bourne Park, particularly of early medieval date. More than 100 tumuli were visible in the Park area in 1771 (some of which were excavated by prolific barrow-digger Bryan Faussett),Footnote 50 but have since been ploughed down. Lord Albert Conyngham, the one-time tenant of Bourne Park House and first President of the British Archaeological Association, excavated at least three early medieval barrows in the Park in 1844.Footnote 51 After purchasing Bourne Park, Matthew Bell found a number of Roman-period and early medieval burials when he excavated, and later dredged, the artificial lake in the Park in 1846 and 1898.Footnote 52 The Park also attracted the attention of a nineteenth-century vicar, Francis Vine, as, in his view, a site of Caesarean campaigning.Footnote 53 Vine's observations of excavations, cropmarks and earthworks have proved a valuable source of information, even if his interpretations are somewhat optimistic. Vine himself excavated three Roman burial mounds at Gorsley Wood (fig. 2), south-west of Bourne Park, in 1882 or 1883.Footnote 54 These were inhumations in stone-lined cists covered by (probably conical) burial mounds without surrounding ring-ditches. They measured c. 9–12 m in diameter (which makes them ‘large’ according to Struck)Footnote 55 and were enclosed by an earthen bank. Roman barrows are features of elite burial and several are known around Canterbury, although they are nowhere near as numerous as the Bronze Age and early medieval examples.Footnote 56
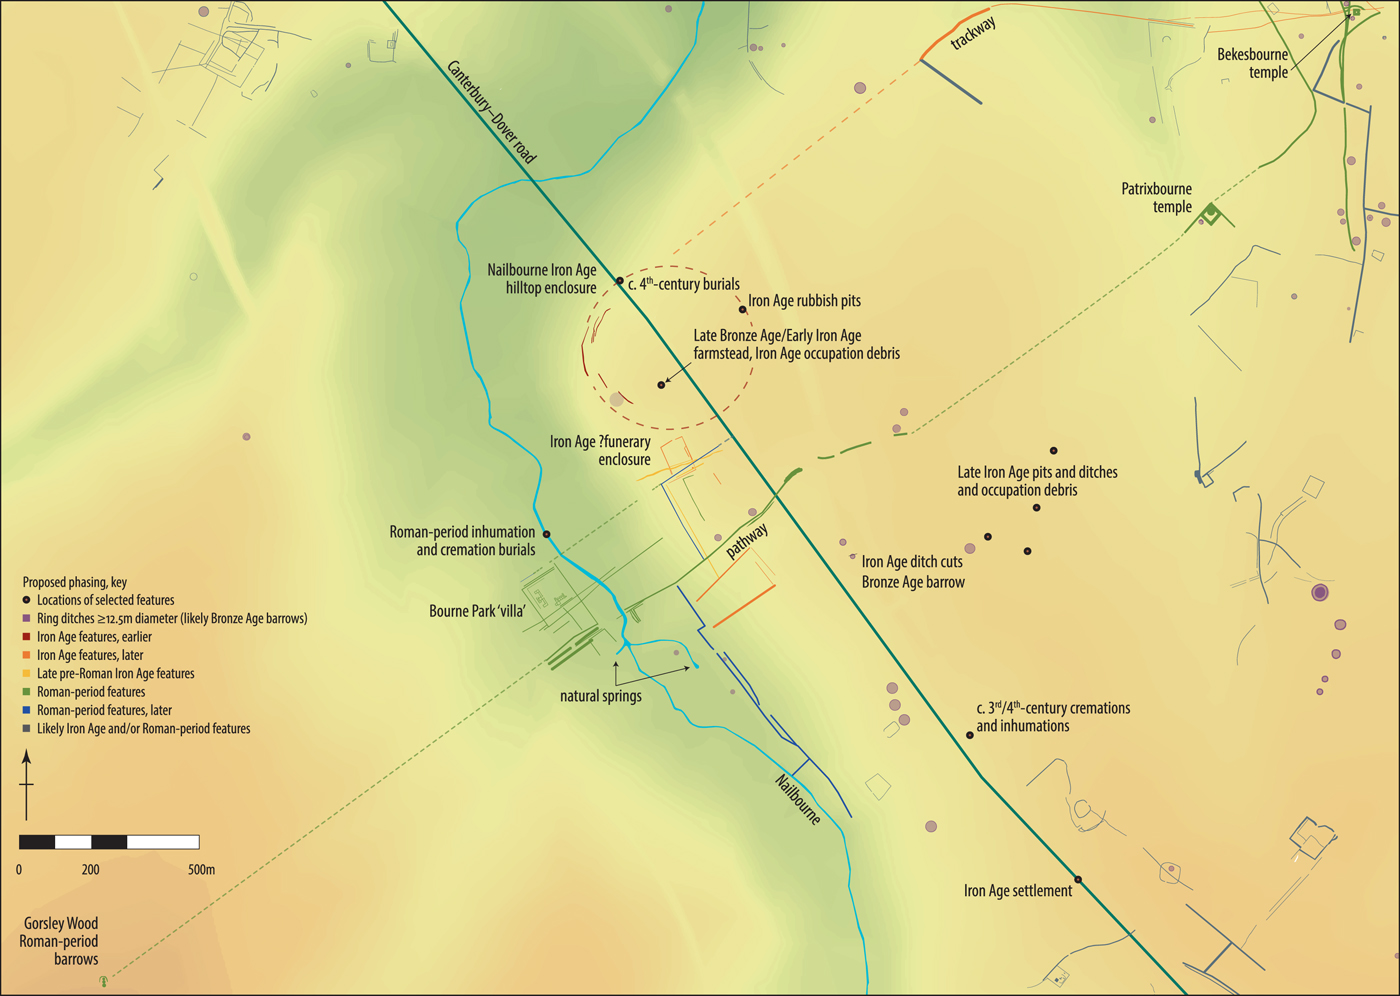
During the construction of a housing development in 1961, near the crest of Bridge Hill east of Bridge Hill Road (i.e. outside Bourne Park), M.B. Watson excavated two large pits and an occupation area dating to the LPRIA (‘Iron Age rubbish pits’ on fig. 3).Footnote 57 Approximately 300 m south-west of this excavation on Bridge Hill within Bourne Park, from 2003 to 2006, Paul Wilkinson led a Kent Archaeological Field School excavation of a multi-period site.Footnote 58 Features within this excavation area dated from the late Neolithic/early Bronze Age through to late post-medieval (including a large number of early medieval burials), but of most direct relevance here is the ‘farmstead’ within an enclosure ditch, represented by an area of pits, post-holes and ditches dating to c. 750–550 b.c. (‘Late Bronze Age/Early Iron Age farmstead, Iron Age occupation debris’ on fig. 3). Together, these excavations suggest two phases of occupation, perhaps with shifts in the geographical focus of activity in different periods. The LPRIA pit assemblages may represent structured deposits — they contained pottery, animal bone (ox, sheep/goat and pig), charred wood, a spindlewhorl, fragments of copper alloy and a copper-alloy bead — possibly related to a ritual deposition.
Interpretation of results of the Bourne Park survey indicating suggested phasing of major features. (Lacey Wallace and Chris Blair-Myers with Kent Historic Environment record data and background DEM data; Crown copyright/database right 2017, an Ordnance Survey/EDINA supplied service)

IA activity in the wider area is also apparent from the coin finds from Bridge and Bishopsbourne which suggest far-reaching social networks in the first century b.c. An IA silver coin was found in the Park and other IA coins are known from the Bishopsbourne and Bridge area, including six IA copper-alloy coins of the Cantii, one of the Atrebates, two Thurrock-type potins of the late second/early first century b.c., a struck gold quarter stater of the Morini dating to c. 75–60 b.c., an imported Gaulish cast bronze potin dated to c. 100–50 b.c., a stater of the Durotriges dating to the second half of the first century b.c. and an IA silver coin of Cunobelin from Bridge.Footnote 59
CANTERBURY HINTERLAND PROJECT WORK IN BOURNE PARK
In addition to the ongoing county-wide analysis of aerial photographs, LiDAR and antiquarian and modern excavations, the first phase of the CHP focused on Bourne Park. Bourne Park is private land with public access, currently in active pasturage, the location of a scheduled monument (early medieval cemetery, NHLE 465133), and not under threat from development, agriculture or environmental factors. The Park lies on chalk downs, with alluvial clay and flints in the river valley and exposed chalk on the ridges. The Roman-period Dover–Canterbury road, and probably an earlier trackway (‘ridge route’), ran along the ridge to the north-east of the Park and is now mostly overlain by Bridge Hill Road (former A2).
The Bourne Park survey comprised gradiometry (readings taken every 0.25 m along 0.5 m traverses in 30 × 30 m grids with a Bartington 601-2 fluxgate gradiometer over c. 60 ha), electrical resistance (readings taken every 0.5 m along 0.5 m traverses in 30 × 30 m grids with a Geoscan Research RM15-D resistance meter in parallel twin-probe configuration over an area measuring 1 ha), ground-penetrating radar (GPR; undertaken by Lieven Verdonck using a Sensors & Software Spidar network at 500MHz frequency, of several channels, mounted in parallel onto a wooden frame and towed behind an all-terrain vehicle with a transect spacing of 0.125 m and measurements taken every 0.05 m over an area measuring 1.7 ha), and a full micro-topographic survey,Footnote 60 plus detailed investigation of past excavations, aerial photography and metal-detected finds. Some of the metal-detected finds collected in the 1980s and 1990s from Bourne Park have been examined, but the majority of these are known only from an archived list as they were most likely sold. Additionally, two small trenches were excavated in 2016 in collaboration with Steve Willis of the University of Kent. The initial results on the character of the buildings investigated are included here. Other CHP surveys drawn on in this article are the gradiometry survey (2017) within a large arable field at Goodnestone (a site of prior intensive metal-detecting and surface collection) and the gradiometry and GPR survey (2014) within a private garden at Patrixbourne (see survey areas on figs 1 and 2).
Combined results are simplified for presentation in fig. 2. A detailed description of the Bourne Park survey up to 2014 has been published and need not be repeated here,Footnote 61 but the main features that constitute the basis for the interpretations here are shown in schematic form in fig. 3. A palimpsest of features has been revealed and phasing of the features shows a variety of changes over time. Little has been excavated, so the phasing is largely based on alignments, morphology, relationships, similarity to excavated features and the relative chronologies evident in intercutting/abutting relationships of the cropmarks and geophysical anomalies. Key features are briefly described in the following sections: the Roman-period road, ridge route and stream valley; the major trackway and paths; the large enclosures; significant concentrations of settlement; temples; and the barrow mounds and other burials.
THE VALLEY, RIDGE ROUTE AND ROMAN ROAD
North of Bourne Park lies the intersection of the Nailbourne stream valley with the Roman-period road and the hypothesised pre-Roman ridge route between Dover and Canterbury. Today, water is not always present in the stream and it can be crossed in times of drought. Bishopsbourne, named Burnes in the Domesday Book, was held directly (in demesne) by the Archbishop of Canterbury and was of comparable size to the royal estate at Faversham and larger than that at Eastry.Footnote 62 Burnes contained two mills, indicating that the flow of water must have been more reliable and copious in the past. Two springs within the Park provide the immediate source of the water; springs are relatively rare in the area with the nearest being c. 4 km upstream and no others within the area of fig. 2. The source of the Nailbourne lies at Lyminge and the stream continues as the Lesser or Little Stour to the Wantsum Channel (fig. 1).
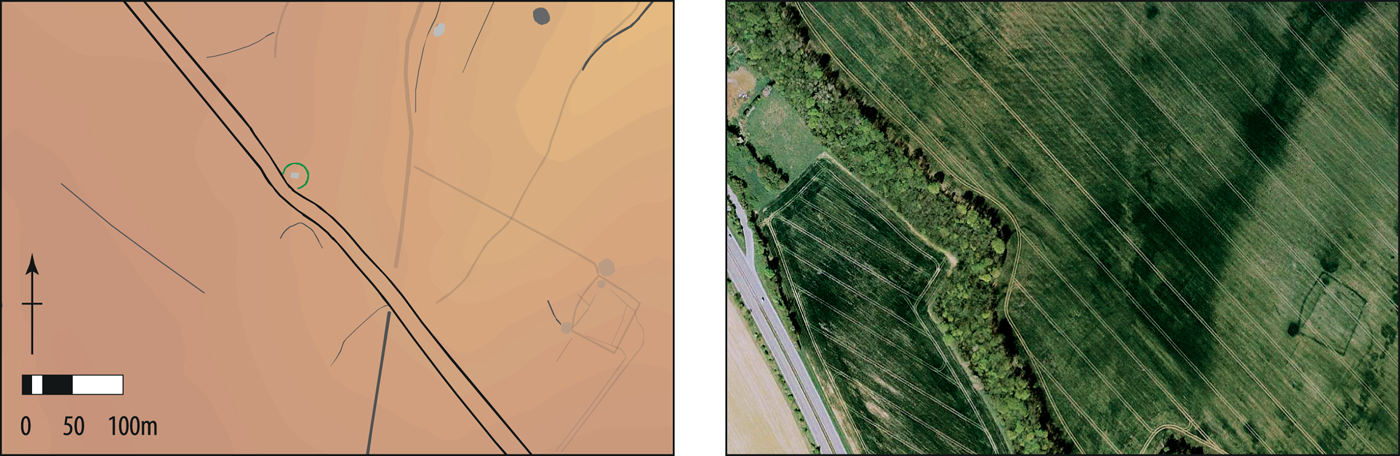
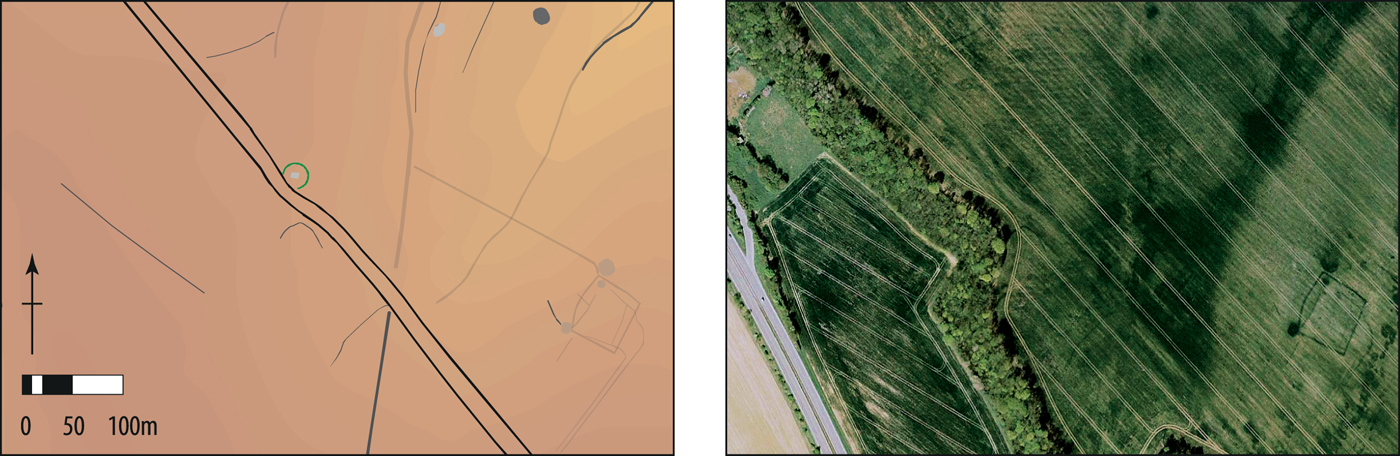
The line of the Roman-period Canterbury–Dover road is relatively well known and is partially visible as cropmarks, in which we see it deviate around a probable Bronze Age barrow (figs 2–4). Elsewhere, it has been excavated during road and utility works along the line of the modern road (the Old Dover Road/Bridge Hill/A2), which overlies some of it.Footnote 63 Precisely when the road was provided with a metalled surface and roadside ditches is not entirely clear, and may have differed along the route, but is likely to have been in the late first or early second century a.d.
Detail of Canterbury–Dover road deviating around probable Bronze Age barrow. (Lacey Wallace and Chris Blair-Myers; including DEM data (Crown copyright/database right 2017, an Ordnance Survey/EDINA supplied service) and 2007 Google Earth satellite image (© 2018 Infoterra Ltd. and Bluesky))
MAJOR TRACKWAY
A significant trackway is a dominant feature in the area of fig. 2, appearing in cropmarks at times as a single ditch and elsewhere as parallel ditches defining a path. In the gradiometry results from the Goodnestone survey area, its character as a ditch-lined path or trackway is clear. The nature of cropmarks means that the trackway is identifiable only intermittently, but it appears to continue for several kilometres, curving towards the ridge route/road at both ends (fig. 2). While the locations where the trackway meets the road are hypothetical extensions from the nearest visible sections, it seems that the northern end met the road just south of the Nailbourne crossing and the southern end perhaps at the location where the Canterbury–Dover road turns slightly to descend into the valley towards Dover. It appears to link the Nailbourne hilltop enclosure (described below) to the probable IA–Roman-period nucleated settlement/temple/sanctuary site at Goodnestone (described below), then turns south to rejoin the ridge route before the road enters the Dour valley.
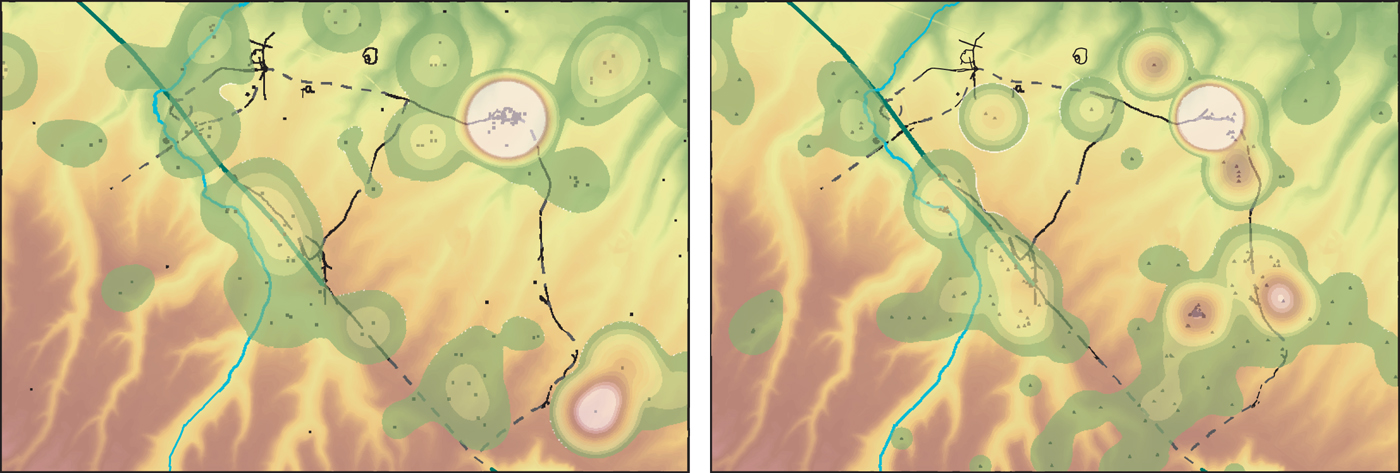
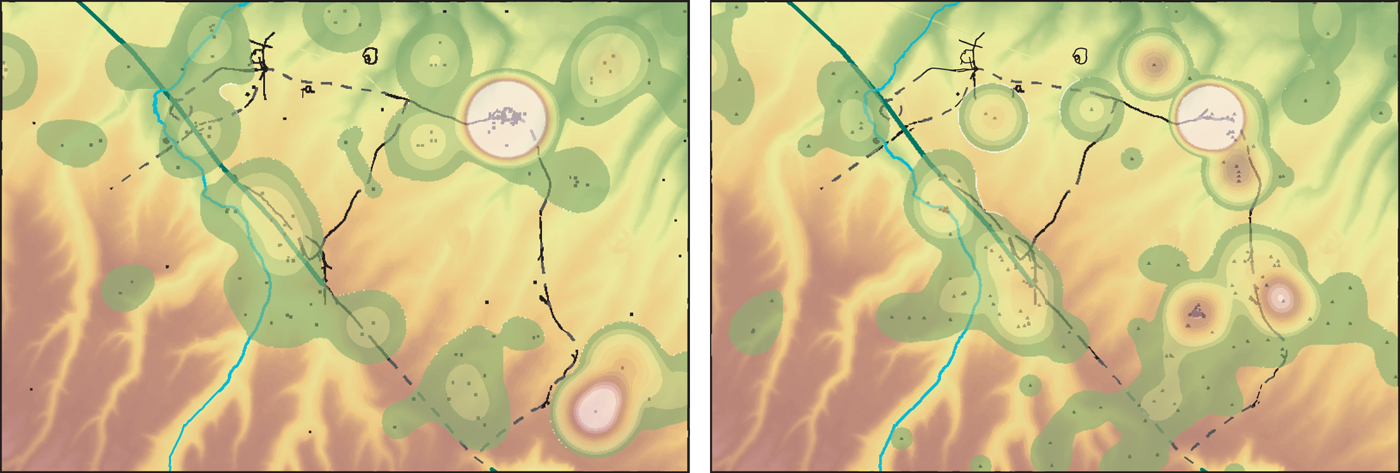
Sites of interest associated with this trackway provide further evidence of its significance in connecting meaningful places and facilitating communal activities (fig. 2; see also below). Its importance can also be seen in the distribution of both IA and Roman-period Portable Antiquity Scheme finds which cluster along the ridge route and trackway (fig. 5). This trackway respects a number of Bronze Age barrows (and therefore seems to post-date them) and appears to connect four probable IA enclosures and the major IA/Roman-period nucleated settlement at Goodnestone, indicating that it is probably of broadly IA date. At the Bekesbourne Romano-Celtic temple (discussed below), there appear to be two phases of the trackway, one of which crosses the temple building, indicating that the trackway was possibly altered in preparation for, or shortly after, the construction of the temple.
Area of fig. 2 showing a kernel density plot of Iron Age (left) and Roman-period (right) Portable Antiquities Scheme finds (accessed 21/03/2017), highlighting the significance of the trackway. (Lacey Wallace and Chris Blair-Myers with Kent Historic Environment record data and background DEM data; Crown copyright/database right 2017, an Ordnance Survey/EDINA supplied service)
The half of the trackway nearer to Bourne Park and Canterbury is connected back to and across the ridge route via at least one, and possibly two, ‘paths’, each apparently defined by single ditches or surfaces (fig. 2). The first path begins along the trackway approximately mid-way between the Bekesbourne temple and the Goodnestone nucleated settlement and continues south/south-west to intersect with another path that runs along the ridge and with the Barham temple (described below). The second, more northerly, of the two paths begins closer to Canterbury, to the north of the trackway, at one of the probable IA large sub-circular enclosures (described below), where it has the character of a ditch-lined road. It crosses the trackway at the location of the large Bronze Age barrows and the Romano-Celtic temple at Bekesbourne (described below). One branch continues south (for only a short distance before, in our evidence at least, it is lost) and the other branch continues further, initially as a discontinuous feature in our evidence, to the south-west past the temple at Patrixbourne (described below), and (although only intermittently visible in the aerial photographs) then as a strong linear feature through the gradiometry survey area in Bourne Park. Where the path is most clear in the Park, it runs alongside two large Bronze Age barrows and across the valley between the ‘villa’-type structural complex (described below) and the natural springs (fig. 3). It has been shown in figs 2 and 3 to continue south and west because of its neat alignment to the Roman-period barrows in Gorsley Wood. The major trackway and both paths appear to form significant routes across the landscape that allowed people to reach places of worship, reverence and burial.
Within Bourne Park, this path is crossed by one of the first phase of field boundaries/enclosures but abutted by a boundary of the second phase (fig. 3), and therefore post-dates the first phase of enclosure and the (probably funerary) rectilinear enclosure (described below). It is possible that a ‘large probably IA/Belgic enclosure ditch’ excavated under rescue conditions during construction of the modern A2 Bridge by-pass in 1974 could represent drainage or demarcation of this feature (i.e. a portion of this ‘path’), although the conditions of excavation and imprecision of the published plan make it difficult to correlate precisely.Footnote 64 As the path may link Roman-period burial mounds at Gorsley Wood to the probable temples at Patrixbourne and Bekesbourne, and because it was constructed in alignment with the valley enclosures and perpendicular to the Roman road, it is likely of Roman date. The path may have been used for burial processions at the burial mounds and religious rituals enacted at the temples at its north-eastern end.
LARGE ENCLOSURES
Three large and one smaller sub-circular ditched enclosures lie near to the trackway and appear to be directly related to the route it takes from the Nailbourne/ridge to the nucleated settlement at Goodnestone (although which came first, trackway or enclosures, is unclear) (fig. 2). Beginning where the trackway appears to meet the ridge route just south of the Nailbourne stream, geophysical survey and aerial photographs indicate the partial remains of a c. 9 ha curvilinear multi-ditched hilltop enclosure (‘Nailbourne Iron Age enclosure’ on fig. 3) close to the Nailbourne. This enclosure consists of fragments of concentric sub-circular ditches near the crest of the hill defining its western side; extrapolating in an approximate circle, the enclosure would extend across the ridge and road, and, therefore, probably pre-dates the road. These ditches have not been dated through excavation, but a multi-ditched hilltop enclosure of this size is most similar to IA examples. Finds from the two excavations discussed above, which probably fall within the area of the enclosure, suggest possible use in the Early, Middle and LPRIA.Footnote 65 A possible Bronze Age barrow, now represented by a c. 35 m diameter ring of dipolar anomalies, also lay within the area of this enclosure (fig. 3).
Following the trackway c. 2 km north-east, a second c. 6.7 ha irregular enclosure (at TR 203 550) lies to its north. The ditch-lined path (described above) runs alongside this enclosure and south to the Bekesbourne temple, with another possible branch running south-west to meet up with the major path within the Bourne Park survey area. One kilometre east, south of the trackway, lies a sub-circular enclosure (c. 95 by 120 m) with two ditch-lined entrance paths leading to breaks within its enclosure ditch. One kilometre further east down the trackway and c. 600 m to its north, lies the remains of a complex irregular enclosure (at TR 229 548) represented by remarkably clear ditches. It measures c. 8 ha and contains two smaller enclosures, the smallest of which is sub-circular. While none of these enclosures has been investigated with excavation or survey, their sizes and shapes are consistent with Middle-to-Late IA enclosures.
To the south of the Nailbourne hilltop enclosure lies a rectilinear enclosure (fig. 3) identified in geophysical results, with straight (but not equal) sides, sharp corners and two entrances (on the northern and western sides). This enclosure was larger in an earlier phase (c. 67 by 100 m) and contains in its south-eastern corner a c. 7 m diameter anomaly. In a second phase, the enclosure was reduced in size (c. 67 by 60–71 m) and a substantial ditch/terrace constructed parallel to it, to the south. The enclosure is at a c. 70 degree angle to the Roman road, suggesting it may pre-date it. In Kent, rectilinear enclosures can be Bronze Age, IA or Roman-period, settlement or funerary. While sub-rectangular enclosures of this approximate size are known from the Bronze Age (e.g. the beaker-period enclosure at Minster-in-Thanet, c. 80 by 40 m)Footnote 66 and Late Bronze Age activity was noted in nearby excavation,Footnote 67 the sharp corners of this enclosure appear to be more similar to IA and Roman-period examples. The relatively small area indicates that it was perhaps a farmstead or funerary enclosure — internal features form no obvious structural patterns — but the chalk is close to the surface on this steeply-sloping hillside, while the stream, springs, alluvium and relatively flat site in the valley bottom would be more conducive to occupation and cultivation, perhaps supporting a mortuary function. Additionally, the substantial parallel ditch/terrace to its south suggests a monumentalisation that is not characteristic of IA farmstead enclosures. While larger than most ditched mortuary enclosures of the IA in Britain, this enclosure can be compared to large funerary enclosures on the Continent (e.g. Acy-Romance ‘La Croizette’ c. 80 by 21 m).Footnote 68 Its unequal sides and lack of alignment and orientation to the Roman road make a Roman-period ditched or walled cemetery unlikely.Footnote 69 The large anomaly in the south-eastern corner could represent a pit, pyre feature or burial vault.
SETTLEMENT
IA and Roman-period occupation is known in the area from surface finds and small-scale or rescue excavations, many along the ridge route and discovered during modern roadworks and construction along/near the modern A2 (fig. 2). At the approximate midway point along the length of the trackway, a dense area of enclosures has been revealed through the CHP 2017 gradiometry survey at Goodnestone. A large number of metal-detected and surface finds have been recovered over the last thirty years at this site, including nearly 300 IA coins, an exceptionally high density. For comparison, there are c. 2,577 IA coins catalogued by the Portable Antiquities Scheme (which includes the Celtic Coin Index) from the whole of the area covered in fig. 1, making those from this single field more than 10 per cent of that total. The character of the assemblage of other metal-detected finds there (e.g. c. 2,900 Roman coins spanning the mid-first century to the late fourth century, adornment, military objects, pottery etc.) indicates a possible temple or sanctuary site with origins in the LPRIA.Footnote 70 Geophysical survey revealed a complex nucleated rural settlement of enclosures separated by pathways leading to an open space, while a rectilinear feature in the field to the east visible in aerial photographs is thought to be an ancient masonry building by those who plough the land.Footnote 71
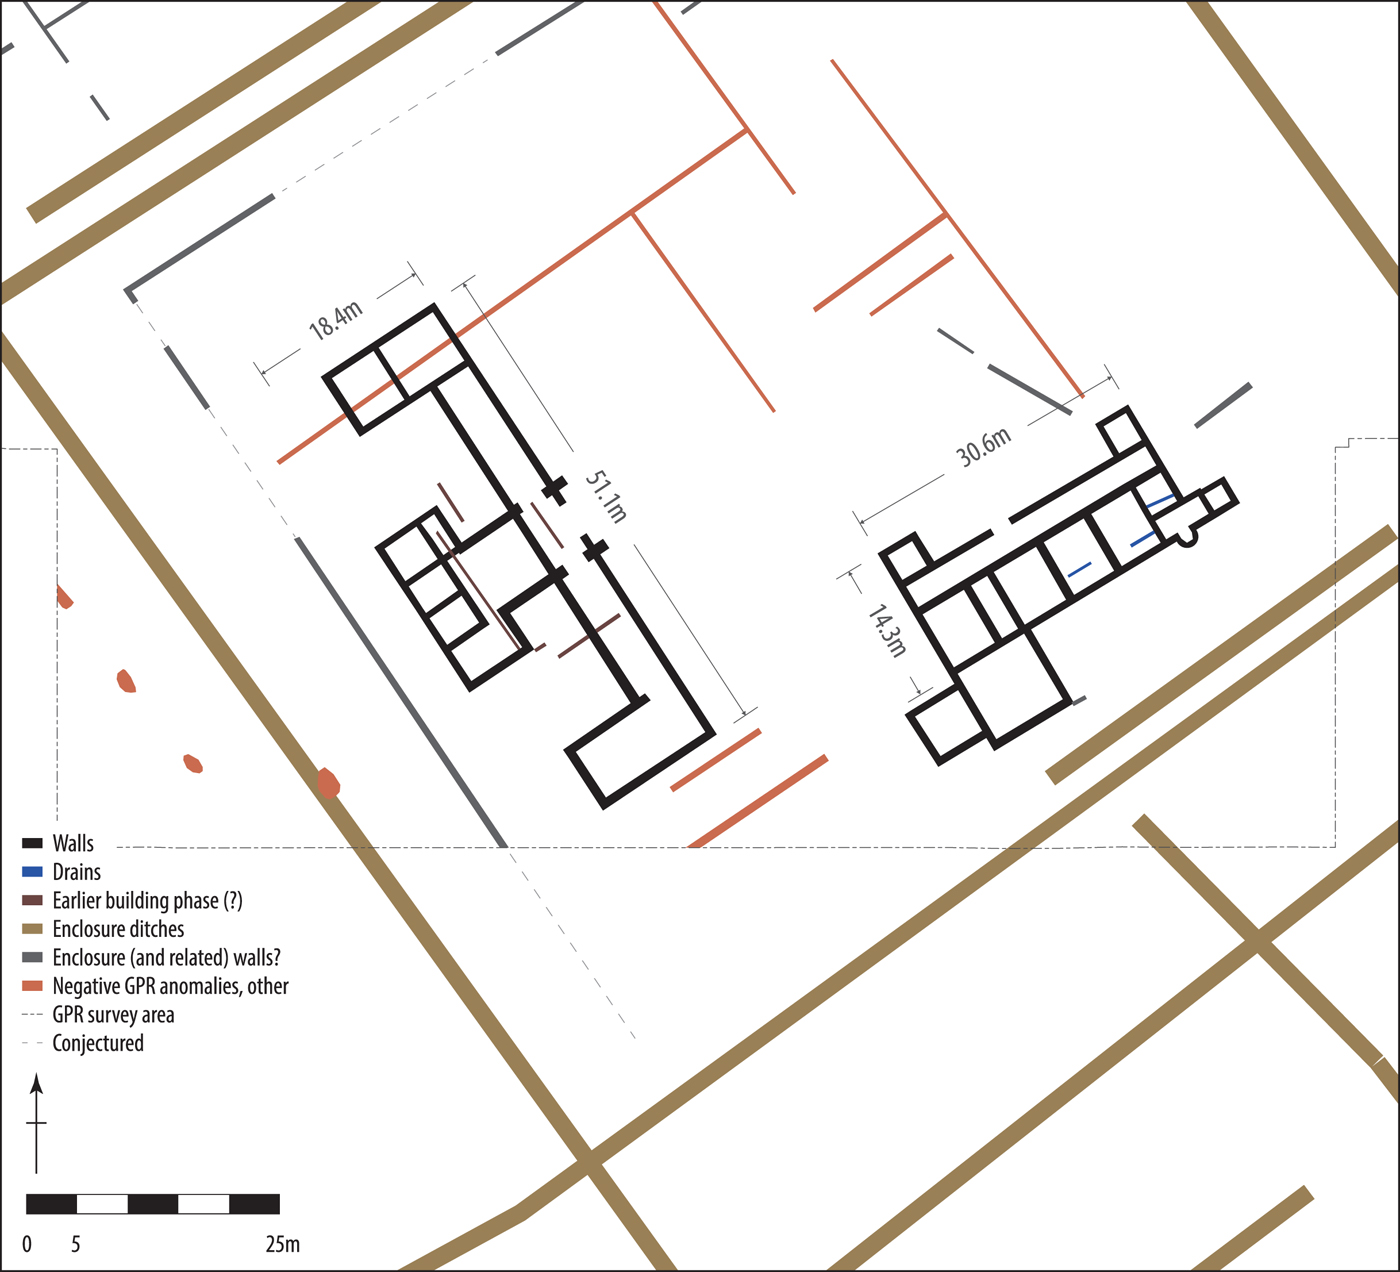
Within the Bourne Park survey area, a high-status structural complex lay in the valley bottom which is visible as anomalies in aerial photographs, gradiometry, electrical resistance and GPR. One large, possibly walled, enclosure and several smaller enclosures lie perpendicular to the Roman road on the south-western side of the stream and metal-detected coins and limited excavation confirm habitation in the valley bottom enclosures in the later Roman period at least. Within the largest enclosure are two buildings: the easternmost of these is a typical ‘winged-corridor’ building with a façade measuring c. 30.6 m, while the western structure is of an unfamiliar form with a long ‘room’ along a frontage measuring c. 51.1 m, two wings projecting back from each end, and a T-shaped wing at the rear of the centre (fig. 6). The western structure has an uncommon ground plan for which we have yet to find a close parallel, although the Winterton villa in Lincolnshire is similar.Footnote 72 Its wide façade suggests that it may have served to communicate wealth and status to those viewing it from the road. The structures had walls of rough flint and there is evidence of some architectural pretension in the form of ceramic-tiled roofs, at least one hypocaust room in the winged corridor building, painted wall-plaster and possible window-glass. The winged-corridor building appears Romano-British in character and can be compared to many similar row-type buildings with a corridor and pavilions added; this structure is perhaps most similar to that at Mansfield Woodhouse in Nottinghamshire.Footnote 73
Schematic and simplified interpretation of the GPR and gradiometry survey results of the Bourne Park high-status structural complex. (Lacey Wallace and Lieven Verdonck)

Although only full-scale excavation would allow us to test whether this complex follows a common pattern whereby Roman-period buildings, first in timber and later in masonry, follow occupation on a LPRIA site, the GPR results indicate that at least one earlier rectilinear structure preceded the western structure. A possible third building (visible as an area of high electrical resistance with some linear features in the GPR results) could be a processing/storage building, similar to those on other ‘villa’ sites in south-eastern Britain.Footnote 74
PROBABLE TEMPLES
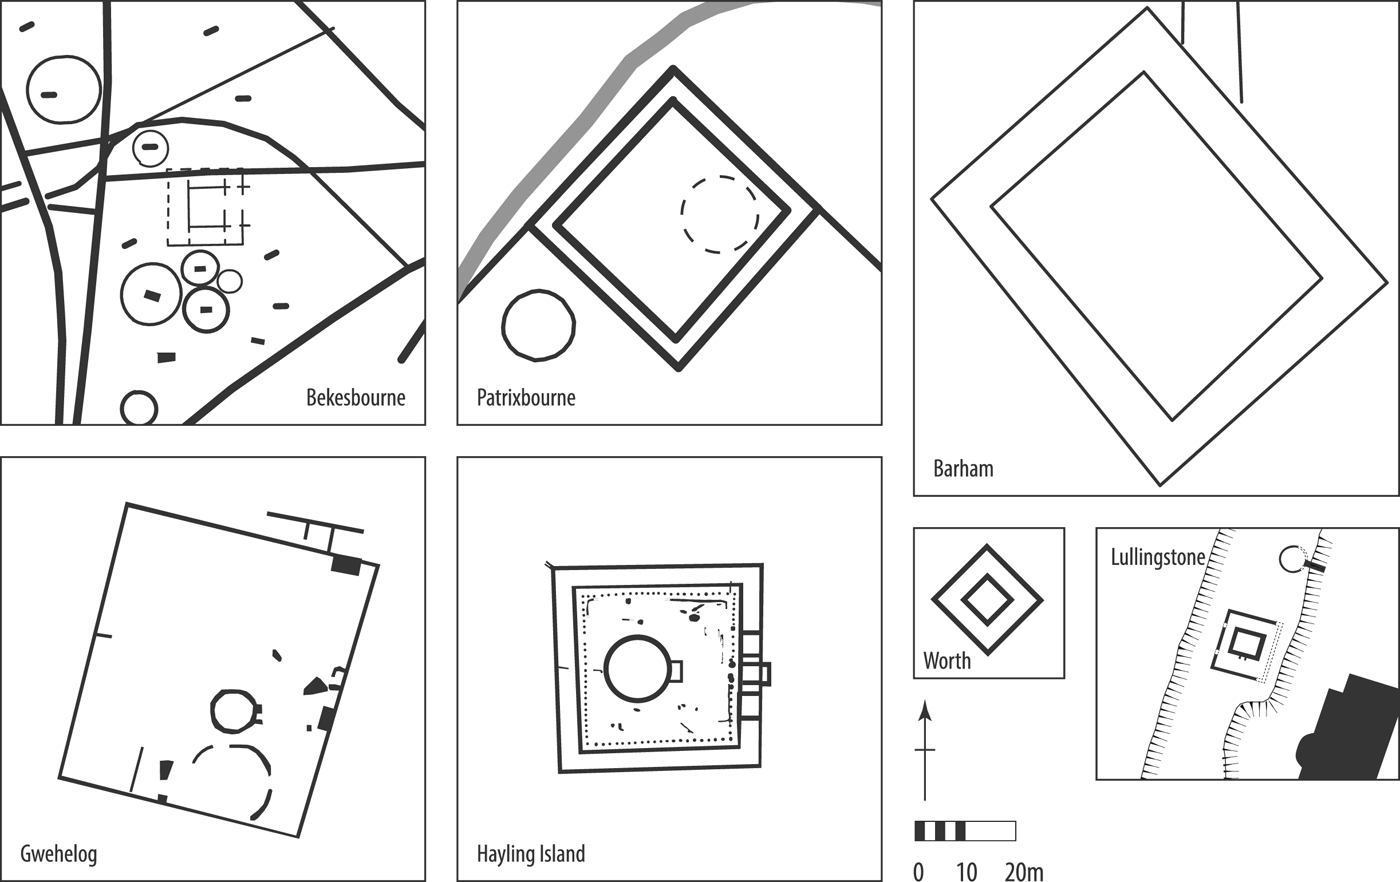
The probable Bekesbourne Romano-Celtic temple (figs 3 and 7) is located on the south side of the major trackway (which seems to have been re-routed after the temple was constructed to curve around it) at the intersection of one of the paths in an area of probable Bronze Age (and, later, early medieval) barrows. It is aligned approximately east–west with an entrance on the eastern side. The available evidence appears to show only the temple building, which was perhaps of the type that we find, for example, in Kent at Worth, a nearly-square roofed structure comprising an outer wall of chalk blocks and smaller internal cella, or at Lullingstone, where the later phase of the ‘temple mausoleum’ consisted of an inner cella surrounded on all sides by an open veranda supported by pillars/columns.Footnote 75 The outer ‘wall’ at Bekesbourne measures c. 15 by 15 m and the cella is c. 8 by 7 m. This structure is currently known only from aerial photographs and satellite imagery.
Interpretations of possible temples at Bekesbourne (perhaps of Lullingstone type), Patrixbourne (possible portico or ambulatory and internal structures, cf. Hayling Island) and Barham (similar morphology to Patrixbourne, but nothing known of internal structures). Temples at Gwehelog (after Wilson Reference Wilson and Burnham1990), Hayling Island (after King and Soffe Reference King, Soffe and Jones1991), Worth (after Klein Reference Klein1928) and the temple-mausoleum at Lullingstone (after Meates Reference Meates1979) shown to aid comparison. Scale 1:2,000. (Lacey Wallace and Chris Blair-Myers)

Approximately 700 m to the south-west of the Bekesbourne temple lies the probable temple at Patrixbourne (figs 3 and 7), which is on the same alignment as the road.Footnote 76 Intermittent stretches of ditch may link these two and the path that appears to reach the Gorsley Wood barrows could be the same curvilinear feature that runs alongside the north-west of this enclosure. Aerial photographs, gradiometry and GPR at Patrixbourne revealed a double rectilinear enclosure aligned north-west to south-east measuring c. 43 by 41 m with an arrangement of pits or post-holes in the north-eastern internal quadrant indicating a possible round structure c. 15 m in diameter, perhaps a cella. No entrance is visible, but the north-eastern side had been damaged by a modern storage tank. Given the size of the double rectilinear feature, it can perhaps be compared to the temple portico at Hayling Island, rather than representing the ‘Romano-Celtic’ temple type identified at Bekesbourne. It is unclear from the GPR whether the feature represents ditches, masonry walls (as at Hayling Island) or timber structures.
The second, more definite, path linking the trackway to the ridge route/road leads to the enclosure of the possible temple at Barham, which was partially excavated during the construction of the A2 bypass, although it has never been fully published.Footnote 77 As at Patrixbourne, a large double-rectilinear enclosure (outside measurements c. 72 by 60 m; interior c. 55 by 41 m) there may again represent the edge of a temenos within c. 20 m of, and also aligned to, the northern side of the Canterbury–Dover road, with a cella (not identified) within. Stukeley described three barrows (one larger and two smaller) enclosed in a double-square entrenchment near this location, possibly indicating the re-use of this enclosure for early medieval burial mounds.Footnote 78
Enclosures surrounding temple buildings are common in LPRIA and Roman Britain, sometimes masonry built. The double-rectilinear enclosure is less common, however, and parallels for such features are usually sought in a band across central Gaul. The boundary portico of the Hayling Island ‘Gallo-Roman’ temple provides the closest parallel in Britain for the features at Patrixbourne and Barham.Footnote 79 But other large double-ditched/portico enclosures known elsewhere in Britain at, for example, Gosbecks (measuring c. 100 by 100 m), Gwehelog (c. 50 by 56 m)Footnote 80 and Hailey Wood Camp (c. 70 by 60 m), may fit into this group.Footnote 81 Double rectilinear features, if of significant size, may need to be considered of ‘Hayling Island type’ rather than large examples of the more common British ‘Romano-Celtic’ type. It is risky, in the absence of more secure evidence for these temples, to be firm in making precise links to comparanda in Britain and Gaul.
BURIALS AND BARROWS
Large ring-ditches which may represent Bronze Age round barrows are plentiful in this area, as across most of east Kent.Footnote 82 Analysis of aerial photographs and excavations has identified c. 2,400 ring-ditches in the area shown in fig. 1, c. 1,260 of which measure more than 12.5 m in diameter and probably date to the Bronze Age — the remainder are more likely early medieval (Roman-period barrows often lack a surrounding ring-ditch, as at Gorsley Wood). Within the area shown in fig. 2 lie slightly fewer than 600 probably Bronze Age ring-ditches greater than 12.5 m in diameter and slightly fewer than 200 smaller, probably early medieval, examples; within the area of fig. 3, the 46 supposed Bronze Age ring-ditches are illustrated. The impact of one of these barrows on the line of the Roman-period road has already been noted — the road deviated around the barrow as illustrated in figs 2 and 4. Elsewhere, the location of the Bekesbourne temple appears to be related to the large Bronze Age barrows and the path leading across the valley in Bourne Park has been positioned to run alongside other large barrows.
Burials of IA and Roman date cluster along the ridge route and in the valley. Only one certain IA burial is known — that of the Bridge helmet burial.Footnote 83 Roman-period burials have been identified only along the road,Footnote 84 in the valley near to the high-status structural complexFootnote 85 and monumentalised as burial mounds across the valley in Gorsley Wood.Footnote 86
DISCUSSION
DISPLAYING POWER
For overland travellers from Dover, having ascended onto the ridge from the valley of the river Dour, the Nailbourne is the first stream they would encounter on the ridge route, c. 19 km north-west of Dover and c. 5 km before reaching the Stour and Canterbury (fig. 1). While the Roman port (Portus Dubris) may not have developed significantly until the second century a.d., the Dover Bronze Age boat (c. 1550 b.c.) and Langdon Bay continental tools lost/deposited at sea (c. 1300–1150 b.c.) are the most famous of the finds that demonstrate that sea-going vessels travelled between the Continent and Dover from at least the Bronze Age.Footnote 87
Millett has argued that, in the Roman period, military personnel and traders of bulk goods would probably have travelled by water to Canterbury (whence access to London, the hub of the Roman road network, is easy), but others would more likely have taken the shortest Channel crossing and continued overland.Footnote 88 Following this hypothesis, those travelling through the landscape to, or past, Canterbury in the Roman period from the Continent via Dover were probably more often those with non-military roles and smaller entourages. It is more likely that people travelled along the drier, higher ridge route with wheeled vehicles, perhaps carrying goods inland from the Continent, and along the valley with animals, so that they would have easier access to water.
In travelling from the Dover area along the ridge towards Canterbury/Bigbury, people and their goods would have been halted if they could not easily cross the Nailbourne where the ridge plunges down (c. 40 m drop over 500 m today) into the Nailbourne valley, at the modern village of Bridge. The more recent changes to the stream make it difficult to know if there was a ford or bridge at this location, but the combination of the steep slope and water crossing suggest the possibility that this intersection was a good location for stopping or slowing heavy goods-laden carts and pack animals. The size, date and location of the Nailbourne hilltop enclosure and associated evidence suggest a hillfort and indicate that there was either a local organisation of, or broad co-ordination of, control of the routes to/from Dover via Canterbury at this ridge route–river intersection.Footnote 89
The positioning of the later high-status structural complex in the valley appears to have been carefully chosen to link the former control point to the Roman-period display of wealth and status. The Nailbourne and the two springs in the valley close to the ‘villa’ were significant water sources for settlement and animal husbandry in the area — in addition to possibly being of ritual significance for the genii loci — and the people who controlled access to these could exert power over the local population. The groups who organised the construction of monuments for communal use, such as the large IA enclosures, the temples and the major trackway linking the nucleated settlement/temple/sanctuary site at Goodnestone to the temples and ridge route, would have had the ability to direct labour and make (possibly collective) decisions about the locations and character of these structures. Encouraging, coercing or forcing people to engage in such labour probably involved the control of resources such as land, agricultural surplus or wealth.
It is impossible to reconstruct the precise nature of the connection between the Nailbourne hilltop enclosure — probably out of use at some point during the LPRIA, but certainly defunct after the construction of the Canterbury–Dover Roman road, which ran through it — and later landscape features, including the high-status Roman-period buildings and enclosures in the valley bottom. However, the proximity and relationships of orientation and visibility between the ‘villa’-type structures, which are rare in the vicinity of Canterbury, and the large IA hilltop enclosure do not appear to be random and may represent expressions of power and status over a long period. Even if the IA enclosure was no longer in use or its ditches visible, the memory of the social significance of the place may have been retained by the local population. How such social memory may have persisted we cannot know,Footnote 90 and we should not underestimate the inherently attractive location of the site, but the presence of a possible hillfort (not common) so near to the villa (very rare) is difficult to ignore.
It is not simply proximity that links these places, however. The most advantageous angle for viewing the later Roman buildings is from the intersection of the road and the former Nailbourne hilltop enclosure (fig. 3), which provides a sweeping view down into the valley that would present the viewer with both faҫades of the two buildings beyond the stream (i.e. the faҫades face north-east and north-west respectively and are most visible from an elevated position directly north). The display of wealth in the large size of these structures seems to be linked to the hilltop enclosure and the point of control.Footnote 91 As the first ‘villa’-type building positively identified within the hinterland of Canterbury (see above for Blean, Swarling and Ickham/Wingham), it is likely either that a power-holding family/group, perhaps that which controlled the hilltop enclosure in the IA, was demonstrating its continued status in the Roman period, or alternatively that an individual/family/group sought to associate themselves with and/or usurp the association between this place and local power.
Evidence of enclosures and boundaries adjacent to the ridge route appears to indicate that the traveller gazed past productive fields down into the valley, where the impressive structures lay. This theatre communicating status, wealth and productivity was directed towards those travelling along the road.Footnote 92 Indeed, recent analysis has demonstrated that proximity to roads is an important factor in villa positioning, perhaps more significant than proximity to towns.Footnote 93 The concern with such display to the road-users can be compared with the siting of the Roman barrows at Bartlow, Cambs., where the GIS and viewshed analysis indicates that they were not located to impress travellers on the main Roman roads but rather ‘the mounds appear to have been designed to be viewed from the surrounding valleys and fields, and from a minor road thought to run past them. The location of the mounds may thus have been chosen to communicate power and status to the inhabitants of the local villa estate, as well as selected neighbouring villas’.Footnote 94 In Bourne Park, the impressive Roman-period stone-founded structures in the valley seem to be communicating with those on the main Roman road, though, as we shall see, the landscape of burial and belief, as at Bartlow, may have been differently oriented.
EXPRESSIONS OF BELIEF
The physical and visual connections between paths of movement, lines of sight and significant ritual places within this landscape — the possible IA funerary enclosure, the putative temples, barrows and other burials, and possibly the natural springs — indicate that the construction of belief may have been central to the organisation of community identity. The communal nature of ritual activities held at temples and burial sites was supported by the existence of a major trackway (likely predating the temples) and two paths. Guiding the movement of people and reinforcing symbolic connections through juxtaposition, alignment and intervisibility was not limited to places of ritual or communal activity, of course, but these structures for experiencing the landscape were nonetheless significant for such activities.
Formal burial — both inhumation and cremation — is characteristic of the LPRIA in Kent. Rectilinear enclosures were used to bound cemeteries across north-west Europe, both in the IA and the Roman period, creating a symbolic boundary between the living and the dead and a monumentalised space for the enacting of mortuary rituals.Footnote 95 While the creation of the Roman-period road appears to have attracted a greater number of Roman-period and early medieval burials between Dover and Canterbury, a LPRIA cremation containing a La Tène type brooch interred in a Roman helmet also found alongside the Dover–Canterbury ridge route, north of the Nailbourne (fig. 2), indicates that this ridge was used for burial in the LPRIA.Footnote 96 If the rectilinear enclosure to the south of the Nailbourne hilltop enclosure in Bourne Park is a mortuary enclosure, the large size could reflect the status of individuals buried there or a large number of interments. LPRIA cemeteries containing a large number of cremation burials are often associated with focal sites (e.g. King Harry Lane, St Albans, and Westhampnett, near Chichester)Footnote 97 and the Nailbourne hilltop enclosure, not just the ridge route, may have acted as the focal point here. This may even be the case if the putative hillfort had already been abandoned: LPRIA cemeteries are known in rural locations where the population making use of them must have travelled specifically for the purpose of interring their dead (e.g. the nearby Swarling urnfield cemetery and Westhampnett), perhaps continuing earlier customs.
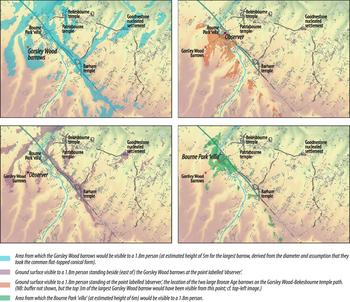
The Roman-period burial mounds in Gorsley Wood were apparently linked to the high-status structures in Bourne Park and tied into a wider landscape of belief, ritual and group identity by way of a clear (if intermittently identified) linear feature, possibly a ditch or pathway (fig. 3). Mourners attending a funerary ritual, or revisiting the barrow mounds, at the Gorsley Wood barrows would have had a view across the valley to the ridge route and former hilltop enclosure and far beyond, to the Bekesbourne and Barham temples, and the Goodnestone nucleated settlement, while the valley itself would have been obscured (fig. 8). The physical connection created by the pathway between the valley-bottom enclosures and the burial mounds links the bounded spaces of the living and the places memorialising the dead. Moving along the path into the valley, the Roman barrows pass out of view until a person reaches the location of the large Bronze Age barrows on the opposite side of the valley, about half-way up the slope — perhaps a good stopping point along a steep walk. From these barrows, which were placed on a gentle slope within a depression, the view is restricted to the Nailbourne valley towards the south and west back towards the spring, the structural complex and (possibly, tree-permitting) the tops of the barrows in Gorsley Wood (fig. 8). By placing the path on the downslope side of the barrow mounds, the view is obscured by the ridge to the north, east and south-east, accentuating the significance of the valley features and the visual impact of the Bronze Age barrows rising above the viewer. In creating the path on this line and constructing the Gorsley Wood barrows just beyond the shoulder of the hill, a special place was created at the Bronze Age barrows for both physically and symbolically connecting the deep past of the huge, eroded mounds with the Roman barrows. This path facilitates the procession and ritual activities associated with funerary rites, springsFootnote 98 and temples, but it also draws people across the landscape, in a way perpendicular to the easier route of the road connecting the towns, and encourages connections among a community in their enacting of memory and belief.Footnote 99
Visibility analyses of the same area as fig. 2 (see fig. 2 for key, labels and scale). Visible areas are approximate as modern features and the 5 m pixels (using OS Terrain 5) limit precision. (Lacey Wallace and Chris Blair-Myers with background DEM data; Crown copyright/database right 2017, an Ordnance Survey/EDINA supplied service)

Although such a reconstruction of funerary/ritual-associated movement in the landscape cannot be proven, comparanda suggest it is not an unreasonable interpretation of the archaeological record. Ample iconographic and literary evidence demonstrates the importance of processions in Roman funeral/ritual praxis (which may have involved repeated visits to burials) and for Roman Britain these have often been reconstructed for urban to extramural contexts.Footnote 100 There is no reason to think that the same practices did not also occur in rural landscapes between non-urban features, especially considering the fact that processional activity across landscapes in prehistoric funerary/ritual contexts has been widely accepted.Footnote 101 Certainly it is the case that some Bronze Age barrows in this area were levelled or damaged in the IA (e.g. Site 9, Barrow 1 on the Bridge by-pass which was cut through by an IA ditch),Footnote 102 but several were clearly visible into the Roman period (e.g. the barrow at TR 2310 4848, which the Roman road clearly deviates to respect, figs 2 and 4). These large barrows, visible from the valleys as well as the higher ground, were prominent in the landscape and would have been familiar to people from the Continent as burial markers (e.g. the Flanders monuments).Footnote 103 The community or family identities associated with these monuments are unlikely to have been maintained over hundreds of years, but they may have served to construct and reinforce local group identity and the sense of connection between people and the land.Footnote 104 Perhaps even as minor, eroded features, their significance persisted and the barrows were likely one part of a long-term ceremonial use of the landscape here, as, perhaps, at Monkton.Footnote 105
The use of the earlier Bronze Age monuments within a broader Roman-period landscape of belief and memory perhaps served to lay claim to an expanse of land beyond the Nailbourne valley itself and to root that claim within the deep past and ancestral ownership. The use of (albeit much smaller) barrows in Gorsley Wood in the Roman period may also have created the illusion of continuity and connection over time. This link between the temples, springs and barrows could be seen as a symbolic marriage of belief, ancestors, spirits and the land.Footnote 106 Such connection of significant places was a central method of inscribing identity onto the landscape and communicating a symbolically-charged relationship between people and place.
CONNECTED LANDSCAPES AND SOCIAL GROUPINGS
In the environs of Canterbury, a large landscape area seems to have been connected by both the Nailbourne stream/Elham valley and the major trackway east of the Dover–Canterbury ridge route between the Nailbourne crossing and the Dour. These connections across the landscape may represent the symbolic and physical links of a cohesive social group. Laying claim to an important water source as well as a significant trade and communication route appears to have been undertaken through the creation of a large hilltop enclosure at the ridge route–stream intersection sometime in the IA. Territory connected by routeways and stream valleys, rather than that surrounding a single central place, may have been socially significant in this part of the South-East. The notion that there were perhaps several separate social groups within east Kent is supported by the positions of several possible major IA hillforts/enclosed oppida in the area, including the Nailbourne hilltop enclosure, Bigbury and Homestall Wood (fig. 1). If there were multiple social groups, then the creation of a single civitas capital would have required significant negotiation and co-operation, hence perhaps the choice of a ritual centre at Canterbury which may have already been serving to unite various groups.
Millett has already raised the possibility that social groups in Kent were organised by river valleys, rather than blocks of territory surrounding hillforts and/or oppida.Footnote 107 It may be that the Nailbourne/Elham valley was a (western) linking feature within our landscape area, while the major trackway united the people east of the ridge route (fig. 2). This trackway may have served to ‘include’ land beyond the valley within the territory of the same social group and to divide it from areas associated with the Wingham river valley. The three large, probably Middle–LPRIA enclosures, only about 1–2 km distant one from the next, appear to be linked to the trackway and perhaps represent communal settlement/activity centres within the Nailbourne valley territory and/or a boundary between this group and the approaches up the valleys from the Wantsum Channel to the north.
Probably sometime late in the LPRIA, perhaps after the large Nailbourne hilltop enclosure was abandoned or in its final phases, the location was possibly marked as significant by the construction of what may be a funerary enclosure on the steep hillside beside the routeway. If this enclosure was funerary, its size presumably indicates a communal function and/or high-status usage and it may have been associated with the leadership or group who inhabited the area. In LPRIA Kent, formal burial in cemeteries (e.g. Aylesford and Swarling) and the establishment of cultic centres (e.g. Springhead and probably Canterbury) may have become a key method of communicating group identity and bringing people together. The burial processes enacted at the possible LPRIA/early Roman funerary enclosure south of the Nailbourne hilltop enclosure in Bourne Park may have formed part of this function for the local group, whether the enclosure served as a high-status monument for a leading family or as a communal burial ground.
In Bourne Park, after the formalisation of the ridge route as a long section of the Dover–Canterbury road (probably in the second century) with ditches and metalling, the intersection of ridge route and stream retained its significance, although its meaning and symbolism may have altered with the changing socio-political situation. By the third century, a high-status structural complex, including at least two large buildings within a possibly-walled enclosure, was constructed in the valley. The high-status structural complex in Bourne Park could have been the residence of one powerful family, but the unusual form of the large western building and the proximity to the ridge route–river intersection and the two natural springs may suggest a non-domestic/communal function, a better understanding of which may be revealed by post-excavation analysis. Whatever the precise function of these structures, they clearly communicate with the road, and possibly the now-abandoned hilltop enclosure, perhaps referencing and drawing meaning from earlier and contemporaneous local power structures. The long façade was no doubt designed to attract the attention of passing traffic moving between Dover and Canterbury, both local and non-local, and may have been in some sense the ‘public’ face of the landscape created by those in control locally.
Another ‘face’ can be identified in Bourne Park, reflecting perhaps a more rural and local orientation, linked explicitly to ritual and burial practices. Within the Bourne Park area extensive high-resolution geophysical survey indicates the possibility that a corridor of movement along the stream was maintained into the Roman period and IA and Roman enclosures and field boundaries are evident in aerial photography in the Nailbourne/Elham valley as far as the sources of the stream at Lyminge. The movement of people, animals and goods along the valley may have been more closely aligned to local networks, social relationships and livestock management than that along the ridge route. As urban centres and the use of roads grew, travel between a rural settlement and a town became easier than between two rural locations unconnected by road. In order to maintain the importance of social networks outside towns, social and religious relationships had to be maintained and reinforced. Landscape links in the form of trackways, paths and other linear features appear to have been a significant means of negotiating such needs. There are at least three temples in the territory proposed here (fig. 2), two of which may have been connected across the Nailbourne valley to the Roman-period burial mounds in Gorsley Wood (fig. 3). Roman-period burials in the valley and Roman burial mounds to the west in Gorsley Wood represent a likely change in burial ritual and monumentalisation. The links made between the burial mounds and temples perhaps indicate a changing cultic practice and the increased importance of individuals and families in the landscape of belief. By creating pathways between these ritual monuments, the springs, Bronze Age barrows and Roman burials, a symbolic association appears to have been expressed in the social landscape.
The intervisibility, physical connection by pathways and proximity of Roman-period features to significant earlier places and monuments indicate that the inhabitants of the area were manipulating temporality and topography to weave constructs of memory, power and belief into the landscape.Footnote 108 The result is a construction of identity on a landscape scale visible to the merchants and urban inhabitants moving along the road as well as to the local community, more likely to be those moving along the Nailbourne valley. By creating connectivity between meaningful features, the landscape communicated in two spheres: a public face of power to the road-users and an invitation to local groups to connect across the landscape in ritual and remembrance.
For centuries there has been discussion of the social organisation of the LPRIA and Roman-period groups in Kent, from the enigmatic brief Caesarian comments to modern analysis of the discrepancies in villa distribution. Whilst, ultimately, interpretations of the partial archaeological record will always be highly subjective and constantly necessitate rethinking, we consider that much of the social commentary to date has been too generalising and has lacked detailed investigation of, in particular, the possible inscription of social identities within the landscape. We have tried to show how a combination of evidence with extensive geophysical analysis can contribute to the ongoing discussions about social groupings in the hinterland of Canterbury. Though many ambiguities remain, our interpretations can contribute to and challenge broader-brush visions of social changes in the IA and Roman periods.
ACKNOWLEDGEMENTS
The authors, Principal Investigator and Co-Investigator of the CHP respectively, are very grateful to the landowners for permission to carry out geophysical survey (2011–2017) and small-scale excavation (2016). Equipment was provided by the Universities of Cambridge, Kent, Oxford and Southampton, Kent County Council and Bartington Instruments. We are extremely grateful for funding from the Faculty of Classics and the McDonald Institute for Archaeological Research, University of Cambridge; the Roman Research Trust; All Souls College; the Administrators of the Haverfield Bequest; the Association for Roman Archaeology; Kent Archaeological Society; Canterbury Historical and Archaeological Society. Special thanks go to Paul Johnson (co-director of fieldwork) and Lieven Verdonck (GPR specialist). The fieldwork was made possible by the enthusiasm and dedication of students and volunteers, including Ashley Chhibber, Gabriella Jeakins, Michael Loy, Alex Mirošević-Sorgo, Sean O'Connor, Hanneke Salisbury and Rob Stroud. The authors thank Robert Prestige for sharing his family's documentation of Bourne Park and Roly Cobbett for his insights into local history and cartography. Thanks are also due to Ben Croxford (previously at the Kent HER) for his help and especially to our collaborator Chris Blair-Myers, whose expertise with aerial photography has been invaluable. We are indebted to Michael Loy for his research assistance and to Paul Booth, Andrew Gardner and the anonymous reviewers for their comments.