Introduction
In June 2011, the Scottish Directorate of Health Workforce and Performance produced an update1 on the 2009 Exceptional Aesthetic Referral Protocol for adults. The update aims to identify procedures that do not treat an underlying disease process. The premise is that these should not routinely be available on the National Health Service (NHS). These procedures can only be provided on an exceptional basis where there is clear evidence of benefit to the patient.2
Both the previous and updated protocols recognise that the procedures in question, although not treating a disease process, can enhance the lives of patients who fulfil certain criteria. Indeed, rhinoplasty has been shown to provide significant patient benefit, including when cosmesis is an indication.Reference McKiernan, Banfield, Kumar and Hinton3 The inclusion and exclusion criteria for rhinoplasty have changed in this latest update, including those for functional problems. This means that patients who were previously thought to benefit from this procedure may no longer be offered it within NHS Scotland. In producing these protocols, the Plastic Surgery Task and Finish Group did not include representation from the ENT specialist community.4
The apparent reasons for the introduction of this legislation are: to control the number of rhinoplasties performed in Scotland, protect NHS Scotland from the cost of these procedures, avoid any associated litigation and standardise practice across the Scottish health boards. The update to the legislation suggests that the initial protocol did not have the effect the Scottish government desired. With regard to the rest of the UK, a retrospective study that examined rates in England and Wales over the past 10 years indicated a decline in England only.Reference Stroman, McLeod, Owens and Backhouse5
This study aimed to review surgical coding data in Scotland between 2006 and 2010 in order to investigate the rate of rhinoplasty procedures and to establish the impact of Scottish government guidelines on: the number of procedures performed, variation across surgical specialties and variation by region. The impact of these earlier guidelines may illustrate the likely response to the updated protocol.
Materials and methods
Data on the number of rhinoplasty and septorhinoplasty procedures performed by region and by specialty from 2006 to 2010 were collected from the Information Services Division, NHS Scotland. All data were expressed as rates per million by regional population. This allowed comparisons corrected for the year on year increase in the Scottish population. To ascertain whether rates changed following July 2009, the mean rate for the years preceding 2009 was compared with the rate in 2010. Regional rates were calculated as cases per million and illustrated with standard errors.
Statistical comparisons were performed within Prism 5.0d for Mac OS-X (GraphPad Software, La Jolla, California, USA). All rates were compared using chi-square tests.
Results
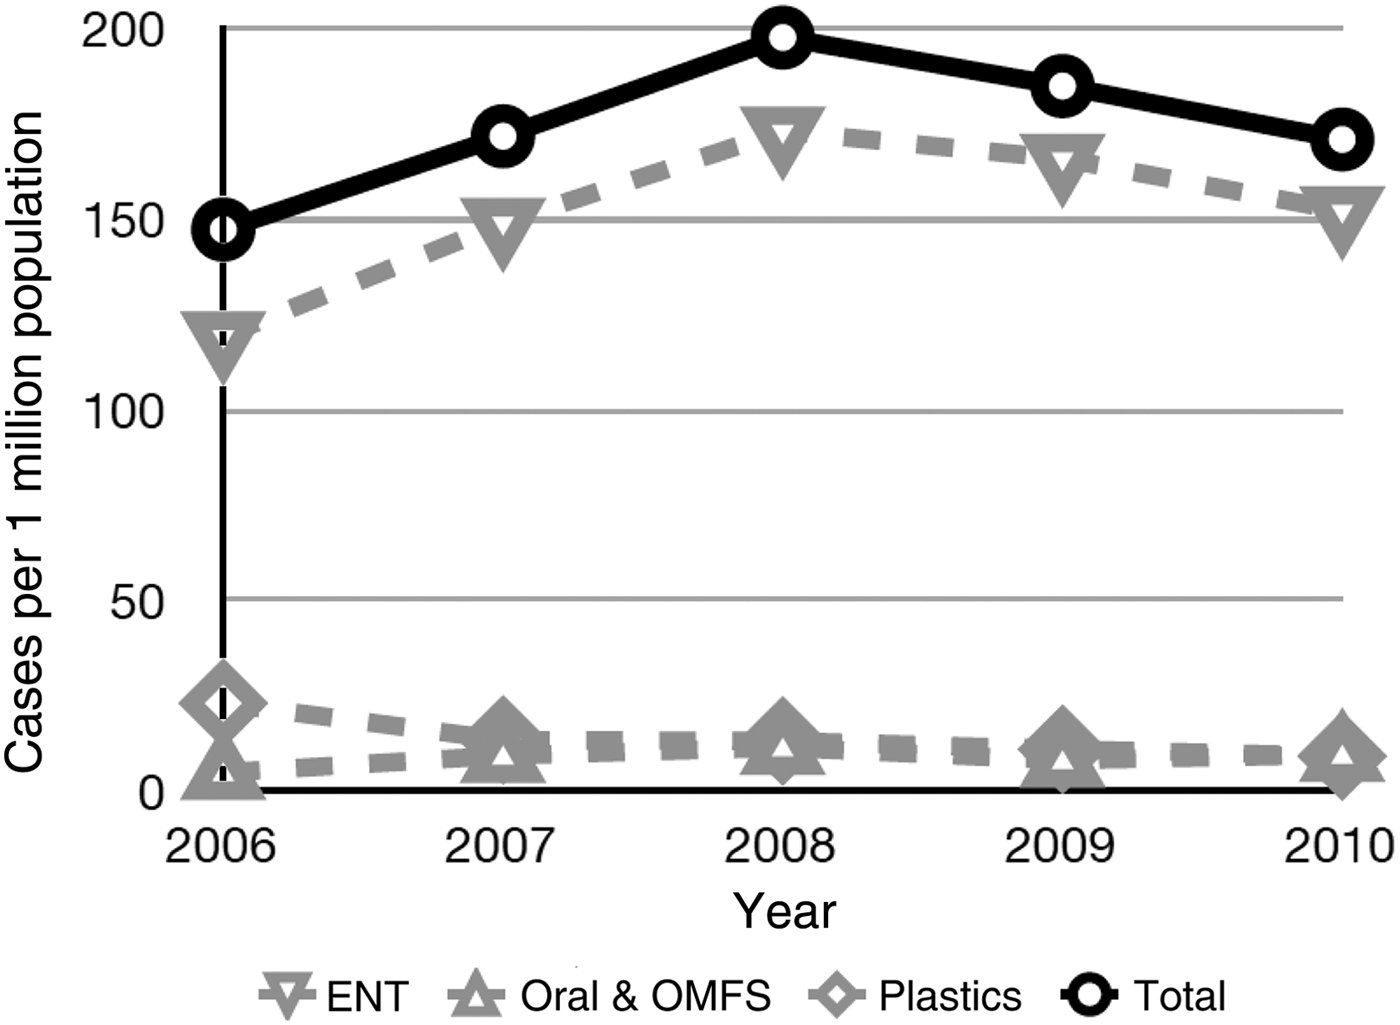
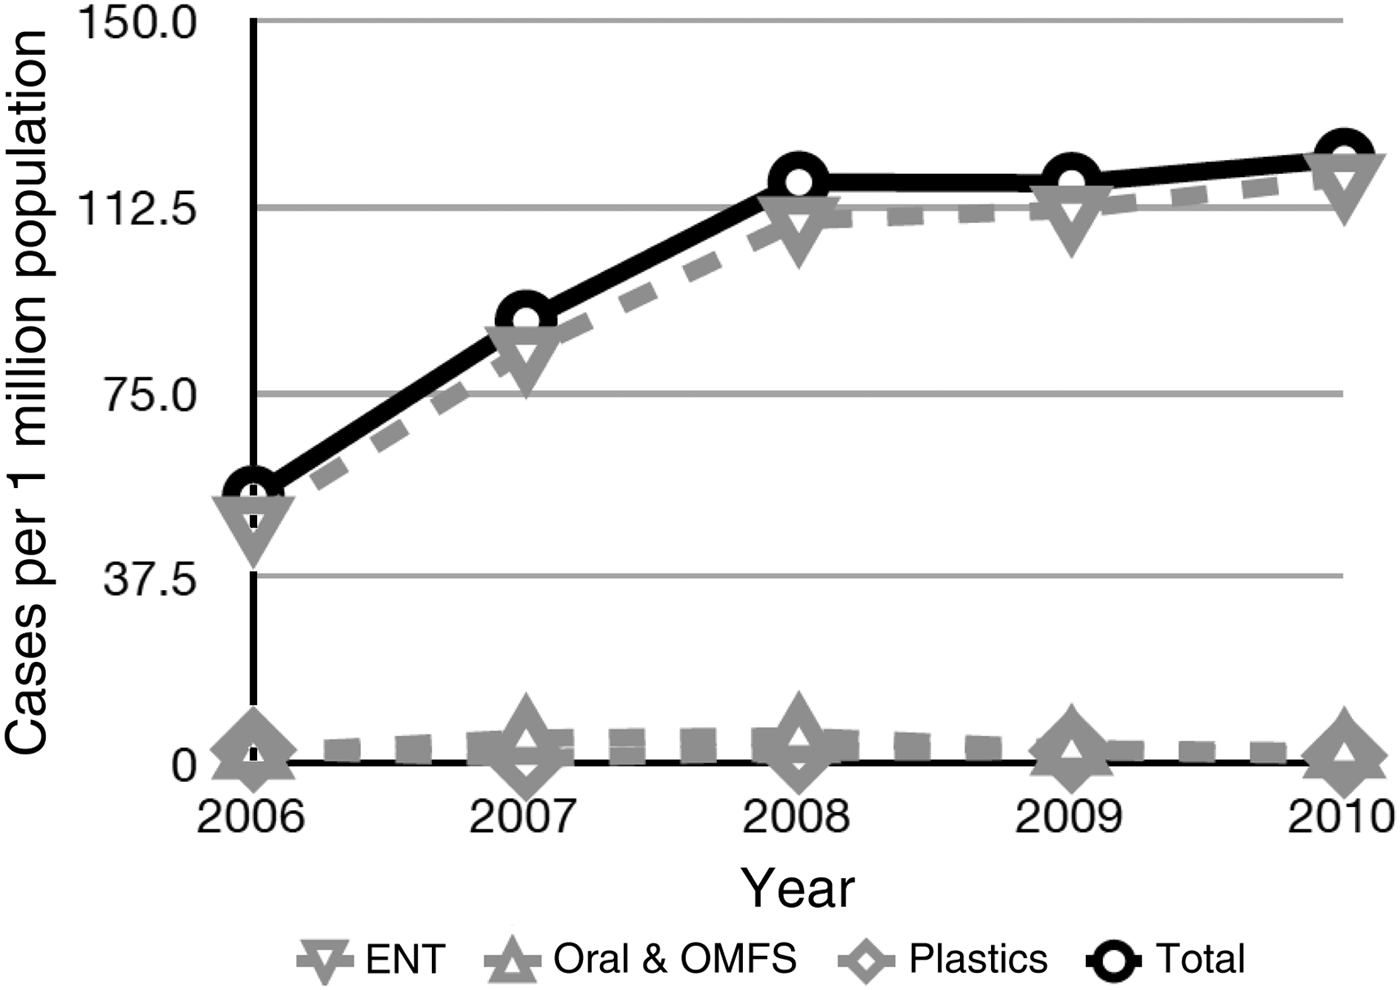
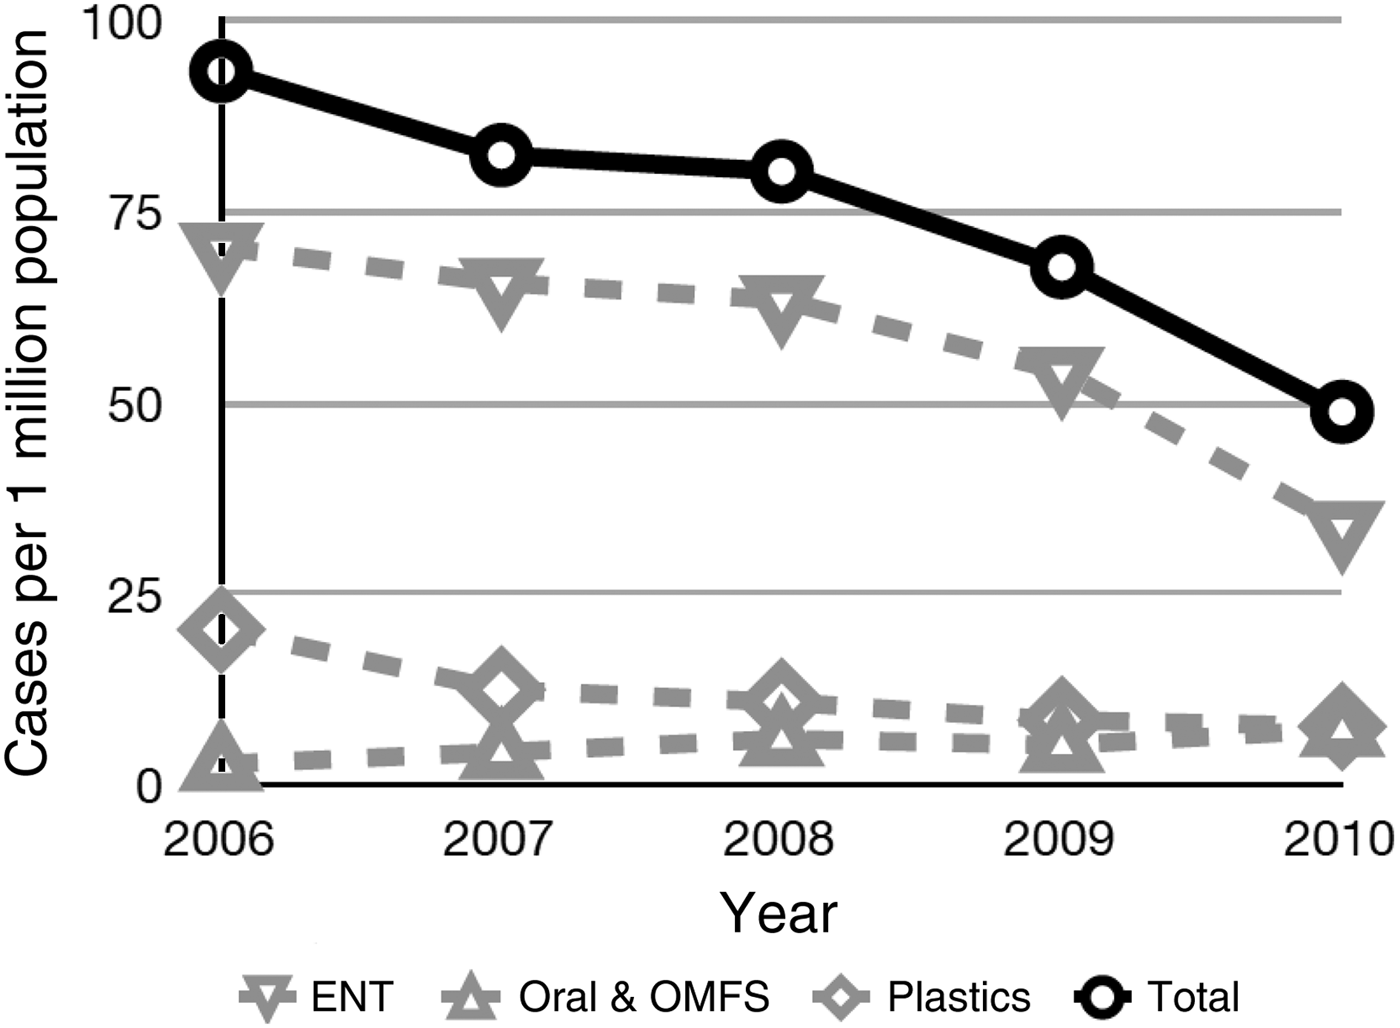
In the 5 years studied, 4514 septorhinoplasty and rhinoplasty procedures were performed. The total number of septorhinoplasty and rhinoplasty cases per year increased from 754 cases in 2006 (147 per million population) to 893 cases (171 per million) in 2010 (p = 0.001) (Figure 1 and Table I). The number of septorhinoplasties performed increased from 54 to 122 cases per million population (p < 0.0001) (Figure 2). The number of rhinoplasties performed decreased from 93 to 49 cases per million population (p < 0.0001) (Figure 3). The means for the number of procedures performed by specialty per million population were: 152 by ENT (87 per cent of procedures), 13.9 by plastic surgery (8 per cent) and 8.7 by oromaxillofacial surgery (5 per cent).
Rate of septorhinoplasty and rhinoplasty combined per million population between 2006 and 2010. OMFS = oromaxillofacial surgery

Rate of septorhinoplasty per million population between 2006 and 2010. OMFS = oral and maxillofacial surgery
Rate of rhinoplasty per million population between 2006 and 2010. OMFS = oral and maxillofacial surgery
Significance of change in total number of rhinoplasty and septorhinoplasty procedures performed between 2006 and 2010
Data represent p values (chi-square test for trend). *p < 0.05. OMFS = oral and maxillofacial surgery
The overall number of procedures performed by ENT surgeons increased by 28 per cent, from 119 cases per million population prior to 2009 to 152 in 2010 (p < 0.0001), with a 140 per cent increase in the septorhinoplasty rate, from 49 to 118 cases per million (p < 0.0001), and a 51 per cent decrease in the rhinoplasty rate, from 70 to 34 cases per million (p < 0.0001).
The overall number of procedures performed by plastic surgeons fell by 61 per cent from 23 to 9 cases per million (p < 0.0001), with no statistically significant change in the septorhinoplasty rate (p = 0.6575), but a 60 per cent decrease in the rhinoplasty rate from 20 to 8 per million (p < 0.0001).
The overall number of procedures performed by oromaxillofacial surgeons increased by 100 per cent from 5 to 10 cases per million (p = 0.0486), with no statistically significant change in the septorhinoplasty rate (p = 0.4644), but a 133 per cent increase in the rhinoplasty rate from 3 to 7 per million (p = 0.0015).
Effect of 2009 legislation
Comparison of the 2010 rates with the mean rates from 2006 to 2008 showed that following the 2009 guidance, overall rates (rhinoplasty and septorhinoplasty, all specialties combined) declined by 1 per cent (p = 0.83) (Table II).
Change in number of rhinoplasty and septorhinoplasty procedures performed after 2009 legislation
*Rhinoplasty and septorhinoplasty procedures. †Change from reference value of 100 per cent. ‡p < 0.05. OMFS = oral and maxillofacial surgery
There was a 43 per cent reduction in the overall rate of rhinoplasty (p < 0.001) due to a decline in the number of procedures performed in ENT (down by 49 per cent) and plastic surgery (47 per cent) (p < 0.001), although the smaller contribution from oromaxillofacial surgery increased by 68 per cent (p < 0.05).
Over the same period, septorhinoplasty rates increased by 40 per cent overall (p < 0.001); the number of procedures performed in ENT increased by 46 per cent (p < 0.001), while the rates for plastic surgery and oromaxillofacial surgery decreased by 24 per cent (p = 0.49) and 45 per cent (p = 0.05), respectively.
Regional variation
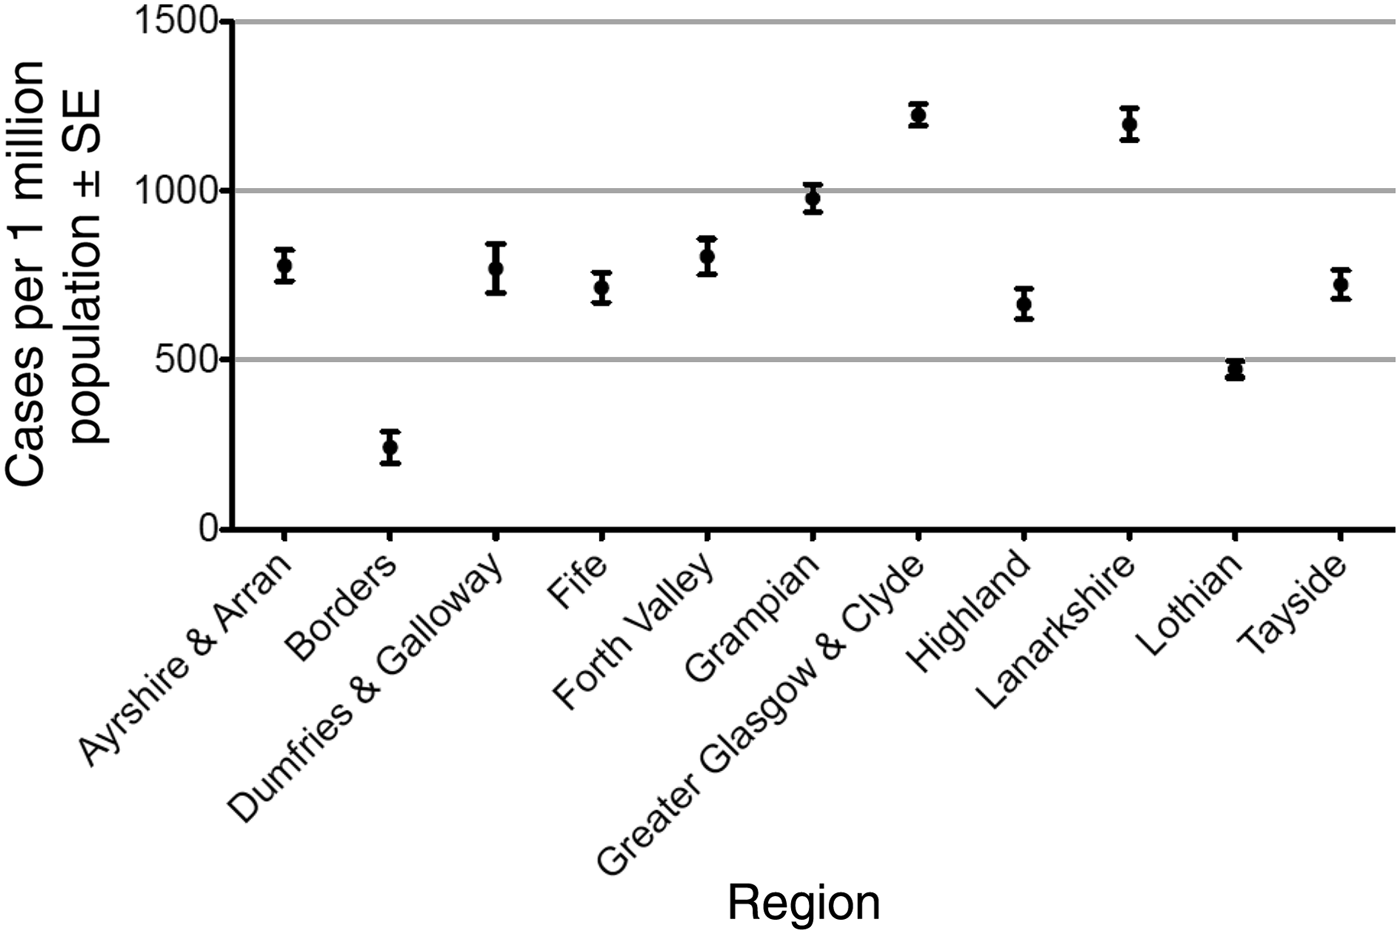
There was significant regional variation in practice (p < 0.0001). In analysing the total number of septorhinoplasty and rhinoplasty procedures performed between 2006 and 2010, the lowest 5-year incidence per million population was observed in the Borders (242, 95 per cent confidence interval (CI), 150–334) and the highest was in Greater Glasgow and Clyde (1223, 95 per cent CI, 1159–1286) (Figure 4).
Regional variations in five-year rate of septorhinoplasty and rhinoplasty procedures per million population. SE = standard error
Discussion
Analysis of surgical coding data on rhinoplasty and septorhinoplasty cases in Scotland revealed that there were significant changes in the rates of procedures for all specialties over the period 2006–2010, although the overall combined rate of rhinoplasty and septorhinoplasty after 2009 fell by only 1 per cent. After 2009, the rate of procedures performed within the ENT specialty increased slightly, suggesting that the protocol may have a greater influence on plastic surgeons than otolaryngologists. A significant regional variation in practice was demonstrated, and therefore the protocol was not successful in standardising practice across Scotland.
The reduction in the number of rhinoplasty cases may, in the long term, have an impact on ENT training in Scotland. To complete their training, trainees must undertake an absolute minimum of 10 septorhinoplasties as the principal surgeon,6 while those training to be specialist rhinologists should do considerably more. With the reduction in trainee hours as a result of the European Working Time Directive, as well as the aim to reduce the number of procedures undertaken within NHS Scotland, trainees will find fewer opportunities to learn this skill. Pothier et al. identified that there has already been a reduction in the number of procedures available to ENT trainees in other parts of the UK.Reference Pothier, Toll, Grant and Giddings7 Another potential effect is a reduction in manpower provision within otolaryngology, especially in the subspecialty of rhinology. This would likely impact on training breadth and quality.
The declining rate of rhinoplasty alongside an increasing rate of septorhinoplasty suggests a move away from purely cosmetic procedures towards surgery for more functional reasons, for those cases that were not restricted by the 2009 legislation. It is unlikely that there has been such a rapid shift in the type of surgery required, and this apparent change may have occurred for a variety of reasons.
The study relies on the quality of the procedure coding from the Scottish hospitals. Attention has been given to improving the quality of coding, and this is now one of NHS Scotland's corporate aims. Clinicians have become more aware of this coding process, and when presented with new legislation that has the potential to restrict practice, clinicians may have improved the coding to more accurately reflect the breadth of the issues that are tackled in these cases. It could also be argued that a change in coding by clinicians has resulted from other motivating factors, namely to oblige patient demand for the procedure and surgeons' desire to maintain their skills and training.
As patients' primary advocates, general practitioners may have adjusted their referral practice to ensure patients still received the surgery that they feel is required. We would suggest that this change is justified if the patient merits surgery under the regulations. The legislation may also have increased awareness in general practice of the role of the otolaryngologist in the management of complex functional and cosmetic nasal deformity cases.
In contrast to the 2009 legislation, the updated 2011 protocol applies to ‘all procedures to alter the form and appearance of the nose’ and ‘may include procedures for nasal obstruction’. In such cases, a clinical psychology review is required before a patient can be referred for rhinoplasty or septorhinoplasty; however, the review is not required where the referral was ‘only for nasal obstruction’. This change, combined with our demonstrated reduction in rates of surgery, is likely to have a negative impact on patient satisfaction within the NHS, as we are unable to address these complex nasal issues without the sometimes considerable delay of involving a psychologist.
The impact of these changes must be balanced against cost savings in NHS Scotland. The legislation will increase the number of referrals to clinical psychologists. This will require an increase in their resources and manpower; this is an issue that may warrant further investigation and costing.
As mentioned above, there was no input from ENT specialists in the production of these protocols; the medical representatives were from a plastic surgery background. As otolaryngologists perform 87 per cent of rhinoplasty and septorhinoplasty procedures, we would suggest this lack of consultation may be a significant reason for the changes observed.
The finding that septorhinoplasty and rhinoplasty practice differs across Scottish health boards may be of use to any future ‘task and finish’ groups responsible for protocol amendment and implementation within all interested specialties.
Limitations
In this study, the data were gathered from all heath boards across Scotland. Different boards use different coding methods. It is therefore likely that there were coding variations and errors in the data acquired from the Information Services Division of NHS Scotland. In addition, patients may be referred across regions for their septorhinoplasty or rhinoplasty procedures, if the appropriate surgery is not available within their home region. This would mostly affect the comparison across boards, and was not considered to have invalidated the highly powered overall findings.
• The Scottish Government's update (2011) of the 2009 Exceptional Aesthetic Referral Protocol includes rhinoplasty
• There was no ENT specialist representation when producing the protocol
• Overall, the septorhinoplasty rate increased and the rhinoplasty rate decreased in Scotland between 2006 and 2010
• There was only a 1 per cent decrease in the overall rate of procedures after 2009
• Rhinoplasty and septorhinoplasty practice differs between health boards in Scotland
Another study limitation is that changes over time may not have been due solely to the 2009 legislation. Other factors, such as retirement or employment of rhinologists in Scotland, could have had an effect; these factors were not investigated in the study. Finally, the numbers of procedures performed within plastic surgery and oromaxillofacial surgery were comparatively small; calculations of some of the procedure rate changes are therefore lacking in power.
Conclusions
The 2009 legislation led to a reduction in the coding of purely cosmetic surgery and an increase in the functionally coded caseload. There was also a trend towards surgery within ENT and oromaxillofacial surgery, and away from plastic surgery departments. The further effect of the 2011 protocol update remains to be seen. The guidelines have necessitated more accurate coding to emphasise and record the functional caseload of all specialties performing septorhinoplasty and rhinoplasty. Any decline in procedures performed will potentially have an effect on patient care provision, satisfaction and treatment. In addition, there are potentially serious implications for otolaryngology training and workforce planning. Because of this, the data should not be viewed as a justification for immediate further changes. Through engagement with the otolaryngology specialist community, legislation should recognise the need to strike a balance between the functional and cosmetic needs of patients. Changes should not be sold as financial efficiencies by cutting the number of NHS procedures that are inappropriately simplified as ‘unnecessary cosmetic surgery’.