Bulk milk somatic cell count (BMSCC) is determined frequently for every dairy herd that delivers milk to a processing plant. In herds that do not participate in dairy herd improvement (DHI) milk testing, BMSCC is the only parameter available to monitor the udder health situation but the association between BMSCC and the prevalence of subclinical mastitis is far from perfect (Lievaart et al. Reference Lievaart, Kremer and Barkema2007b). Additionally, it has also been hypothesized that BMSCC will not reflect the udder health situation accurately because the milk from some cows may be withheld from the bulk milk owing to milk quality or food safety regulations regarding high somatic cell count (SCC) milk, antibiotic residues or contagious pathogens (Van Schaik et al. Reference Van Schaik, Lotem and Schukken2002; Olde Riekerink et al. Reference Olde Riekerink, Barkema, Veenstra, Poole, Dingwell and Keefe2006). Therefore, the average yield-corrected SCC of all animals in the herd (CHSCC) is suggested to be a better parameter for monitoring the udder health situation on farms participating in a DHI programme (Lievaart et al. Reference Lievaart, Kremer and Barkema2007b). This parameter can only be used, however, in herds that participate in a DHI programme. The proportion of dairy herds that participate in a DHI programme ranges from 2% in Poland to 90% in Denmark (International Committee for Animal Recording, 2002).
Quantifying the magnitude of the deviation between BMSCC and CHSCC would be useful information for farms that rely only on BMSCC data for their udder health management. In addition it is important to understand whether sampling variation of BMSCC could have an effect on the deviation between the BMSCC and CHSCC. Research on the sampling variation of BMSCC is limited to assessing the required agitation time to ensure that the milk composition will stay as homogeneous as possible (Goodridge et al. Reference Goodridge, Hill and Lencki2004; Sevello et al. Reference Servello, Hill and Lencki2004) or to studying annual variations (Berry et al. Reference Berry, O'Brien, O'Callaghan, Sullivan and Meaney2006; Green et al. Reference Green, Bradley, Newton and Browne2006; Lievaart et al. Reference Lievaart, Barkema, Kremer, van den Broek, Verheijden and Heesterbeek2007a; Olde Riekerink et al. Reference Olde Riekerink, Barkema and Stryhn2007a). The amount of sampling variation itself is unclear and not described before, as is the association between a deviation between BMSCC and CHSCC and management practices of the farm.
The objectives of this study were therefore to determine: 1) the sampling variation of BMSCC, 2) the remaining difference between BMSCC and CHSCC as an indicator for the udder health situation of dairy farms, and 3) management factors associated with the magnitude of this remaining difference.
Materials and Methods
Data collection
Data for this study were collected on two groups of farms. One group of 53 farms was used to determine the sampling variation of BMSCC and another group of 300 farms to quantity the difference between BMSCC and CHSCC. The second group of 300 farms was also used to study the management factors associated with this difference (Barkema et al. Reference Barkema, Schukken, Lam, Beiboer, Wilmink, Benedictus and Brand1998a, Reference Barkema, Schukken, Lam, Beiboer, Benedictus and Brandb).
To guarantee that the sampling variation was determined for a sufficient range of BMSCC, the 53 farms were equally stratified into three classes of average BMSCC based on the data of the two preceding years. The classes were a low (⩽150 000), medium (151 000–250 000) and a high (>250 000 cells/ml) BMSCC class and corresponded to the study of Barkema et al. (Reference Barkema, Schukken, Lam, Beiboer, Wilmink, Benedictus and Brand1998a, Reference Barkema, Schukken, Lam, Beiboer, Benedictus and Brandb). To determine the sampling variation of a BMSCC sample on each of the 53 farms, five samples were collected consecutively from the same bulk tank. The samples were collected during a routine milk collection every 2 or 3 d and conformed to a standard protocol, which instructed sample collectors to let the bulk tank stir for at least 5 min before sample collection and check that the temperature was below 4°C. All samples were analysed on the same Fossomatic machine (Fossomatic™ FC).
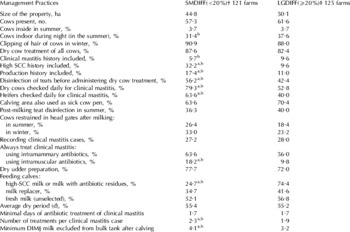
The second group of 300 farms housed lactating cows in a free-stall barn during the winter, participated in a 3-weekly or 4-weekly milk recording system, had annual production quota between 300 000 and 900 000 kg, and had cows of the Holstein-Friesian or Dutch Friesian breeds. Three questionnaires were conducted to collect information on mastitis prevention and control management practices (Barkema et al. Reference Barkema, Schukken, Lam, Beiboer, Wilmink, Benedictus and Brand1998a, Reference Barkema, Schukken, Lam, Beiboer, Benedictus and Brandb). The Dutch Breeding Organization (NRS, Arnhem, The Netherlands) provided the monthly test-day SCC and BMSCC data per farm for a period of 3 consecutive years. A previous study found that the interval between sampling of BMSCC and test-day SCC did not influence the association between BMSCC and individual SCC if BMSCC and test-day SCC were sampled within 2 d of each other (Lievaart et al. Reference Lievaart, Kremer and Barkema2007b). Therefore, only data points of farms were included when BMSCC and individual test-day SCC data were determined within 2 d of each other. Additionally, only farms that had at least three data points available were included. In total 246 out of the 300 herds fitted both criteria. To determine associated management practices, only those variables known from a previous study to influence CHSCC (Lievaart et al. Reference Lievaart, Barkema, Kremer, van den Broek, Verheijden and Heesterbeek2007a) were selected from the questionnaires (Table 1).
Descriptive results of management practices per category of difference between bulk milk SCC (BMSCC) and average herd SCC (CHSCC)

† Farms with an average difference between BMSCC and CHSCC <20%
‡ Farms with an average difference between BMSCC and CHSCC ⩾20%
§ DIM=days in milk
a Different (P<0·05) from LGDIFF herds
b Different (P<0·25) from LGDIFF herds
Date handling and statistical analyses
The five bulk tank SCC samples from each of the 53 farms were used to calculate the average absolute sampling variation and the coefficient of variation (CV) as a normalized measure of dispersion. A linear regression model was used to examine whether the average absolute sampling variation or CV were associated with the level of BMSCC. The absolute variation or CV was set as a continuous dependent variable and BMSCC as a continuous independent variable. Statistical analyses were performed using R (http://www.r-project.org/version 2.2.0; last assessed March 2009) and EXCEL (Microsoft, 2002). The R 2 was used to describe the proportion of variation that was explained by the model.
The regression equation of the average absolute sampling variation was used to calculate the sampling variation for each individual BMSCC value of the remaining 246 farms. Thereafter, the absolute sampling variation was subtracted from the difference between BMSCC and CHSCC before the difference was assessed. CHSCC was calculated by multiplying the test-day SCC by the test-day milk yield for each cow and averaging this figure over the total kg of milk produced by the herd on that test-day. For each farm an average difference between BMSCC and CHSCC was calculated from the available data points. The difference was calculated as an absolute and percentage difference value with BMSCC as the baseline; and again a linear regression model was used to determine a possible relationship between the differences, absolute and percentage, and the level of BMSCC.
To determine whether management practices were associated with a small or a large difference between BMSCC and CHSCC all farms were divided into two categories: 1) farms with <20% difference (hereafter called SMDIFF category), and 2) farms with ⩾20% difference (hereafter called LGDIFF category). The 20% cut-off value was based on the mean percentage differences of all farms within the study. The SMDIFF category consisted of 121 farms, while 125 farms fitted the LGDIFF category. Descriptive results of differences in management practices between the SMDIFF and LGDIFF were assessed using an ANOVA for continuous variables and a Chi-square test on contingency tables for categorical variables. The analysis of the association between management practices and category of difference between BMSCC and CHSCC was performed using two steps. In the first step, variables were screened using an ANOVA for continuous variables and Chi-square test on contingency tables for categorical variables (Table 1). All variables with a P value of <0·25 were considered relevant. In the second step of the analysis, a backwards stepwise elimination procedure of variables was carried out using a logistic regression model in R (http://www.r-project.org/version 2.2.0; last assessed March 2009). Farm was included as a random variable. The Akaike Information Criterion (AIC) was used to select the best fitting logistic regression model (Akaike, Reference Akaike1973). This selection criterion was defined as follows: AIC=−2(log-likelihood)+2k, where k is the number of explanatory variables (+ intercept) included in the model. AIC values were then used to compare a series of models, and the model with the lowest AIC was considered to be the best logistic regression model (Akaike, Reference Akaike1973). To determine the possible confounding effect of the level of BMSCC on the association between the relevant management practices and the outcome variable, the regression model was also run including BMSCC as an independent variable. Before including BMSCC in the model, a BMSCC was transformed on a natural log scale to achieve a normal distribution of the data.
Results
Sampling variation of BMSCC
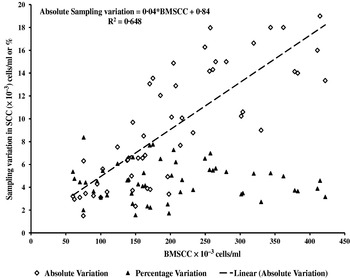
The average absolute variation of BMSCC among the five BMSCC samples ranged from 1800 to 19 800 cells/ml for 53 farms with a BMSCC ranging from 56 000 to 441 000 cells/ml (Fig. 1). The average absolute sampling variation increased with an increasing BMSCC (P=0·03), according to the equation: Absolute sampling variation=0·041*BMSCC+0·835 (Fig. 1). This equation explained 64·8% of the variation. CV ranged from 1·5 to 8·4% with an average of 4·6% (Fig. 1). No association was found between the CV and BMSCC (P=0·41).
Correlation between bulk milk SCC (BMSCC) and average absolute or coefficient of variance (CV) sampling variation on different levels BMSCC.

Difference between BMSCC and CHSCC
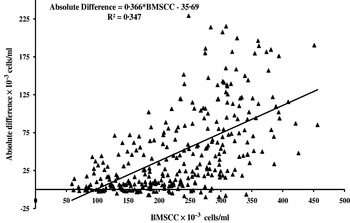
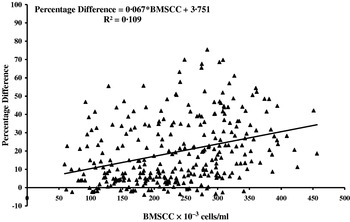
Of the 246 farms that met the selection criteria, the median number of lactating cows per farm was 56 (range 31 to 116). Average BMSCC was 241 000 cells/ml (range 68 000 to 465 000 cells/ml) while average CHSCC was 296 000 cells/ml (range 71 000 to 593 000 cells/ml). Mean absolute difference between BMSCC and CHSCC was 49 000 cells/ml (range −10 000 to 182 000 cells/ml). Median percentage difference between BMSCC and CHSCC was 19·8% (range −4·0 to 78·3%). Farms in the SMDIFF category (<20% difference between BMSCC and CHSCC) had an average BMSCC, CHSCC and percentage difference between the two parameters of 205 000, 228 000 cells/ml and 7·2%, respectively. Farms in the LGDIFF category (⩾20% difference between BMSCC and CHSCC) had an average BMSCC, CHSCC and percentage difference between the two parameters of 232 000, 371 000 cells/ml and 37·2%, respectively. As a result, both absolute and percentage differences between BMSCC and CHSCC had a positive significant association with the level of BMSCC. The absolute difference between BMSCC and CHSCC was best described by the following equation: Absolute difference=0·366*BMSCC −35·69 (Fig. 2). The model explained 34·7% of the variation. The percentage difference between BMSCC and CHSCC had also a linear relationship: percentage difference=0·067*BMSCC+3·75 (Fig. 3). The model explained 10·9% of the variation.
Correlation between bulk milk SCC (BMSCC) and absolute difference between BMSCC and average yield corrected test-day SCC (CHSCC).

Correlation between bulk milk SCC (BMSCC) and percentage difference between BMSCC and average yield corrected test-day SCC (CHSCC).

Management practices
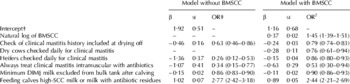
In the first step of the analysis, 11 variables were associated (P<0·25) with the categories of difference between BMSCC and CHSCC (Table 1). The final logistic regression model is presented in Table 2, without BMSCC as an independent variable, in order to identify significant variables associated with a large difference. Farms that fed calves high-SCC milk or milk with antibiotics had a 2·7-times higher chance of having a difference ⩾20% between BMSCC and CHSCC when the BMSCC values were not included in the regression model (Table 2). Checking heifers daily for mastitis, checking the mastitis history when cows are dried off, an increasing number of days before milk is included into the bulk tank after calving and always using intramuscular antibiotics for the treatment of mastitis all decreased the likelihood for difference ⩾20% between BMSCC and CHSCC (Table 2). After including the BMSCC values, the odds ratio of the variable ‘feeding calves high-SCC milk or milk with antibiotics’ for having a difference ⩾20% decreased to 2·4. Other management practices were all still significant, but their odds ratios also decreased. When including the BMSCC data the variable ‘dry cows checked daily for clinical mastitis’ became significant compared with the previous regression model without the BMSCC data (Table 2).
Final LME logistic regression model for category of difference between bulk milk SCC (BMSCC) and average herd SCC (CHSCC)

† Intercept for having large ⩾20% difference between BMSCC and CHSCC
‡ Odds Ratio for having a large ⩾20% difference between BMSCC and CHSCC
§ DIM=days in milk
Discussion
BMSCC was on average 49 000 cells/ml lower than CHSCC with a maximum of 182 000 cells/ml. Identifying such a difference was not unexpected as milk is commonly withheld from the bulk tank owing to food safety and milk quality regulations. However, the magnitude of the average difference, after the sampling variation was subtracted, of almost 20% was unexpected. The main reasons for withholding milk from the bulk tank are to avoid penalties for high-SCC milk or antibiotic residues (Van Schaik et al. Reference Van Schaik, Lotem and Schukken2002; Olde Riekerink et al. Reference Olde Riekerink, Barkema, Veenstra, Poole, Dingwell and Keefe2006). The majority of cows withheld from the bulk tank will probably be ‘known’ subclinical mastitis (high-SCC) cows. The prevalence of these cows varies from 0 to almost 40% within a Dutch dairy herd (Lievaart et al. Reference Lievaart, Barkema, Kremer, van den Broek, Verheijden and Heesterbeek2007a). From the questionnaire used for this study many farmers confirmed that they excluded cows from the bulk tank, but it is likely that this does not apply for the monthly individual herd testing. Besides testing for the fat, protein content and kg of milk, detection of high-SCC cows is one of the main reasons for conducting individual testing. In fact, without this knowledge about cows with subclinical mastitis farmers could not feed the milk of these cows to their calves, which is a common practice on farms with a difference of over 20% between the two parameters. Cows with clinical mastitis are likely to be withheld from both the BMSCC and individual SCC recording and will therefore not influence the difference between the two parameters.
Farmers who fed their calves milk with a high SCC or antibiotic residues were 2.4-times more likely to belong to the category of farms that have more than a 20% difference between BMSCC and CSHCC. This is confirmed by the descriptive results: 74·4% of farmers with a difference over 20% used this practice. Assessment of the herd-level subclinical situation will clearly be difficult in herds using this practice if no individual SCC data are available.
As this study is the first one to compare the two parameters, BMSCC and CHSCC, no comparative data were available from other countries about the difference between these two parameters or numbers of cows withheld from the bulk tank. However, most developed dairy countries have a regulatory BMSCC cut-off of 500 000 cells/ml or lower, and the number of regions using a BMSCC bonus programme is increasing. Therefore, it can be expected that farmers in these countries will exclude cows from the bulk tank to comply with these regulations and programmes.
Inclusion of BMSCC in the final logistic regression model decreased the coefficient of most variables, but did not result in elimination of variables from the model. Therefore, although the level of BMSCC confounds the association between the variables included and the difference between BMSCC and CHSCC, it does not completely explain this association. The coefficient of the more intuitive explanatory variables such as minimum days in milk after calving milk was excluded from the bulk tank and feeding calves high-SCC milk or milk with antibiotic residues changed less when including BMSCC in the model.
There are several other factors that could influence the level of BMSCC and CHSCC that is measured, indirectly influencing a difference between BMSCC and CHSCC. The first one is the variation in the measurement of BMSCC. Factors that could produce a variation are: 1) between sample variation; 2) measurement variation of the instrument determining the BMSCC; and 3) conditions of shipping the samples. In this study we have determined the between sample variation. The observed between sample variation will of course have been influenced by the measurement variation of the instrument. Although this variation fluctuates per level of the SCC it is still significantly smaller than the total sampling CV of the BMSCC data (Fossomatic™FC). This total sampling CV takes both the between sampling and the instrument variation into account. For example, the CV specification of the used instrument is 2·5% at 300 000 cells/ml (Fossomatic™FC; IDF, 1999) and cannot explain the average CV of 4·6% in the BMSCC samples. Bulk milk samples collected in the first group of farms were shipped under ideal circumstances. Although regulated, it is not known how the samples for test-day SCC and BMSCC, in the group of 246 farms were handled. This could be another source of variation. BMSCC was, however, lower than CHSCC in the vast majority of the herds. ‘Abuse’ such as freezing and thawing samples twice had little impact on determination of SCC by Fossomatic (Barkema et al. Reference Barkema, van der Schans, Schukken, de Gee, Lam and Benedictus1997). It seems therefore unlikely that treatment of bulk milk samples consistently would decrease the measurement of BMSCC to the extent found in this study. A possible limitation of this study is the use of two different datasets to quantify the sampling variation of the BMSCC and the difference between the two parameters. Ideally, both would be done at the same time on the same groups of farms but the data on management practices and SCC data of 246 farms were already collected. However, as stated before, the sampling variation did not make a major contribution to the total difference between the two parameters BMSCC and CHSCC.
The outcome of this study itself provides useful information for farmers and their advisors when BMSCC data are the only available data on which assess udder health on a herd level. The information is also useful when individual DHI data are available but not used because of the low frequency of measurements compared with the BMSCC data. The most important conclusion from this study is that in most herds BMSCC will underestimate the average herd SCC and subclinical mastitis prevalence and subsequently affect decisions in udder health management. The effect of a significant underestimation of the average herd SCC by means of the BMSCC possibly will delay or put off necessary management decisions. Therefore, farmers who feed calves high-SCC milk should be aware of an underestimation of the BMSCC and probably should add at least 20% to their herd's BMSCC when this parameter is used as a management tool to monitor the average herd SCC or subclinical mastitis. However, even then it will not be possible to use BMSCC reliably to estimate the subclinical situation. Udder health advisors should therefore stimulate farmers to determine individual cow SCC particularly when the farm participates in a DHI program.
Conclusions
Withholding cows from the bulk tank was, for various reasons, a frequently used management practice to prevent penalties for high BMSCC or antibiotic residues in the bulk milk. This resulted, on average, in a difference of 49 000 cells/ml or 19·8% between BMSCC and CHSCC after the sampling variation of the BMSCC was subtracted from the difference. Because the difference was strongly associated with the BMSCC level, farms at a higher level should reconsider using the BMSCC as an udder health management tool. If BMSCC is the only available parameter on herd level and cows are withheld from the bulk tank, the value of the BMSCC should be increased by at least 20% to estimate CHSCC.
The authors would like to thank the Dutch Breeding Organization for providing the milk production recording data used in this study and Friesland Dairy Foods for sampling the bulk tanks.