


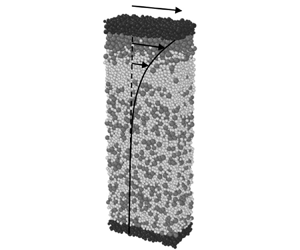



1. Introduction
When a granular medium is non-monodisperse, i.e. consisting of a mixture of particles of disparate size, grains tend to demix based on size during flow – a process referred to as size segregation. Predicting the dynamics of size segregation during flow is crucial in the design of various industrial processes where mixing is key and in understanding natural hazards, such as avalanches and landslides. The complex, spatially inhomogeneous distributions in particle size that can arise during the segregation process (e.g. Savage & Lun Reference Savage and Lun1988; Gray & Hutter Reference Gray and Hutter1997; Hill & Fan Reference Hill and Fan2008; Golick & Daniels Reference Golick and Daniels2009; Wiederseiner et al. Reference Wiederseiner, Andreini, Épely-Chauvin, Moser, Monnereau, Gray and Ancey2011; Schlick et al. Reference Schlick, Fan, Isner, Umbanhowar, Ottino and Lueptow2015; van der Vaart et al. Reference van der Vaart, Gajjar, Epely-Chauvin, Andreini, Gray and Ancey2015) pose a substantial challenge for modelling efforts, and significant effort over the last few decades has gone into developing continuum models for the evolution of particle-size distribution in a number of flow geometries (e.g. see the recent reviews of Gray Reference Gray2018; Umbanhowar, Lueptow & Ottino Reference Umbanhowar, Lueptow and Ottino2019).
Here, we highlight two specific challenges for dense, granular media that motivate the present work. First, as per current understanding, there are two important driving forces for size segregation in dense granular flows: (1) pressure gradients, typically arising due to gravity; and (2) shear-strain-rate gradients. In the presence of pressure gradients, the mechanisms of kinetic sieving and squeeze expulsion (Savage & Lun Reference Savage and Lun1988; Gray Reference Gray2018) result in a net flux of small particles to high-pressure regions and large particles to low-pressure regions, such as near a free surface. Pressure-gradient-driven segregation is widely recognized as a dominant driving force and is the focus of most size-segregation models in the literature (e.g. Gray & Thornton Reference Gray and Thornton2005; Gray & Chugunov Reference Gray and Chugunov2006; Gray & Ancey Reference Gray and Ancey2011; Marks, Rognon & Einav Reference Marks, Rognon and Einav2012; Fan et al. Reference Fan, Schlick, Umbanhowar, Ottino and Lueptow2014; Gajjar & Gray Reference Gajjar and Gray2014; Schlick et al. Reference Schlick, Fan, Isner, Umbanhowar, Ottino and Lueptow2015; Jones et al. Reference Jones, Isner, Xiao, Ottino, Umbanhowar and Lueptow2018; Liu, Gonzalez & Wassgren Reference Liu, Gonzalez and Wassgren2019; Barker et al. Reference Barker, Rauter, Maguire, Johnson and Gray2021; Duan et al. Reference Duan, Umbanhowar, Ottino and Lueptow2021; Trewhela, Ancey & Gray Reference Trewhela, Ancey and Gray2021). Apart from pressure gradients, gradients in shear-strain rate can also drive size segregation in dense flows, in which large particles segregate towards more rapidly shearing regions (Hill & Fan Reference Hill and Fan2008; Fan & Hill Reference Fan and Hill2010, Reference Fan and Hill2011a), and comparatively fewer continuum modelling works have been dedicated to capturing this driving force (Fan & Hill Reference Fan and Hill2011b; Hill & Tan Reference Hill and Tan2014; Liu, Singh & Henann Reference Liu, Singh and Henann2023). While it is reasonable to expect segregation phenomenology in shallow free-surface flows to be predominantly driven by pressure gradients, the comparative contributions of the two driving forces is not always clear (Staron & Phillips Reference Staron and Phillips2015), necessitating a model that accounts for both. The recent work of Jing et al. (Reference Jing, Ottino, Lueptow and Umbanhowar2021) developed a scaling law for the segregation force on a single intruder in a flowing dense granular medium that accounts for both mechanisms and tested the scaling law across different cases of pressure gradients and flow kinematics, but it remains to develop and test a continuum model that involves both mechanisms at finite particle concentrations across flow conditions.
The second challenge is coupling segregation modelling with rheology. The vast majority of the aforementioned segregation models do not involve rheological constitutive equations capable of predicting flow fields across different geometries. Instead, a certain flow field is assumed or measured from experiments or discrete element method (DEM) simulations and then prescribed as input to the segregation model. This is because modelling the rheological behaviour of dense granular materials across flow geometries is a substantial challenge itself. The inertial, or  $\mu (I)$, rheology (MiDi Reference MiDi2004; da Cruz et al. Reference da Cruz, Emam, Prochnow, Roux and Chevoir2005; Jop, Forterre & Pouliquen Reference Jop, Forterre and Pouliquen2005; Srivastava et al. Reference Srivastava, Silbert, Grest and Lechman2021), where
 $\mu$ is the stress ratio and
 $I$ is the inertial number, is a common approach and uses dimensional arguments to relate the stress state to the state of strain rate at a point through a local constitutive equation. The
 $\mu (I)$ rheology works well in homogeneous shearing and certain other dense inertial flows, such as flow down an incline. However, the
 $\mu (I)$ rheology cannot capture a broad set of inhomogeneous flows spanning the quasi-static and dense inertial flow regimes, and a number of non-local continuum modelling approaches have been developed to capture the features of dense, inhomogeneous flows (Kamrin Reference Kamrin2019).
Only a few works have sought to couple segregation modelling with rheological constitutive equations for a dense, bidisperse granular medium. For example, Liu et al. (Reference Liu, Gonzalez and Wassgren2019) combined a rate-independent, Mohr–Coulomb-based, elasto-plasticity model with the pressure-gradient-driven segregation model of Fan et al. (Reference Fan, Schlick, Umbanhowar, Ottino and Lueptow2014) and applied the coupled model to dense, bidisperse flows in rotating drums and hoppers. More recently, Barker et al. (Reference Barker, Rauter, Maguire, Johnson and Gray2021) combined a regularized version of the  $\mu (I)$ rheology (Barker & Gray Reference Barker and Gray2017) with the pressure-gradient-driven segregation model of Trewhela et al. (Reference Trewhela, Ancey and Gray2021) and applied the coupled model to dense, bidisperse flows down an inclined plane and in a rotating drum. Finally, in our recent work (Liu et al. Reference Liu, Singh and Henann2023), we generalized the non-local granular fluidity (NGF) model for dense granular flow (Kamrin & Koval Reference Kamrin and Koval2012; Henann & Kamrin Reference Henann and Kamrin2013) from monodisperse to bidisperse granular systems and proposed a segregation model for the shear-strain-rate-gradient-driven flux. We showed that this coupled model could simultaneously capture segregation dynamics and flow fields in two different flow geometries in the absence of pressure gradients – vertical chute flow and annular shear flow. However, none of these models account for both pressure-gradient-driven and shear-strain-rate-gradient-driven segregation within a framework coupled to the rheological modelling of a dense granular medium.
The purpose of this paper is to develop a model that integrates pressure-gradient-driven and shear-strain-rate-gradient-driven segregation, granular diffusion and non-local rheological behaviour spanning the quasi-static and dense inertial flow regimes  $(I\lesssim 10^{-1})$ into one framework capable of predicting segregation dynamics and flow fields. The starting point is our recent work (Liu et al. Reference Liu, Singh and Henann2023), which accounts for all but the pressure-gradient-driven flux. To this end, we supplement this model with a phenomenological constitutive equation for the pressure-gradient-driven flux, based on the works of Gajjar & Gray (Reference Gajjar and Gray2014) and Trewhela et al. (Reference Trewhela, Ancey and Gray2021). To calibrate and test the coupled, continuum model, we perform DEM simulations using the open-source software LAMMPS (Plimpton Reference Plimpton1995). We return to the widely studied, inclined plane flow geometry to calibrate the model for dense, bidisperse systems of both frictional spheres and disks, focusing on a fixed grain-size ratio. Then, we perform validation tests, in which we compare continuum model predictions of the steady-state flow fields and the transient evolution of the segregation dynamics against DEM simulation results in both inclined plane flow and an additional flow geometry not used in model calibration – planar shear flow with gravity. Both of these flow geometries involve shear-strain-rate gradients and pressure gradients, so it is important to account for both driving forces of segregation to capture the segregation dynamics in both geometries with a single set of parameters.
The remainder of this paper is organized as follows. First, we discuss the continuum framework for modelling coupled size segregation and flow in § 2. Specifically, we discuss the segregation model in § 2.5 wherein we append the constitutive equation for the pressure-gradient-driven flux (Gajjar & Gray Reference Gajjar and Gray2014; Trewhela et al. Reference Trewhela, Ancey and Gray2021) to the model of Liu et al. (Reference Liu, Singh and Henann2023). To determine the dimensionless material parameters that appear in the pressure-gradient-driven size-segregation model for both spheres and disks, we consider flows of bidisperse mixtures down an inclined plane in § 3 and fit the model to steady-state DEM simulation results. Then, we perform validation tests of the continuum model against DEM simulation results for the transient evolution of the segregation dynamics, first for inclined plane flow in § 4.1 and second for an additional flow configuration not used in model calibration – planar shear flow with gravity – in § 4.2 without parameter adjustment. In § 5 we examine the relative contributions of the two driving forces of segregation in both flow geometries and, finally, we close with some concluding remarks in § 6.
2. Continuum framework
In this section we discuss the continuum framework used to model dense, bidisperse granular mixtures. As in our prior work (Liu et al. Reference Liu, Singh and Henann2023), we utilize a mixture-theory-based approach (e.g. Gray Reference Gray2018; Umbanhowar et al. Reference Umbanhowar, Lueptow and Ottino2019). While the continuum model developed in this work is a coupled model for size segregation and flow, we primarily focus on the size-segregation aspect of the model in this section. The rheological constitutive equations that we utilize for bidisperse systems have been discussed in detail in our prior work (Liu et al. Reference Liu, Singh and Henann2023) and, for brevity, are only recapped in Appendix A. Regarding notation, we use component notation, in which the components of vectors,  $\boldsymbol {v}$, and tensors,
 $\boldsymbol {\sigma }$, relative to a set of Cartesian basis vectors
 $\{\boldsymbol {e}_i|i=1,2,3\}$ are denoted by
 $v_i$ and
 $\sigma _{ij}$, respectively. The Einstein summation convention is employed, and the Kronecker delta,
 $\delta _{ij}$, is utilized to denote the components of the identity tensor.
2.1. Bidisperse systems
We consider bidisperse granular systems made up of grains of two different sizes: large grains with average diameter  $d^{l}$ and small grains with average diameter
 $d^{s}$. As in Liu et al. (Reference Liu, Singh and Henann2023), our focus is size-based segregation, and to eliminate density-based segregation, all grains are taken to be made of the same material with mass density
 $\rho _{s}$. Both three-dimensional systems of bidisperse spheres and two-dimensional systems of bidisperse disks are considered in this work but, for brevity, in what follows, we describe the continuum framework for three-dimensional systems of spheres. In the mixture theory approach utilized here, several quantities are introduced for each species: the large grains and the small grains. Large-grain quantities are denoted with a superscript
 ${l}$ and small-grain quantities with a superscript
 ${s}$. The solid fractions, i.e. the volumes occupied by each species per unit total volume, are denoted as
 $\phi ^{l}$ and
 $\phi ^{s}$ for large and small grains, respectively, and the total solid fraction is
 $\phi = \phi ^{l} + \phi ^{s}$. The concentrations of each species are defined as
 $c^{l} = \phi ^{l}/\phi$ and
 $c^{s} = \phi ^{s}/\phi ^{s}$, so that
 $c^{l} + c^{s} =1$. The average grain size is defined as
 $\bar {d} = c^{l} d^{l} + c^{s} d^{s}$.
2.2. Kinematics of flow
The velocity fields for each species are denoted as  $v^{l}_i$ and
 $v^{s}_i$, and the mixture velocity field is defined as
 $v_i = c^{l} v^{l}_i + c^{s} v^{s}_i$. The strain-rate tensor for the mixture is defined as the symmetric part of the gradient of the mixture velocity:
 ${\mathsf{D}}_{ij} = (1/2)(\partial v_i / \partial x_j + \partial v_j/ \partial x_i )$. In this work, we focus on dense flows spanning the quasi-static and dense inertial flow regimes
 $(I\lesssim 10^{-1})$. Across our DEM simulations, we observe that the total solid fraction remains approximately uniform both spatially and temporally, and any volume change at flow initiation occurs over a much shorter time scale than the process of segregation. Therefore, we make the common idealization that dense flow of the mixture proceeds at constant volume (e.g. Gray & Thornton Reference Gray and Thornton2005; Gray & Chugunov Reference Gray and Chugunov2006; Gray & Ancey Reference Gray and Ancey2011; Gajjar & Gray Reference Gajjar and Gray2014; Barker et al. Reference Barker, Rauter, Maguire, Johnson and Gray2021; Liu et al. Reference Liu, Singh and Henann2023). (We note that this idealization is not appropriate for flows in the dilute, or collisional, flow regime (
 $I\gtrsim 10^{-1}$), in which the total solid fraction can evolve both spatially and temporally.) Under the constant-volume idealization, the mixture velocity field is divergence free,
 $\partial v_i/\partial x_i=0$; the strain-rate tensor is deviatoric,
 ${\mathsf{D}}_{kk}=0$; and the total solid fraction
 $\phi$ remains constant. Based on our DEM simulations, throughout this study, we take
 $\phi =0.6$ for spheres and
 $\phi =0.8$ for disks. The equivalent shear-strain rate is defined as
 $\dot {\gamma } = (2 {\mathsf{D}}_{ij} {\mathsf{D}}_{ij})^{1/2}$.
2.3. Balance of mass
Using the mixture velocity field and the species-specific velocity fields, the relative volume fluxes for large and small grains are defined as  $w^{l}_i = c^{l} (v^{l}_i - v_i)$ and
 $w^{s}_i = c^{s} (v^{s}_i - v_i)$, respectively, so that
 $w^{l}_i + w^{s}_i = 0_i$. Conservation of mass applied to the large grains requires that
 \begin{equation} \frac{{\rm D} c^{l}}{{\rm D} t} + \frac{\partial w^{l}_i}{\partial x_i} = 0, \end{equation}
where  ${\rm D}(\bullet )/{\rm D}t$ is the material time derivative. In what follows, we utilize
 $c^{l}$ as the field variable that describes the dynamics of size segregation. A constitutive equation is then required for the relative volume flux
 $w^{l}_i$. In our previous work (Liu et al. Reference Liu, Singh and Henann2023), we proposed a constitutive equation for
 $w^{l}_i$ that accounts for diffusion and shear-strain-rate-gradient-driven segregation. In § 2.5 we review this model and extend it to account for pressure-gradient-driven segregation.
2.4. Stress and the equations of motion
The stress-related fields for the mixture are defined as follows: the symmetric Cauchy stress tensor  $\sigma _{ij} = \sigma _{ji}$, the pressure
 $P =- (1/3)\sigma _{kk}$, the stress deviator
 $\sigma _{ij}' = \sigma _{ij} + P \delta _{ij}$, the equivalent shear stress
 $\tau = (\sigma _{ij}'\sigma _{ij}'/2)^{1/2}$ and the stress ratio
 $\mu =\tau /P$. The equations of motion are
 \begin{equation} \phi\rho_{s}\frac{{\rm D} v_i}{{\rm D}t}= \frac{\partial \sigma_{ij}}{\partial x_j} + b_i, \end{equation}
where  $\phi$ is the constant total solid fraction and
 $b_i$ is the non-inertial body force per unit volume (typically gravitational). Rheological constitutive equations are then required for the Cauchy stress
 $\sigma _{ij}$. In our previous work (Liu et al. Reference Liu, Singh and Henann2023), we generalized the NGF model for dense granular flow from monodisperse to bidisperse systems. In this work, we continue to utilize the generalized NGF model to describe the rheological behaviour of dense, bidisperse granular flows, which, for brevity, is summarized in Appendix A.
2.5. Segregation model
In this section we discuss the constitutive equation for the relative volume flux  $w^{l}_i$. In dense granular flows a bidisperse mixture tends to segregate due to both shear-strain-rate gradients and pressure gradients. Moreover, diffusion acts counter to segregation and tends to mix the two species. Accordingly, we take the relative volume flux to be comprised of three contributions as follows:
 \begin{equation} w^{l}_i = w^{diff}_i + w^{S}_i + w^{P}_i. \end{equation}
Here  $w^{diff}_i$ is the diffusion flux,
 $w^{S}_i$ is the shear-strain-rate-gradient-driven segregation flux and
 $w^{P}_i$ is the pressure-gradient-driven segregation flux.
The first two contributions have been examined in detail in our prior work (Liu et al. Reference Liu, Singh and Henann2023) and are briefly recapped here. First, we take the diffusion flux to be driven by concentration gradients as  $w^{diff}_i = -D (\partial c^{l} / \partial x_i )$, where
 $D$ is the binary diffusion coefficient. In a dense, bidisperse granular mixture, the binary diffusion coefficient follows a well-established scaling (e.g. Barker et al. Reference Barker, Rauter, Maguire, Johnson and Gray2021; Duan et al. Reference Duan, Umbanhowar, Ottino and Lueptow2021; Trewhela et al. Reference Trewhela, Ancey and Gray2021; Liu et al. Reference Liu, Singh and Henann2023) with the average grain size
 $\bar {d}$ and the shear-strain rate
 $\dot {\gamma }$ as
 $D = C_{diff} \bar {d}^2 \dot {\gamma }$, where
 $C_{diff}$ is a dimensionless material parameter. Therefore, the diffusion flux is
 \begin{equation} w^{diff}_i ={-}C_{diff} \bar{d}^2 \dot{\gamma} \frac{\partial c^l}{\partial x_i}. \end{equation}
Second, in Liu et al. (Reference Liu, Singh and Henann2023) we isolated shear-strain-rate-gradient-driven segregation in two flow configurations with uniform pressure and proposed the following phenomenological constitutive equation for the flux  $w^{S}_i$:
 \begin{equation} w^{S}_i = C^{S}_{seg} \bar{d}^2 c^{l}(1-c^{l}) \frac{\partial \dot{\gamma}}{\partial x_i}. \end{equation}
Here  $C^{S}_{seg}$ is another dimensionless material parameter. In (2.5) the pre-factor depends on the average grain size through
 $\bar {d}^2$ for dimensional consistency and involves a symmetric dependence on
 $c^{l}$ through
 $c^{l}(1-c^{l})$, which ensures that segregation ceases when the bidisperse mixture becomes either all large (
 $c^{l}=1$) or all small (
 $c^{l}=0$) grains. While a symmetric dependence of the pre-factor on
 $c^{l}$ was sufficient to capture the DEM data of Liu et al. (Reference Liu, Singh and Henann2023) in the absence of pressure gradients, it contrasts with the asymmetric dependence that has been invoked to model pressure-gradient-driven size segregation in the literature (e.g. Gajjar & Gray Reference Gajjar and Gray2014; Tunuguntla, Weinhart & Thornton Reference Tunuguntla, Weinhart and Thornton2017; Jones et al. Reference Jones, Isner, Xiao, Ottino, Umbanhowar and Lueptow2018; Barker et al. Reference Barker, Rauter, Maguire, Johnson and Gray2021; Trewhela et al. Reference Trewhela, Ancey and Gray2021) and in the next paragraph of the present work.
Next, we consider the segregation flux associated with pressure gradients,  $w^{P}_i$. We hypothesize that the segregation flux
 $w^{P}_i$ is driven by gradients in the pressure
 $P$ and adopt the following phenomenological form for the constitutive equation for
 $w^{P}_i$:
 \begin{equation} w^{P}_i ={-}C^{P}_{seg} \frac{\bar{d}^2 \dot{\gamma}}{P} c^{l}(1-c^{l}) (1- \alpha + \alpha c^{l}) \frac{\partial P}{\partial x_i}. \end{equation}
Here  $C^{P}_{seg}$ and
 $\alpha$ are dimensionless parameters dependent upon mixture properties (e.g. the grain-size ratio). The dependence of the pre-factor on
 $\dot {\gamma }c^{l}(1-c^{l})$ ensures that (2.6) satisfies several minimal requirements – namely, that the pressure-gradient-driven segregation flux is zero when there is no flow (
 $\dot \gamma =0$) or when the mixture becomes either all large (
 $c^{l}=1$) or all small (
 $c^{l}=0$) grains. Next, the dependence of the pre-factor on
 $\bar {d}^2/P$ ensures dimensional consistency. Finally, in contrast to (2.5), the dependence of (2.6) on the factor
 $(1 - \alpha + \alpha c^{l})$ introduces an asymmetric dependence on
 $c^{l}$ into the flux constitutive equation.
Several comments on the flux constitutive equation (2.6) are warranted.
(i) The dependence of (2.6) on
 $c^{l}$ through the asymmetric flux function $f(c^{l}) = c^{l}(1-c^{l}) (1 - \alpha + \alpha c^{l})$ follows directly from the work of Gajjar & Gray (Reference Gajjar and Gray2014), where $\alpha \in [0,1]$ is a parameter that controls the amount of asymmetry (denoted as $\gamma$ in Gajjar & Gray Reference Gajjar and Gray2014). As discussed in Gajjar & Gray (Reference Gajjar and Gray2014), the flux function $f(c^{l})$ has the following properties: (1) for $\alpha =0$, the symmetric flux function is recovered; (2) for $\alpha \in (0,1]$, the function's maximum is skewed from $c^{l}=0.5$ towards $c^{l}=1$; (3) for $\alpha \in (0, 0.5]$, it is convex; and (4) for $\alpha \in (0.5, 1]$, it is non-convex with a single inflection point. Previously, a value of $\alpha =0.46$ was obtained in Gajjar & Gray (Reference Gajjar and Gray2014) by fitting to the experiments of Wiederseiner et al. (Reference Wiederseiner, Andreini, Épely-Chauvin, Moser, Monnereau, Gray and Ancey2011), and a value of $\alpha =0.89$ was determined by fitting to experiments in van der Vaart et al. (Reference van der Vaart, Gajjar, Epely-Chauvin, Andreini, Gray and Ancey2015). In what follows, we estimate $\alpha$ along with $C^{P}_{seg}$ for both simulated, frictional spheres and disks by fitting to DEM simulations.
(ii) We note that the scaling of the pressure-gradient-driven segregation flux (2.6) with
$\bar {d}^2\dot {\gamma }/P$ is quite similar to the scalings for the segregation velocity reported in Trewhela et al. (Reference Trewhela, Ancey and Gray2021) and Jing et al. (Reference Jing, Ottino, Umbanhowar and Lueptow2022) based on experiments and discrete simulations, respectively, of the dynamics of a single intruder in a flowing dense granular medium, and the scaling of Trewhela et al. (Reference Trewhela, Ancey and Gray2021) was utilized in the continuum simulations of Barker et al. (Reference Barker, Rauter, Maguire, Johnson and Gray2021). As pointed out in these works, combining a segregation flux that is inversely proportional to the pressure with a pressure-independent diffusion flux enables a model to capture the attenuation of segregation with increasing pressure, which was observed in the discrete simulations of Fry et al. (Reference Fry, Umbanhowar, Ottino and Lueptow2018, Reference Fry, Umbanhowar, Ottino and Lueptow2019) in flows involving weak strain-rate gradients. However, one difference is that Trewhela et al. (Reference Trewhela, Ancey and Gray2021) introduces a second term in the denominator to prevent a singularity when the pressure is equal to zero, such as at a free surface. This additional term in the denominator depends on the product of the magnitude of the pressure gradient and the average grain size $\bar {d}$ and is multiplied by an additional (small) dimensionless constant. Here, we follow a similar approach but directly add a small constant to the pressure field when dealing with free-surface flows in § 4.1.(iii) Finally, it has been well established that the pressure-gradient-driven segregation flux should depend on the grain-size ratio
$d^{l}/d^{s}$ (e.g. Schlick et al. Reference Schlick, Fan, Isner, Umbanhowar, Ottino and Lueptow2015; Tunuguntla et al. Reference Tunuguntla, Weinhart and Thornton2017; Jones et al. Reference Jones, Isner, Xiao, Ottino, Umbanhowar and Lueptow2018; Barker et al. Reference Barker, Rauter, Maguire, Johnson and Gray2021; Duan et al. Reference Duan, Umbanhowar, Ottino and Lueptow2021; Trewhela et al. Reference Trewhela, Ancey and Gray2021). However, the aims of this paper are to combine pressure-gradient-driven and shear-strain-rate-gradient-driven segregation fluxes within a coupled model for size segregation and flow and then to use this model to examine the interplay between the mechanisms. Therefore, we consider a single grain-size ratio of $d^{l}/d^{s}=1.5$ throughout, and considering the dependence of (2.6) on $d^{l}/d^{s}$ is beyond the scope of this paper. We expect that the substantial progress in the literature to characterize the role of the grain-size ratio (e.g. Trewhela et al. Reference Trewhela, Ancey and Gray2021) may be incorporated into (2.6).


Combining (2.4), (2.5) and (2.6) with the balance of mass equation (2.1), we obtain the following differential relation governing the dynamics of  $c^{l}$:
 $$\begin{gather} \dfrac{{\rm
D}{c}^{l}}{{\rm D}t} + \dfrac{\partial}{\partial x_i}
\left({-}C_{diff} \bar{d}^2 \dot{\gamma} \frac{\partial
c^l}{\partial x_i} + C^{S}_{seg} \bar{d}^2 c^{l}(1-c^{l})
\frac{\partial \dot{\gamma}}{\partial x_i}
\right.\nonumber\\ \left.- C^{P}_{seg}
\frac{\bar{d}^2 \dot{\gamma}}{P} c^{l}(1-c^{l}) (1- \alpha
+ \alpha c^{l}) \frac{\partial P}{\partial x_i} \right) =
0.
\end{gather}$$
The material parameters associated with the segregation model are the set  $\{C_{diff}, C^{S}_{seg}, C^{P}_{seg}, \alpha \}$. As discussed in Liu et al. (Reference Liu, Singh and Henann2023), the parameter
 $C_{diff}$ may be determined from measurements of the mean square displacement during homogeneous simple shearing, and the parameter
 $C^{S}_{seg}$ may be determined by examining size segregation in flows, in which the pressure field is spatially uniform. Based on the DEM simulations of Liu et al. (Reference Liu, Singh and Henann2023), these parameters are
 $\{C_{diff}=0.045, C^{S}_{seg}=0.08\}$ for frictional spheres and
 $\{C_{diff}=0.20, C^{S}_{seg}=0.23\}$ for frictional disks over a range of modest grain-size ratios including
 $d^{l}/d^{s}=1.5$. The remaining material parameters
 $\{C^{P}_{seg}, \alpha \}$, which are associated with the pressure-gradient-driven segregation flux, will be determined for frictional spheres and disks in the following section.
3. Pressure-gradient-driven segregation flux
In this section we evaluate the constitutive equation for the pressure-gradient-driven segregation flux (2.6) and estimate the material parameters associated with this segregation flux  $\{C^{P}_{seg}, \alpha \}$. To this end, we consider flows of both three-dimensional systems of dense, frictional spheres and two-dimensional systems of dense, frictional disks down an inclined plane, using DEM simulations. Details of the simulated granular systems, including the grain interaction properties that are maintained constant throughout, are given in Appendix B.1. We note that the inclined plane flow configuration has been widely utilized in the literature (e.g. Savage & Lun Reference Savage and Lun1988; Gray & Thornton Reference Gray and Thornton2005; Gray & Chugunov Reference Gray and Chugunov2006; Wiederseiner et al. Reference Wiederseiner, Andreini, Épely-Chauvin, Moser, Monnereau, Gray and Ancey2011; Marks et al. Reference Marks, Rognon and Einav2012; Gajjar & Gray Reference Gajjar and Gray2014; Staron & Phillips Reference Staron and Phillips2015; Barker et al. Reference Barker, Rauter, Maguire, Johnson and Gray2021) to study size segregation in dense granular materials.
Consider a semi-infinite layer of thickness  $H$ of a dense, bidisperse granular mixture flowing down an inclined plane with surface inclination angle
 $\theta$ under the action of gravity
 $G$. For the case of bidisperse spheres, the DEM set-up is shown in figure 1(a) for
 $H = 50\bar {d}_0$, where
 $\bar {d}_0$ is the system-wide average grain size. The large particles are dark grey and the small particles are light grey. We employ periodic boundary conditions along both the direction of flow (i.e. the
 $x$ direction) and the lateral direction (i.e. the
 $y$ direction), eliminating any lateral wall/boundary effects. In all DEM simulations of spheres, we take the length of the simulation domain along the
 $x$ direction to be
 $L=20 \bar {d}_0$ and the length along the
 $y$ direction to be
 $W=10 \bar {d}_0$, and we have verified that both of these length scales are sufficiently large, so that they do not affect the resulting flow and segregation fields. The rough bottom surface is comprised of touching, glued grains in our DEM simulations, which are denoted as black in figure 1(a). This is done to achieve a no-slip boundary condition along the bottom surface. In the resulting flow fields, the only non-zero component of the velocity field is
 $v_x$, which only varies along the vertical coordinate
 $z$. A typical steady velocity field is qualitatively sketched in figure 1(a), which is consistent with the familiar ‘Bagnold profile’.
(a) Initial well-mixed configuration for three-dimensional DEM simulation of bidisperse inclined plane flow with  $\sim$15 000 flowing grains. The thickness of the flowing layer is
 $H=50 \bar {d}_0$. Black grains represent the rough fixed base. Dark grey grains indicate large flowing grains and light grey grains indicate small flowing grains. (b) Segregated configuration after flowing for a simulation time of
 $\tilde {t} = t/\sqrt {\bar {d}_0/G} = 15\,000$. (c) Spatiotemporal evolution of the large-grain concentration field. Spatial profiles of (d) the concentration field
 $c^{l}$ and (e) the normalized velocity field
 $v_x/\sqrt {G \bar {d}_0}$ at three time instants (
 $\tilde {t} = 1000$,
 $5000$ and
 $15\,000$) as indicated by the vertical lines in (c).

Regarding the stress field, due to the force balances along the  $x$ and
 $z$ directions, we have
 $|\sigma _{xz}(z)| = |\sigma _{zx}(z)| = \phi \rho _{s} G z \sin \theta$ and
 $\sigma _{zz}(z) = -\phi \rho _{s} G z\cos \theta$, respectively. For two-dimensional systems of disks, we observe in DEM simulations that the normal stresses are approximately equal, i.e.
 $\sigma _{xx}(z) \approx \sigma _{zz}(z)$, so that
 $\tau (z) = | \sigma _{xz}(z) | = \phi \rho _{s} G z \sin \theta$,
 $P(z) = - \sigma _{zz}(z) = \phi \rho _{s} G z \cos \theta$ and
 $\mu (z) = \tau (z)/P(z) = \tan \theta$. For three-dimensional systems of spheres, we observe normal stress differences in DEM simulations (e.g. Srivastava et al. Reference Srivastava, Silbert, Grest and Lechman2021), in which, in particular, the magnitude of the out-of-plane normal stress
 $\sigma _{yy}(z)$ is slightly lower than the magnitude of
 $\sigma _{zz}(z)$ at each
 $z$ position. For spheres, the stress ratio
 $\mu$ is still spatially uniform but slightly higher than
 $\tan \theta$, and the pressure field
 $P(z)$ still varies linearly in
 $z$ but with a slope that is slightly lower than
 $\phi \rho _{s} G \cos \theta$.
There are four important dimensionless parameters that specify a case of inclined plane flow: (1)  $H/\bar {d}_0$, the dimensionless layer thickness; (2)
 $\theta$, the inclination angle, which sets the stress field for a given case and controls the total flow rate down the incline; (3)
 $c^{l}_0(z)$, the initial large-grain concentration, which can be a spatially varying field; and (4)
 $d^{l}/d^{s}$, the bidisperse grain-size ratio. Thus, the parameter set
 $\{H/\bar {d}_0, \theta, c^{l}_0, d^{l}/d^{s}\}$ specifies the geometry, loads and initial conditions for a given case of inclined plane flow. We choose a representative base case for spheres corresponding to the parameter set
 $\{H/\bar {d}_0=50, \theta =26^\circ, c^{l}_0 = 0.50, d^{l}/d^{s} = 1.5\}$, and the initially well-mixed DEM configuration for this case is shown in figure 1(a). We then run the DEM simulation from this initial configuration and observe the consequent segregation process. Due to the gravitationally induced pressure gradient, we expect the large grains (dark grey) to be driven towards the top of the layer where the pressure is the lowest. The segregated state after a simulation time of
 $\tilde {t} = t/\sqrt {\bar {d}_0/G} = 15\,000$ is shown in figure 1(b), demonstrating that the large grains indeed segregate towards the top of the layer, leaving a layer of small grains (light grey) beneath. In order to obtain a more quantitative picture of the segregation dynamics, we coarse grain the concentration field
 $c^{l}$ and plot contours of the spatiotemporal evolution of the
 $c^{l}$ field in figure 1(c). (The methods used for spatial coarse graining are described in Appendix B.2.) The growing width of the dark region indicates the temporal evolution of the large grains segregating to the top of the layer. Furthermore, snapshots of the concentration field
 $c^{l}$ and the non-dimensionalized velocity field
 $v_x/\sqrt {G \bar {d}_0}$ at different times –
 $\tilde {t} = 1000, 5000, 15\,000$ as indicated by the vertical lines in figure 1(c) – are shown in figures 1(d) and 1(e), respectively. It is evident from these plots that the velocity field reaches a steady state early in the simulation time window, while the concentration field continues to evolve and only reaches a steady state towards the end of the simulation time window, i.e.
 $\tilde {t} \gtrsim 15\,000$. Lastly, the shape of the steady flow field
 $v_x(z)$ in figure 1(e) is consistent with the scaling
 $v_x(z) \propto H^{3/2} - z^{3/2}$, associated with the ‘Bagnold profile’ (e.g. Gray & Thornton Reference Gray and Thornton2005).
In the inclined plane flow configuration, both pressure gradients and shear-strain-rate gradients are present. The shape of the steady flow field  $v_x(z)$ in figure 1(e) indicates that the shear-strain rate is greatest at the bottom of the layer, decreasing with the distance from the bottom of the layer and approaching zero at the top of the layer. Therefore, the shear-strain-rate gradient drives the large grains towards the high-strain-rate region at the bottom of the layer, while the pressure gradient drives the large grains towards the low-pressure region at the top of the layer. As a result, the shear-strain-rate-gradient-driven and pressure-gradient-driven fluxes are in competition with one another, and the pressure-gradient-driven flux clearly wins out and drives the large grains towards the top of the layer. This characteristic of inclined plane flow makes it a suitable configuration for estimating the dimensionless material parameters
 $\{C^{P}_{seg},\alpha \}$. To achieve this, we first run the DEM simulation long enough so that all evolving fields reach the steady-state regime (
 $\tilde {t} \gtrsim 15\,000$). In this regime,
 ${{\rm D} c^{l}}/{{\rm D} t} \approx 0$, and according to the balance of mass equation (2.1) and the no-flux boundary conditions at the top and bottom of the layer, the total flux is zero, i.e.
 $w^{l}_z = w^{diff}_z + w^{S}_z + w^{P}_z = 0$, at each
 $z$ position. Therefore, in the steady-state regime, using (2.4), (2.5) and (2.6), we have
 \begin{equation} C^{S}_{seg}\bar{d}^2c^{l}(1-c^{l})\frac{\partial \dot{\gamma}}{\partial z} - C_{diff} \bar{d}^2\dot{\gamma} \frac{\partial c^{l}}{\partial z} = C^{P}_{seg} \frac{\bar{d}^2 \dot{\gamma}}{P} c^{l}(1-c^{l})(1 - \alpha + \alpha c^{l}) \frac{\partial P}{\partial z}. \end{equation}
Since the parameters  $C_{diff}$ and
 $C^{S}_{seg}$ have been previously determined, we use this steady-state flux balance to estimate the parameters
 $\{C^{P}_{seg},\alpha \}$. To do so, we spatially coarse grain the DEM data from
 $1000$ evenly distributed snapshots in the steady-state regime to obtain the relevant field quantities in (3.1) – namely,
 $c^{l}$ (and, hence,
 $\bar {d}$),
 $\partial c^{l}/\partial z$,
 $v_x$,
 $\dot {\gamma } = \partial v_x/\partial z$,
 $\partial \dot {\gamma }/\partial z = \partial ^2 v_x/ \partial z^2$,
 $P$ and
 $\partial P/\partial z$. The fields are then arithmetically averaged in time so that the resultant fields only depend on the spatial coordinate
 $z$. Equation (3.1) suggests determining the parameter
 $C^{P}_{seg}$ from the slope of the
 $C^{S}_{seg} \bar {d}^2c^{l}(1-c^{l}) ({\partial \dot {\gamma }}/{\partial z}) - C_{diff} \bar {d}^2\dot {\gamma } ({\partial c^{l}}/{\partial z})$ vs
 $({\bar {d}^2 \dot {\gamma }}/{P}) c^{l}(1-c^{l})(1 - \alpha + \alpha c^{l}) ({\partial P}/{\partial z})$ relation for a given choice of
 $\alpha \in [0,1]$. Since
 $\alpha$ is an adjustable parameter along with
 $C^{P}_{seg}$, additional data are helpful to more precisely estimate the values of the parameters
 $\{C^{P}_{seg},\alpha \}$, and we consider three additional variants of the base case – namely, (1) a lower inclination angle case
 $\{H/\bar {d}_0=50, \theta =24^\circ, c^{l}_0 = 0.50, d^{l}/d^{s} = 1.5\}$; (2) a more large grains case
 $\{H/\bar {d}_0=50, \theta =26^\circ, c^{l}_0 = 0.75, d^{l}/d^{s} = 1.5\}$; and (3) a thicker layer case
 $\{H/\bar {d}_0=60, \theta =26^\circ, c^{l}_0 = 0.50, d^{l}/d^{s} = 1.5\}$. We coarse grain the steady-state DEM field data for all four cases and iterate over values of
 $\alpha$, seeking the strongest linear collapse in
 $C^{S}_{seg} \bar {d}^2c^{l}(1-c^{l})({\partial \dot {\gamma }}/{\partial z}) - C_{diff} \bar {d}^2\dot {\gamma } ({\partial c^{l}}/{\partial z})$ vs
 $({\bar {d}^2 \dot {\gamma }}/{P}) c^{l}(1-c^{l})(1 - \alpha + \alpha c^{l}) ({\partial P}/{\partial z})$. The DEM data for the best-fit case of
 $\alpha =0.4$ is shown in figure 2(a), where each data point represents a unique
 $z$ position. The data collapses quite well across the different cases and a linear dependence is evident. For
 $\alpha =0.4$, the coefficient of determination (i.e. the R-squared value) is
 $0.92$. Finally, the dimensionless material parameter
 $C^{P}_{seg}$ may be obtained from the slope of the linear relation in figure 2(a) (indicated by the solid line), which we determine to be
 $C^{P}_{seg} = 0.34$ for frictional spheres with a size ratio of
 $d^{l}/d^{s}=1.5$.
Collapse of  $C^{S}_{seg} \bar {d}^2c^{l}(1-c^{l})({\partial \dot {\gamma }}/{\partial z}) - C_{diff} \bar {d}^2\dot {\gamma } ({\partial c^{l}}/{\partial z})$ vs
 $({\bar {d}^2 \dot {\gamma }}/{P}) c^{l}(1-c^{l})(1 - \alpha + \alpha c^{l}) ({\partial P}/{\partial z})$ for several cases of inclined plane flow of (a) bidisperse spheres and (b) bidispserse disks with a size ratio of
 $d^{l}/d^{s}=1.5$. Symbols represent coarse-grained, steady-state DEM field data, and the solid lines are the best linear fits using (a)
 $C^{P}_{seg} = 0.34$ for spheres and (b)
 $C^{P}_{seg} = 0.51$ for disks.

We also apply this process to dense, bidisperse mixtures of frictional disks to determine the parameters  $\{C^{P}_{seg},\alpha \}$. We consider a base case for disks corresponding to the parameter set
 $\{H/\bar {d}_0=60, \theta =20^\circ, c^{l}_0 = 0.50, d^{l}/d^{s} = 1.5\}$ as well as three variants – (1) a lower inclination angle case
 $\{H/\bar {d}_0=60,\, \theta =18^\circ, c^{l}_0 = 0.50, d^{l}/d^{s} = 1.5\}$; (2) a more large grains case
 $\{H/\bar {d}_0=60,\, \theta =20^\circ,\, c^{l}_0 = 0.75, d^{l}/d^{s} = 1.5\}$; and (3) a thinner layer case
 $\{H/\bar {d}_0=40, \theta =20^\circ, c^{l}_0 = 0.50, d^{l}/d^{s} = 1.5\}$. In the DEM simulations for disks, the length of the simulation domain along the
 $x$ direction is taken to be
 $L=60\bar {d}_0$ in all cases, and each case involves
 $\sim$5000 flowing grains. Each DEM simulation is run to steady state; the steady-state DEM data are coarse grained; and the flux balance (3.1) is applied. The DEM data for all four cases is plotted in figure 2(b) for
 $\alpha =0.4$ and the data again collapses quite well. A linear relation is observed (with an R-squared value of
 $0.82$), and the parameter
 $C^{P}_{seg}$ for frictional disks with a size ratio of
 $d^{l}/d^{s}=1.5$ is determined from the slope of the linear relation to be
 $C^{P}_{seg} = 0.51$. We note that we have utilized the same value of
 $\alpha =0.4$ for both spheres and disks. Of course, the parameter
 $\alpha$ may be fitted separately to steady-state DEM data for spheres and disks, respectively, but we observed that the separately fitted values of
 $\alpha$ turn out to be quite similar, so for simplicity, the value of
 $\alpha =0.4$ represents the collective best fit that yields the strongest linear collapses of the steady-state DEM data for both spheres and disks simultaneously.
4. Validation of the continuum model in the transient regime
In § 2.5 we extended the coupled model for segregation and flow in the absence of pressure gradients proposed in our prior work (Liu et al. Reference Liu, Singh and Henann2023) to account for pressure-gradient-driven segregation, and in § 3 we estimated the dimensionless material parameters  $\{C^{P}_{seg},\alpha \}$ associated with the pressure-gradient-driven segregation flux using steady-state DEM data in inclined plane flow. In this section we test the continuum model by comparing predictions of the transient evolution of the large-grain concentration fields and the steady-state flow fields against DEM simulation results for spheres. To this end, we consider both inclined plane flow as described in § 3 and an additional flow geometry – planar shear flow with gravity. The coupled continuum model consists of the segregation dynamics equation (2.7) and the NGF model, (A2) and (A3), and throughout, we utilize a fixed set of parameters for spheres,
 $$\begin{gather} \left\{\vphantom{C^{P}_{seg}} \mu_{s}=0.37, \mu_2=0.95, I_0=0.58, A=0.43, \right. \nonumber\\ \left. C_{diff}=0.045, C^{S}_{seg}=0.08, C^{P}_{seg}=0.34, \alpha=0.4 \right\}, \end{gather}$$
where  $\{\mu _{s},\mu _2,I_0,A\}$ are rheological parameters.
4.1. Inclined plane flow
We first consider inclined plane flow to test predictions of the coupled continuum model against corresponding DEM results. As discussed above, when there are no normal stress differences, the stress field may be obtained from a static force balance, which implies that the stress ratio field is uniform and given by  $\mu (z) = \tan \theta$ and that the pressure field is linear in
 $z$ and given by
 $P(z) = \phi \rho _{s} G z \cos \theta$. However, the normal stress differences that arise in dense flows of spheres induce a slightly higher, uniform value of
 $\mu$ and a slightly lower slope in the pressure field
 $P(z)$. Accordingly, to control for this effect when working with dense flows of spheres, in our continuum simulations, we utilize the values of the uniform stress ratio and the slope of the pressure field obtained from the coarse-grained stress fields in the DEM data for each case, rather than the nominal values of
 $\tan \theta$ and
 $\phi \rho _{s} G \cos \theta$, respectively. Moreover, to avoid a singularity in the pressure-gradient-driven segregation flux (2.6) at the free surface where
 $z=0$, we add a small constant to the pressure field corresponding to the weight of a layer of
 $(1/4)\bar {d}_0$ thickness, i.e.
 $(1/4)\phi \rho _{s} G \bar {d}_0 \cos \theta$. This approach is quite similar to that of Trewhela et al. (Reference Trewhela, Ancey and Gray2021), who directly incorporate this small constant into the denominator of their pressure-gradient-driven flux equation. We have verified that the subsequently presented results are insensitive to the exact choice of this constant, so long as it is sufficiently small. With the relevant stress-related fields determined in this way, the balance of linear momentum (2.2) is satisfied and does not further enter the solution procedure.
Continuum model predictions are obtained by numerically solving the remaining governing equations using finite differences. The remaining unknown fields in inclined plane flow are the velocity field  $v_x(z,t)$ with the associated strain-rate field
 $\dot {\gamma }(z,t) = \partial v_x/\partial z$, the granular fluidity field
 $g(z,t)$ and the concentration field
 $c^{l}(z,t)$. The governing equations are (1) the flow rule (A2),
 \begin{equation} \dot{\gamma} = g \mu; \end{equation}
(2) the non-local rheology (A3),
 \begin{equation} g = g_{loc} (\mu, P) + \xi^2(\mu) \frac{\partial^2 g}{\partial z^2}, \end{equation}
where  $g_{loc} (\mu, P)$ and
 $\xi (\mu )$ are stress-dependent functions given through (A4) and (A5)
 $_1$, respectively; and finally (3) the segregation dynamics equation (2.7),
 $$\begin{gather} \dfrac{\partial c^{l}}{\partial t} + \frac{\partial}{\partial z} \left(- C_{diff} \bar{d}^2\dot{\gamma} \frac{\partial c^{l}}{\partial z} + C^{S}_{seg}\bar{d}^2c^{l}(1-c^{l})\frac{\partial \dot{\gamma}}{\partial z} \right.\nonumber\\ \left. - C^{P}_{seg} \frac{\bar{d}^2 \dot{\gamma}}{P} c^{l}(1-c^{l})(1 - \alpha + \alpha c^{l}) \frac{\partial P}{\partial z} \right) = 0, \end{gather}$$
where  $\bar {d} = c^{l} d^{l} + (1-c^{l}) d^{s}$.
For the fluidity boundary conditions, we impose a homogeneous Neumann boundary condition at the free surface, i.e.  $\partial g/ \partial z =0$ at
 $z=0$, due to the similarity of a flat free surface to a symmetry plane. The bottom surface is comprised of touching, glued grains in our DEM simulations, and the selection of a fluidity boundary condition for this type of boundary is discussed in our prior work (Liu et al. Reference Liu, Singh and Henann2023). Following this work, we impose a Dirichlet fluidity boundary condition at the bottom surface wherein the fluidity is a function of the stress state through the local fluidity function, i.e.
 $g=g_{loc}(\mu (z=H), P(z=H))$ at
 $z=H$. For the segregation dynamics equation (4.4), we apply no flux boundary conditions at both the free surface and the bottom surface, i.e.
 $w^{l}_z = - C_{diff} \bar {d}^2 \dot {\gamma } (\partial c^{l}/ \partial z ) + C^{S}_{seg} \bar {d}^2 c^{l} (1- c^{l})( \partial \dot {\gamma } / \partial z ) - C^{P}_{seg} ({\bar {d}^2 \dot {\gamma }}/{P})c^{l} (1- c^{l}) (1 - \alpha + \alpha c^{l}) (\partial P/ \partial z) =0$ at
 $z=0$ and
 $H$. Finally, an initial condition for the segregation dynamics equation (4.4) – i.e.
 $c^{l}_0(z) = c^{l}(z, t=0)$ – is necessary. To account for spatial fluctuations in
 $c^{l}_0(z)$, we coarse grain the concentration field in the DEM configuration at
 $t=0$ for each case and use this field as the initial condition in the corresponding continuum simulation.
Then, we obtain numerical predictions of the continuum model for a given case of inclined plane flow using finite differences as follows. At a given point in time, the concentration field  $c^{l}(z)$ is known, and thus, the average grain size may be calculated as
 $\bar {d}(z) = c^{l}(z)d^{l} + (1-c^{l}(z))d^{s}$. Since the pressure distribution
 $P(z)$ and stress ratio distribution
 $\mu (z)$ are known, the local fluidity
 $g_{loc}(\mu, P)$ and the cooperativity length
 $\xi (\mu )$, given through (A4) and (A5)
 $_1$, respectively, can also be calculated at the spatial grid points. The non-local rheology equation (4.3) can then be solved by discretizing the Laplacian term
 $\partial ^2 g /\partial z^2$ using central differences in space. Once the fluidity field has been calculated at all grid points, the strain-rate field can be calculated using (4.2), and the velocity field
 $v_x(z)$ can be obtained by integrating the strain-rate field. Next, the segregation dynamics equation (4.4) is used to update the concentration field by (1) using the Euler method for temporal discretization, (2) treating both of the segregation fluxes explicitly, and (3) treating the diffusion term implicitly. We have verified that both the spatial and temporal resolutions employed are sufficiently refined, so as to ensure the numerical accuracy and stability of our finite-difference scheme. With this, one step of numerical integration is completed and the unknown fields
 $c^{l}$, hence
 $\bar {d}$, are obtained at the next time step. The same procedure is repeated over multiple time steps to calculate the transient evolution of the concentration and flow fields,
 $c^{l}(z,t)$ and
 $v_x(z,t)$, over the desired simulation time window.
We compare model predictions of the transient evolution of the concentration field and the steady-state flow field against corresponding DEM simulation results for all four cases of inclined plane flow of dense, bidisperse spheres considered in § 3. The comparisons are summarized in figures 3 and 4. For each case, the spatiotemporal evolution of the DEM-measured  $c^{l}$ field is shown in the first column of figure 3 or figure 4, and the second columns show comparisons of snapshots of the
 $c^{l}$ field measured in DEM simulations against corresponding continuum model predictions at four different time instants –
 $\tilde {t} = t/\sqrt {\bar {d}_0/G} = 200, 2000, 10\,000$, and
 $15\,000$ – as indicated by the vertical lines on the contour plots in the first columns. The model does a good job predicting the segregation dynamics across different cases of inclined plane flow and can capture the variations in the evolution of the
 $c^{l}$ field as the input parameters are changed. The third columns show comparisons of the steady-state velocity field predicted by the continuum model with the corresponding DEM-measured velocity fields. The Bagnold-like profile is captured well in all cases. We note that in inclined plane flow, the local inertial, or
 $\mu (I)$, rheology described in Appendix A.1 would be sufficient to predict the flow fields, and a non-local rheological approach is not necessary for these flows. However, as shown in our prior work (Liu et al. Reference Liu, Singh and Henann2023) and in the subsequent section on planar shear flow with gravity, non-local rheological modelling is crucial in many other flow configurations. One benefit of the NGF model is that it automatically reduces to the local inertial rheology when appropriate, so for consistency, we have continued to use the NGF model when considering inclined plane flow. Finally, we have also tested predictions of the coupled continuum model against corresponding DEM results for dense, bidisperse flows of frictional disks, and the model does an equally good job simultaneously capturing the segregation dynamics and the steady-state flow fields for disks as for spheres.
Comparisons of continuum model predictions with corresponding DEM simulation results for the transient evolution of the segregation dynamics for two cases of inclined plane flow of bidisperse spheres: (a) base case  $\{H/\bar {d}_0=50, \theta =26^\circ, c^{l}_0 = 0.50, d^{l}/d^{s} = 1.5\}$ and (b) lower inclination angle case
 $\{H/\bar {d}_0=50, \theta =24^\circ, c^{l}_0 = 0.50, d^{l}/d^{s} = 1.5\}$. For each case, plots (a i,b i) show spatiotemporal contours of the evolution of
 $c^{l}$ measured in DEM simulations. Plots (a ii–v,b ii–v) show comparisons of the DEM simulations (solid black lines) and continuum model predictions (dashed grey lines) of the
 $c^{l}$ field at four different time instants during the segregation process:
 $\tilde {t} = 200$,
 $2000$,
 $10\,000$ and
 $15\,000$ in the sequence of (a ii,b ii), (a iii,b iii), (a iv,b iv), (a v,b v). Plots (a vi,b vi) show comparisons of the steady-state, normalized velocity profiles at
 $\tilde {t} = 15\,000$ from DEM simulations and continuum model predictions.

Comparisons of continuum model predictions with corresponding DEM simulation results for the transient evolution of the segregation dynamics for two cases of inclined plane flow of bidisperse spheres: (a) more large grains case  $\{H/\bar {d}_0=50, \theta =26^\circ, c^{l}_0 = 0.75, d^{l}/d^{s} = 1.5\}$ and (b) thicker layer case
 $\{H/\bar {d}_0=60, \theta =26^\circ, c^{l}_0 = 0.50, d^{l}/d^{s} = 1.5\}$. Results are organized as described in the caption of figure 3.

4.2. Planar shear flow with gravity
We have hypothesized that the proposed constitutive equation (2.6) for the pressure-gradient-driven segregation flux and the dimensionless material parameters  $\{C^{P}_{seg},\alpha \}$ are general across different flow geometries. To test this hypothesis, we consider a new flow configuration: planar shear flow with gravity acting orthogonal to the shearing direction, as illustrated in figure 5(a). We did not use DEM data from flows in this configuration to estimate the parameters
 $\{C^{P}_{seg},\alpha \}$ and do no further parameter adjustment in this section, so comparisons of continuum model predictions of the transient evolution of the large-grain concentration field and the steady-state flow field against DEM simulation results may be regarded as independent validation tests of the model.
Representative base case for planar shear flow with gravity. (a) Initial well-mixed configuration for three-dimensional DEM simulation of a bidisperse mixture of spheres with  $\sim$15 000 flowing grains. The thickness of the flowing layer is
 $H=50 \bar {d}_0$. Black grains represent the rough top and bottom walls. Dark grey grains indicate large flowing grains and light grey grains indicate small flowing grains. (b) Segregated state after flowing for a simulation time of
 $\tilde {t} = t/(\ell /v_{w}) = 600$. (c) Spatiotemporal evolution of the large-grain concentration field. Spatial profiles of (d) the concentration field
 $c^{l}$ and (e) the normalized velocity field
 $v_x/v_{w}$ at three times (
 $\tilde {t} = 10$,
 $100$ and
 $600$) as indicated by the vertical lines in (c).

We first describe this flow configuration in detail and discuss its important characteristics. Consider a semi-infinite layer of a dense, bidisperse granular mixture between two rough parallel walls, separated by a distance  $H$ along the
 $z$ direction. For the case of bidisperse spheres, the DEM set-up is shown in figure 5(a) for
 $H=50 \bar {d}_0$. The top and bottom walls, indicated as black grains in figure 5(a), are made of layers of touching, glued grains. The top wall imposes a compressive normal stress
 $P_{w}$ on the flowing grains along the
 $z$ direction and is specified to move with a constant velocity
 $v_{w}$ along the
 $x$ direction. The compressive normal stress applied by the top wall is maintained at its target value
 $P_{w}$ using the feedback scheme described elsewhere in the literature (e.g. da Cruz et al. Reference da Cruz, Emam, Prochnow, Roux and Chevoir2005; Koval et al. Reference Koval, Roux, Corfdir and Chevoir2009; Kamrin & Koval Reference Kamrin and Koval2012; Zhang & Kamrin Reference Zhang and Kamrin2017; Liu & Henann Reference Liu and Henann2018). The bottom wall is specified to remain fixed and imposes a no-slip boundary condition at the bottom. The gravitational body force with acceleration of gravity
 $G$ acts along the
 $z$ direction. Furthermore, we employ periodic boundary conditions along the flow (
 $x$) and lateral (
 $y$) directions, eliminating any lateral wall/boundary effects and leading to a simple one-dimensional flow in which the only non-zero velocity field component is
 $v_x$ that depends only on the
 $z$ coordinate. In all DEM simulations of spheres, we take the length of the simulation domain along the
 $x$ direction to be
 $L = 20 \bar {d}_0$ and the length along the
 $y$ direction to be
 $W = 10 \bar {d}_0$, as shown in figure 5(a).
Regarding the stress field, the force balance along the  $x$ direction gives that the shear stress magnitude is spatially uniform and equal to the shear stress imparted by the moving wall
 $\tau _{w}$, i.e.
 $|\sigma _{xz}(z)| = |\sigma _{zx}(z)| = \tau _{w}$. We note that instead of directly prescribing
 $\tau _{w}$ in our DEM simulations, the top-wall velocity
 $v_{w}$ is prescribed, and the shear stress
 $\tau _{w}$ arises as an output. The force balance along the
 $z$ direction gives that
 $\sigma _{zz}(z) = -(P_{w} + \phi \rho _{s} G z)$. As discussed in § 3, we observe that
 $\sigma _{xx}(z) \approx \sigma _{zz}(z)$ in DEM simulations of two-dimensional systems of disks, so that
 $\tau (z) = |\sigma _{xz}(z)| = \tau _{w}$,
 $P(z) = -\sigma _{zz} = P_{w} + \phi \rho _{s} G z$ and
 $\mu (z) = \tau (z)/P(z) = {\mu _{w}}/{(1 + z/\ell )}$, where
 $\mu _{w} = \tau _{w}/P_{w}$ is the maximum value of the stress ratio occurring at the top wall (
 $z=0$) and
 $\ell =P_{w}/\phi \rho _{s} G$ is the loading length scale. The loading length scale is defined as the ratio of the top-wall pressure
 $P_{w}$ to the gravitational body force
 $\phi \rho _{s} G$, which may be interpreted as the height of a granular layer that applies a pressure due to its weight equivalent to
 $P_{w}$, and is a distinct length scale from the dimensions
 $H$,
 $L$ and
 $W$. Again, while the coarse-grained stress fields in DEM simulations of disks are quite close to these analytical fields determined from force balances, in DEM simulations of spheres we observe normal stress differences, and while this leads to slight differences in the coarse-grained
 $\mu (z)$ and
 $P(z)$ fields for spheres, the
 $z$ dependence of these fields is consistent with the expressions derived above. Since the stress ratio is greatest at the top wall (
 $z=0$) and decays with
 $z$, we expect there to be a flowing region just beneath the top wall with the velocity field
 $v_x(z)$ decaying as
 $z$ increases, as qualitatively sketched in figure 5(a). Importantly, the loading length scale
 $\ell$ is the only length scale appearing in the analytical expression for the stress ratio field
 $\mu (z) = {\mu _{w}}/{(1 + z/\ell )}$. Therefore,
 $\ell$ and not the layer thickness
 $H$ is the relevant length scale in planar shear flow with gravity and affects the characteristic size of the flowing region beneath the top wall. We have verified that all dimensions of the simulation domain
 $\{H=50 \bar {d}_0, L = 20\bar {d}_0, W = 10\bar {d}_0\}$ are sufficiently large, so that they do not affect the flow fields or the segregation dynamics.
The important dimensionless parameters that describe planar shear flow with gravity are (1)  ${\ell }/{\bar {d}_0}=P_{w}/\phi \rho _{s}G\bar {d}_0$, the dimensionless loading length scale; (2)
 $\tilde {v}_{w}=({v_{w}}/{\ell }) \sqrt {{\rho _{s} \bar {d}_0^2}/{P_{w}}}$, the dimensionless top-wall velocity that determines shear stress
 $\tau _{w}$ and the stress ratio
 $\mu _{w}$ at the top wall; (3)
 $c^{l}_0(z)$, the initial large-grain concentration field; and (4)
 $d^{l}/d^{s}$, the bidisperse grain-size ratio. Thus, the parameter set
 $\{\ell /\bar {d}_0, \tilde {v}_{w}, c^{l}_0, d^{l}/d^{s}\}$ fully specifies a given case of planar shear flow with gravity. We consider a representative base case for spheres corresponding to the parameter set
 $\{\ell /\bar {d}_0=18,\tilde {v}_{w}=0.02, c^{l}_0=0.50, d^{l}/d^{s} = 1.5\}$. In this flow configuration the strain rate is greatest just under the top wall, where the pressure is lowest. Therefore, the shear-strain-rate-gradient-driven flux and the pressure-gradient-driven flux cooperate and drive large grains towards the top of the layer. The segregated state after running the base-case DEM simulation to a time of
 $\tilde {t} = t/(\ell /v_{w}) = 600$ is shown in figure 5(b), illustrating that the large grains (dark grey) indeed segregate towards the top wall, leaving a small-grain-rich region (light grey) underneath. Further away from the wall, the evolution of segregation is very slow due to the low strain rates in that region, and the bidisperse granular material remains well mixed. For a more quantitative picture, we coarse grain the concentration field
 $c^{l}$ in both space and time, and the spatiotemporal evolution of
 $c^{l}$ is shown in the contour plot in figure 5(c). Lastly, snapshots of the
 $c^{l}$ field and the non-dimensionalized velocity field
 $v_x/v_{w}$ at three different times –
 $\tilde {t} = 10, 100$ and
 $600$ – are shown in figures 5(d) and 5(e), respectively. Again, we observe that the velocity field quickly reaches a steady state, while the concentration field evolves over the full simulation time window.
Next, we solve the coupled continuum model for the transient evolution of the concentration and velocity fields in this geometry, following a process analogous to that described in § 4.1 for inclined plane flow. To control for the effects of normal stress differences in dense flows of spheres, the pressure at the top wall  $P(z=0)$ and the slope of the pressure field are obtained from the coarse-grained pressure field in the DEM data for each case. These values are slightly different than the nominal values of
 $P_{w}$ and
 $\phi \rho _{s}G$ and give rise to a slightly adjusted value of the loading length scale, and we utilize these adjusted values in the stress fields,
 $\mu (z)$ and
 $P(z)$, in our continuum simulations. The governing equations are the flow rule (4.2), the non-local rheology (4.3) and the segregation dynamics equation (4.4), wherein
 $\mu (z)$ and
 $P(z)$ are given as inputs to the model. For the boundary conditions, we impose Dirichlet fluidity boundary conditions at both the top and bottom walls, i.e.
 $g=g_{loc}(\mu (z=0),P(z=0))$ at
 $z=0$ and
 $g=g_{loc}(\mu (z=H),P(z=H))$ at
 $z=H$, and no-flux boundary conditions at the top and bottom walls, i.e.
 $w^{l}_z=0$ at
 $z=0$ and
 $z=H$. The initial concentration field
 $c^{l}_0(z)$ is extracted from the initial DEM configuration for each case, and we use the same finite-difference-based numerical approach described above for inclined plane flow. Finally, since
 $v_{w}$ is prescribed in the DEM simulations of planar shear flow with gravity, while
 $\mu _{w}$ is specified in the corresponding continuum simulations, we iteratively adjust the value of
 $\mu _{w}$ input into the continuum simulations to match the target value of
 $v_{w}$ in the predicted steady-state velocity field.
We compare continuum model predictions against corresponding DEM simulation results for bidisperse spheres using the parameter set given in (4.1). To broadly exercise the model, we consider four different cases of planar shear flow with gravity: (1) the base case  $\{\ell /\bar {d}_0=18,\,\tilde {v}_{w}=0.02, \, c^{l}_0=0.50, \, d^{l}/d^{s} = 1.5\}$; (2) a more large grains case
 $\{\ell /\bar {d}_0=18, \tilde {v}_{w}=0.02, \, c^{l}_0=0.75, \, d^{l}/d^{s} = 1.5\}$; (3) a larger loading length scale and lower top-wall velocity case
 $\{\ell /\bar {d}_0=36,\,\tilde {v}_{w}=0.01 c^{l}_0=0.50, \, d^{l}/d^{s} = 1.5\}$; and (4) a lower top-wall velocity case
 $\{\ell /\bar {d}_0=18,\,\tilde {v}_{w}=0.01 \, c^{l}_0=0.50, \, d^{l}/d^{s} = 1.5\}$, and results for these cases are shown in figures 6(a,b) and 7(a,b), respectively. The first columns show the spatiotemporal evolution of the concentration field
 $c^{l}$ measured from the DEM simulations. In the second columns, we compare snapshots of the concentration field
 $c^{l}$ predicted by the continuum model (dashed grey lines) with the corresponding coarse-grained DEM fields (solid black lines) at four different time instants –
 $\tilde {t} = t/(\ell /v_{w}) = 20, 100, 300$ and
 $600$ in figure 6 and
 $\tilde {t} = 10, 50, 150$ and
 $300$ in figure 7 – as indicated by the vertical lines on the contour plots in the first columns for each case. Finally, the steady-state normalized velocity fields (corresponding to the last time instant listed above for each case) obtained from DEM simulations and the corresponding continuum model predictions are shown in the last columns of figures 6 and 7. The continuum model is able to capture the decaying velocity fields in all cases as well as predict the transient evolution of the segregation process. A similar quality of comparison was observed in analogous tests for dense, bidisperse disks in several cases of planar shear flow with gravity.
Comparisons of continuum model predictions with corresponding DEM simulation results for the transient evolution of the segregation dynamics for two cases of planar shear flow with gravity of bidisperse spheres: (a) base case  $\{\ell /\bar {d}_0=18, \tilde {v}_{w}=0.02, c^{l}_0=0.50, d^{l}/d^{s} = 1.5\}$ and (b) more large grains case
 $\{\ell /\bar {d}_0=18, \tilde {v}_{w}=0.02, c^{l}_0=0.75, d^{l}/d^{s} = 1.5\}$. For each case, plots (a i,b i) show spatiotemporal contours of the evolution of
 $c^{l}$ measured in DEM simulations. Plots (a ii–v,b ii–v) show comparisons of the DEM simulations (solid black lines) and continuum model predictions (dashed grey lines) of the
 $c^{l}$ field at four different time instants during the segregation process:
 $\tilde {t} = t/(\ell /v_{w}) = 20, 100, 300$ and
 $600$ in the sequence of (a ii,b ii), (a iii,b iii), (a iv,b iv), (a v,b v). Plots (a vi,b vi) show comparisons of the steady-state, normalized velocity profiles at
 $\tilde {t}=600$ from DEM simulations and continuum model predictions.

Comparisons of continuum model predictions with corresponding DEM simulation results for the transient evolution of the segregation dynamics for two cases of planar shear flow with gravity of bidisperse spheres: (a) larger loading length scale and lower top-wall velocity case  $\{\ell /\bar {d}_0=36,\tilde {v}_{w}=0.01, c^{l}_0=0.50, d^{l}/d^{s} = 1.5\}$ and (b) lower top-wall velocity case
 $\{\ell /\bar {d}_0=18, \tilde {v}_{w}=0.01, c^{l}_0=0.50, d^{l}/d^{s} = 1.5\}$. Results are organized as described in the caption of figure 6. The time instants shown in (a ii–v,b ii–v) correspond to
 $\tilde {t} = 10, 50, 150$ and
 $300$, and the time instant shown in (a vi,b vi) corresponds to
 $\tilde {t}=300$.

At this stage, it is instructive to contrast features of planar shear flow with gravity with inclined plane flow to emphasize why this flow configuration represents a non-trivial validation test for a coupled model for size segregation and flow. At a high level, planar shear flow with gravity is boundary driven, while inclined plane flow is gravity driven. This difference in the manner in which flow is driven manifests in stark differences in the consequent flow fields. Namely, the Bagnold-like profile of inclined plane flow involves only modest strain-rate gradients, leading to segregation phenomenology that is dominated by pressure gradients. Moreover, the rheological behaviour of a dense granular medium in inclined plane flow is dominated by local grain-inertia effects that are captured by the local inertial, or  $\mu (I)$, rheology. This is in contrast to planar shear flow with gravity, in which the flow fields decay rapidly with the distance from the moving, top wall. While local grain-inertia effects contribute in the flowing region under the top wall, non-local, cooperative effects also contribute and become increasingly dominant with the distance from the top wall, as the flow field transitions into the quasi-static, creeping region. Therefore, utilizing a non-local rheology, such as the generalized NGF model for bidisperse flows, is crucial to accurately capture the velocity fields in planar shear flow with gravity. It is also notable that the magnitudes of the strain-rate gradients are comparatively greater in planar shear flow with gravity than in inclined plane flow, and the comparative contributions of the two mechanisms of segregation, i.e. pressure gradients and shear-strain-rate gradients, are unclear. We return to this point in § 5. Due to the distinctly different flow fields and the relative directions of the two segregation fluxes, i.e. competitive versus cooperative, inclined plane flow and planar shear flow with gravity represent markedly different flow configurations, so the observation that the coupled continuum model is capable of capturing segregation dynamics and flow fields in both configurations with a single set of parameters is encouraging.
5. Discussion
A natural question is whether it is essential to account for both pressure-gradient-driven segregation and shear-strain-rate-gradient-driven segregation in (2.3) to capture the dynamics of the large-grain concentration field in both inclined plane flow and planar shear flow with gravity using a single set of material parameters. To address this question, we first suppress the flux associated with shear-strain-rate gradients by taking  $C^{S}_{seg} = 0$ and test whether the pressure-gradient-driven flux is sufficient to capture the segregation dynamics on its own. We start by re-estimating the parameter
 $C^{P}_{seg}$ for the situation when
 $C^{S}_{seg} = 0$. We return to the steady-state DEM field data for the four cases of inclined plane flow of spheres described in § 3, and as suggested by (3.1), we plot
 $-C_{diff}\bar {d}^2\dot \gamma (\partial c^{l}/\partial z)$ vs
 $({\bar {d}^2 \dot {\gamma }}/{P}) c^{l}(1-c^{l})(1 - \alpha + \alpha c^{l}) ({\partial P}/{\partial z})$ for
 $\alpha =0.4$ in figure 8(a), where each data point represents a unique
 $z$ position. It is evident that the collapse of the data is not as strong in figure 8(a) as it is in figure 2(a), where the shear-strain-rate-gradient-driven flux is included. Nevertheless, a linear trend is observed, and we re-estimate
 $C^{P}_{seg} = 0. 22$ from the slope of the best linear fit shown in figure 8(a). This value is lower than the previously determined value of
 $0.34$ due to the omission of the shear-strain-rate-gradient-driven flux, which acts in the opposite direction of the pressure-gradient-driven flux in inclined plane flow. Next, we test continuum model predictions of the transient evolution of the
 $c^{l}$ field for the base case of inclined plane flow of spheres due to the pressure-gradient-driven flux solely, i.e. using
 $C^{S}_{seg} = 0$ and
 $C^{P}_{seg} = 0. 22$. Otherwise, the solution procedure is the same as described in § 4.1. The results are shown in figure 8(b) for the
 $c^{l}$ field at four different time instants during the segregation process, where solid black lines represent the DEM simulations and dashed grey lines represent the continuum model predictions. The comparisons look reasonable in spite of not accounting for the shear-strain-rate-gradient-driven flux and are comparable to the results shown in figure 3(a) for the same case when both flux contributions are included. This confirms that the pressure-gradient-driven flux is dominant in inclined plane flow but might lead one to believe that the shear-strain-rate-gradient-driven flux is always negligible when pressure gradients are present. Therefore, we return to the base case of planar shear flow with gravity of spheres and calculate predictions of the continuum model for the transient evolution of the
 $c^{l}$ field using
 $C^{S}_{seg} = 0$ and
 $C^{P}_{seg} = 0. 22$. The results are shown in figure 8(c) for four time instants during the segregation process, and for these parameters, the continuum model underpredicts the extent of segregation when compared with the results of figure 6(a) when both flux contributions are included. Therefore, in planar shear flow with gravity, pressure-gradient-driven segregation is a secondary effect with the segregation process being primarily driven by shear-strain-rate gradients, and it is not possible to capture the segregation dynamics in both flow configurations when neglecting the shear-strain-rate-gradient-driven flux.
(a) Collapse of  $-C_{diff} \bar {d}^2\dot {\gamma } ({\partial c^{l}}/{\partial z})$ vs
 $({\bar {d}^2 \dot {\gamma }}/{P}) c^{l}(1-c^{l})(1 - \alpha + \alpha c^{l}) ({\partial P}/{\partial z})$ for several cases of inclined plane flow of bidisperse spheres. Symbols represent coarse-grained, steady-state DEM field data, and the solid line is the best linear fit using
 $C^{P}_{seg} = 0.22$. Comparisons of continuum model predictions with corresponding DEM simulation results for the
 $c^{l}$ field at four different time instants during the segregation process for (b) the base case of inclined plane flow of spheres and (c) the base case of planar shear flow with gravity of spheres but taking
 $C^{S}_{seg}=0$ and
 $C^{P}_{seg} = 0.22$ in the continuum model. Solid black lines represent the DEM simulations and dashed grey lines represent the continuum model predictions.

On the other hand, it is also worth considering the scenario in which the pressure-gradient-driven flux is neglected, i.e.  $C^{P}_{seg} = 0$. In this situation, we do not re-estimate
 $C^{S}_{seg}$ since it has been independently determined in isolation in our prior work (Liu et al. Reference Liu, Singh and Henann2023). As discussed in § 3, in inclined plane flow the strain rate is greatest at the bottom of the layer, so the shear-strain-rate-gradient-driven flux drives the large grains towards the bottom of the layer. Therefore, neglecting the pressure-gradient-driven flux would lead to the model predicting that segregation evolves in the opposite direction from what is observed in DEM simulations. We also consider planar shear flow with gravity in the absence of the pressure-gradient-driven flux and revisit the base case for spheres. Results for four time instants during the segregation process are shown in figure 9, using
 $C^{S}_{seg}=0.08$ and
 $C^{P}_{seg} = 0$ in the continuum model. The comparisons appear reasonable, but the predictions of the model still lag behind the corresponding DEM results. Comparing the continuum model predictions in figure 9 with those in figure 6(a), it is evident that accounting for both driving mechanisms results in the most accurate predictions. In conclusion, although the shear-strain-rate-gradient-driven flux is the primary driver in planar shear flow with gravity, both mechanisms should be included to accurately capture the segregation dynamics, and more broadly, it is crucial to account for both mechanisms to capture segregation dynamics across different flow geometries with a single set of parameters.
Comparisons of continuum model predictions with corresponding DEM simulation results for the base case of planar shear flow with gravity of spheres but taking  $C^{S}_{seg}=0.08$ and
 $C^{P}_{seg} = 0$ in the continuum model. Solid black lines represent the DEM simulations and dashed grey lines represent the continuum model predictions.

6. Concluding remarks
In this paper we studied coupled flow and size segregation in dense, bidisperse granular systems of frictional spheres and disks in scenarios when both pressure gradients and shear-strain-rate gradients are present, and we developed a phenomenological continuum model that can simultaneously capture the segregation dynamics and velocity fields. The continuum model integrates a constitutive equation for the pressure-gradient-driven segregation flux, based on the works of Gajjar & Gray (Reference Gajjar and Gray2014) and Trewhela et al. (Reference Trewhela, Ancey and Gray2021), with the coupled model for size segregation and flow in the absence of pressure gradients developed in our prior work (Liu et al. Reference Liu, Singh and Henann2023). The complete, coupled model for bidisperse granular systems accounts for pressure-gradient-driven and shear-strain-rate-gradient-driven segregation fluxes, granular diffusion and non-local rheological behaviour and is intended to be applied to dense flows spanning the quasi-static and dense inertial flow regimes  $(I\lesssim 10^{-1})$. The segregation model involves four dimensionless material parameters
 $\{C_{diff}, C^{S}_{seg}, C^{P}_{seg},\alpha \}$ and the parameters associated with the pressure-gradient-driven flux
 $\{C^{P}_{seg},\alpha \}$ were determined in this work for both frictional spheres and disks with a size ratio of
 $d^{l}/d^{s}=1.5$, based on steady-state DEM data in inclined plane flow. The coupled model has been tested in two flow configurations involving pressure gradients – namely, inclined plane flow and planar shear with gravity flow – and the coupled continuum model does an excellent job capturing the transient evolution of the segregation fields as well as the steady-state velocity fields across several variants of both flow configurations, using one set of parameters for spheres and another for disks.
There remain a number of important directions for future work – several of which are highlighted here. First, in this paper we focused on bidisperse granular systems with a single grain-size ratio,  $d^{l}/d^{s}=1.5$, and a uniform grain-material mass density
 $\rho _{s}$. Many works in the literature (e.g. Schlick et al. Reference Schlick, Fan, Isner, Umbanhowar, Ottino and Lueptow2015; Tunuguntla et al. Reference Tunuguntla, Weinhart and Thornton2017; Trewhela et al. Reference Trewhela, Ancey and Gray2021) have shown that the rate of pressure-gradient-driven size segregation depends on the grain-size ratio. We have corroborated this with several of our own tests, in which steady-state DEM field data from inclined plane flow of bidisperse granular systems with grain-size ratios not equal to 1.5 do not collapse with the data of figure 2. These observations indicate that the constitutive equation for the pressure-gradient-driven segregation flux (2.6) needs to be generalized to account for dependence on
 $d^{l}/d^{s}$, and we expect that the explicit dependence determined in Trewhela et al. (Reference Trewhela, Ancey and Gray2021) may be leveraged to this end. We note that this dependence of the pressure-gradient-driven segregation flux on the grain-size ratio is in contrast to the shear-strain-rate-gradient-driven segregation flux, where we did not observe grain-size-ratio dependence over a similar range of modest grain-size ratios (Liu et al. Reference Liu, Singh and Henann2023). Moreover, dense granular mixtures may be polydisperse (e.g. Gray & Ancey Reference Gray and Ancey2011; Marks et al. Reference Marks, Rognon and Einav2012; Schlick et al. Reference Schlick, Isner, Freireich, Fan, Umbanhowar, Ottino and Lueptow2016) or consist of grains with different mass densities in addition to varied sizes (e.g. Tripathi & Khakhar Reference Tripathi and Khakhar2013; Xiao et al. Reference Xiao, Umbanhowar, Ottino and Lueptow2016). Therefore, two potential avenues for future research are to extend the present work to account for polydisperse particle distributions and to incorporate density-based segregation in addition to size-based segregation.
Second, the flow geometries considered in this paper result in planar, shearing flows, in which pressure gradients and velocity gradients are aligned, and the predictive capacity of the coupled continuum model has only been tested in such scenarios. In many flows, e.g. annular shear flow with gravity, pressure gradients act perpendicular to the plane of shearing, and it remains to test whether the flux constitutive equations utilized in this paper continue to be predictive in such scenarios or require modification. To this end, a robust numerical toolkit needs to be developed to solve the coupled system of governing equations in more complex flow geometries, where the stress field cannot be straightforwardly deduced. Both of these points will be addressed in future works.
Funding
This work was supported by funds from the National Science Foundation (CBET-1552556).
Declaration of interests
The authors report no conflict of interest.
Appendix A. Rheological constitutive equations
A.1. Local inertial rheology
First, we summarize the generalization of the local inertial rheology for a dense, bidisperse system of dry, stiff grains with average grain diameter  $\bar {d}$ (defined in § 2.1) and grain-material mass density
 $\rho _{s}$, as introduced in Rognon et al. (Reference Rognon, Roux, Naaïm and Chevoir2007) and Tripathi & Khakhar (Reference Tripathi and Khakhar2011). The local inertial rheology relates the stress ratio
 $\mu$, the equivalent shear-strain rate
 $\dot \gamma$ and the pressure
 $P$ (each of which are tensor invariant quantities defined in either §§ 2.2 or 2.4) through the dimensionless relationship
 $\mu = \mu _{loc}(I)$, where
 $I = \dot {\gamma }\sqrt {\bar {d}^2 \rho _{s} / P}$ is the inertial number. In this work we utilize the following nonlinear functional form of Jop et al. (Reference Jop, Forterre and Pouliquen2005) for dense systems of bidisperse spheres:
 \begin{equation} \mu_{loc}(I) = \mu_{s} + \frac{\mu_2 - \mu_{s}}{I_0/I +1}. \end{equation}
Here  $\mu _{s}$ is the stress ratio corresponding to the static yield condition,
 $\mu _2$ corresponds to the stress ratio in the limit
 $I \to \infty$ and
 $I_0$ is a dimensionless parameter that characterizes the nonlinear, rate-dependent response. The rheological material parameters for dense, frictional spheres have been determined from DEM simulations to be
 $\{\mu _{s}=0.37, \mu _2=0.95, I_0=0.58\}$ for the monodisperse case (Zhang & Kamrin Reference Zhang and Kamrin2017; Liu et al. Reference Liu, Singh and Henann2023), and as discussed in Liu et al. (Reference Liu, Singh and Henann2023), the parameters may continue to be used to describe the rheology of dense, frictional spheres in the bidisperse case.
A.2. Non-local granular fluidity model
While the local inertial rheology can capture homogeneous flows well, it fails to capture many aspects of flow fields with spatial inhomogeneity. In order to capture inhomogeneous flows and account for size-dependent effects, several non-local models have been developed (Kamrin Reference Kamrin2019). In this work we utilize the NGF model that has been developed and broadly tested for dense, monodisperse granular systems (e.g. Kamrin & Koval Reference Kamrin and Koval2012; Henann & Kamrin Reference Henann and Kamrin2013) and recently extended to dense, bidisperse granular systems (Liu et al. Reference Liu, Singh and Henann2023). The model is summarized as follows. A positive, scalar field quantity – called the granular fluidity  $g$ – is introduced, which relates the stress state to the strain rate by means of two constitutive equations. First, the flow rule relates the Cauchy stress tensor
 $\sigma _{ij}$, the strain-rate tensor
 ${\mathsf{D}}_{ij}$ and the granular fluidity
 $g$ through
 $\sigma _{ij} = -P\delta _{ij} + 2({P}/{g}){\mathsf{D}}_{ij}$. Taking the magnitude of the deviatoric part of the flow rule and rearranging gives the scalar form of the flow rule,
 \begin{equation} \dot{\gamma} = g \mu, \end{equation}
which is the form that we utilize in § 4. Second, the granular fluidity field  $g$ is governed by the non-local rheology
 \begin{equation} g = g_{loc} (\mu, P) + \xi^2(\mu) \frac{\partial^2 g}{\partial x_i \partial x_i}, \end{equation}
where  $g_{loc}(\mu,P)$ is the local fluidity function and
 $\xi (\mu )$ is the stress-dependent cooperativity length. Using the functional form of the local inertial rheology given in (A1) and the definition of the inertial number for bidisperse systems leads to the following local fluidity function for the case of dense, bidisperse spheres:
 \begin{equation} g_{loc}(\mu,P) = \left\{ \begin{array}{ll} I_0 \sqrt{\dfrac{P}{\bar{d}^2\rho_{s}}} \dfrac{(\mu-\mu_{s})}{\mu (\mu_2 - \mu)} & {\rm if}\ \mu>\mu_{s},\\ 0 & {\rm if}\ \mu\le\mu_{s}.\end{array}\right. \end{equation}
Finally, the functional form for the cooperativity length is
 \begin{equation} \xi(\mu) = A\bar{d}\sqrt{\frac{(\mu_2 - \mu)}{(\mu_2 - \mu_{s})|\mu - \mu_{{s}}|}}, \end{equation}
where  $A$ is a dimensionless parameter called the non-local amplitude. For both monodisperse and bidisperse systems, the non-local amplitude has been determined from DEM simulations to be
 $A=0.43$ for dense, frictional spheres (Zhang & Kamrin Reference Zhang and Kamrin2017; Liu et al. Reference Liu, Singh and Henann2023).
Appendix B. Discrete element method simulations and averaging methods
B.1. Simulated granular systems
As described in Liu et al. (Reference Liu, Singh and Henann2023), we consider three-dimensional granular systems consisting of dense, bidisperse mixtures of spheres and two-dimensional granular systems consisting of dense, bidisperse mixtures of disks. For both spheres and disks, the grain-size ratio  $d^{l}/d^{s} = 1.5$ is held fixed throughout, and a polydispersity of
 ${\pm }10\,\%$ is applied to the respective mean diameters of both species. The model for the grain–grain interaction force is given through a contact law that accounts for Hookean elasticity, damping and sliding friction (Silbert et al. Reference Silbert, Ertaş, Grest, Halsey, Levine and Plimpton2001). The details of this contact law are not repeated here, but we highlight the parameters that fully describe the interaction properties: (1)
 $k_{n}$ the normal contact stiffness, (2)
 $k_{t}$ the tangential contact stiffness, (3) the coefficient of restitution for binary collisions
 $e$, and (4) the inter-particle friction coefficient
 $\mu _{surf}$. The normal contact stiffness is taken to be sufficiently large compared with the characteristic confining pressure, so that the grains are nearly rigid, i.e.
 $k_{n}/P\bar {d}_0 > 10^4$ for spheres. We take
 $k_{t}/ k_{n}=1/2$,
 $e=0.1$ and
 $\mu _{surf}=0.4$ throughout. Lastly, numerical integration of the equations of motion for each grain is performed using the open-source software LAMMPS (Plimpton Reference Plimpton1995), and the time step for numerical integration is chosen to be sufficiently small, compared with the binary collision time, to ensure stable and accurate simulation results.
B.2. Averaging methods
We utilize a bin-based approach for spatial averaging of a given snapshot of DEM data at time  $t$, which is described here for the case of spheres in three dimensions. Consider a rectangular-cuboidal bin of width
 $\varDelta$, centred at a position
 $z$ and spanning the simulation domain along the
 $x$ and
 $y$ directions. At time
 $t$, we assign each grain
 $i$ intersected by the bin a weight
 $V_i$, which is equal to the volume of grain
 $i$ inside the bin. We denote the sets of large and small grains intersected by the bin as
 ${\mathcal {F}}^{l}$ and
 ${\mathcal {F}}^{s}$, respectively (Tunuguntla, Thornton & Weinhart Reference Tunuguntla, Thornton and Weinhart2016). The instantaneous solid volume fraction field for species
 $\nu = {l},{s}$ is
 $\phi ^{\nu }(z,t) = (\sum _{i \in {\mathcal {F}}^\nu } V_i)/V$, where
 $V$ is the total volume of the bin, and the concentration field for species
 $\nu$ is
 $c^{\nu }(z,t) = \phi ^{\nu }(z,t)/(\phi ^{l}(z,t)+\phi ^{s}(z,t))$. The instantaneous velocity field of the mixture at position
 $z$ and time
 $t$ is
 $\boldsymbol {v}(z,t) = ({\sum }_{i \in {\mathcal {F}}} V_i\boldsymbol {v}_i(t))/({\sum }_{i \in {\mathcal {F}}} V_i)$, where
 $\boldsymbol {v}_i(t)$ is the instantaneous velocity of each grain
 $i$ and
 ${\mathcal {F}} = {\mathcal {F}}^{l}\cup {\mathcal {F}}^{s}$. The instantaneous stress tensor associated with each grain
 $i$ is
 $\boldsymbol {\sigma }_i(t) = (\sum _{j\ne i} \boldsymbol {r}_{ij}\otimes \boldsymbol {f}_{ij})/({\rm \pi} d_i^3/6)$, where
 $\boldsymbol {r}_{ij}$ is the position vector from the centre of grain
 $i$ to the centre of grain
 $j$,
 $\boldsymbol {f}_{ij}$ is the contact force applied on grain
 $i$ by grain
 $j$ and
 $d_i$ is the diameter of grain
 $i$. The instantaneous stress field of the mixture at position
 $z$ and time
 $t$ is then
 $\boldsymbol {\sigma }(z,t) = (\sum _{i \in {\mathcal {F}}} V_i\boldsymbol {\sigma }_i(t))/V$. Throughout, as in Liu et al. (Reference Liu, Singh and Henann2023), we take a bin width of
 $\varDelta = 4 \bar {d}_0$ and a spatial resolution of about
 $0.1 \bar {d}_0$. One exception is for the velocity fields in planar shear flow with gravity, where we use a slice-based approach, i.e.
 $\varDelta \to 0$. This is done to control for any small amount of wall slip and precisely estimate the velocity of the first layer of flowing grains beneath the top wall in the DEM simulations, which then corresponds to the velocity
 $v_{w}$ quoted for each case in § 4.2 and matched in the corresponding continuum simulations. For the steady state collapses of figure 2, we truncate DEM data from bins centred within about
 $6\bar {d}_0$ of the boundaries to eliminate any potential boundary effects. When calculating the quantities appearing in the collapses of figure 2, the instantaneous fields are spatially smoothed and differentiated using a kernel function. To obtain the relevant steady-state field quantities in (3.1), we consider a time window within the steady-state regime and generate
 $N=1000$ snapshots of the instantaneous, smoothed fields and arithmetically average these fields over all snapshots to obtain fields that only depend on the spatial coordinate.


 Open access

