Introduction
The developmental origins of hypertension have been studied extensively.Reference Barker, Osmond, Golding, Kuh and Wadsworth 1 – Reference Lenfant 4 A small body size at birth, an indicator of a suboptimal intrauterine environment, is inversely associated with adult blood pressure. Some studies indicate that this association amplifies with age.Reference Davies, Smith, May and Ben-Shlomo 5 , Reference Chen, Srinivasan and Berenson 6 Furthermore, several studies have reported that rapid growth during childhood increases the risk of hypertension.Reference Huxley, Shiell and Law 7 – Reference Adair, Fall and Osmond 16 Findings from a previous study from the Helsinki Birth Cohort Study (HBCS) suggest that more than one distinct childhood growth pattern could be associated with later hypertension.Reference Eriksson, Forsén, Kajantie, Osmond and Barker 8
To our knowledge, there have been no studies exploring whether the association between childhood growth and adult hypertension amplifies with age. We have recently demonstrated that a faster than expected linear growth during early childhood was associated with lower adult body fat percentage, whereas the opposite was true for relative weight gain (weight gain independent of linear growth) after age 11 years.Reference Sandboge 17 The importance of a beneficial body composition, from early life through adulthood, might become more apparent with increasing age. In other words, a beneficial early growth might protect against, or at least delay, the development of non-communicable chronic diseases including hypertension.
We created conditional growth variables for linear growth as well as relative weight gain for four age ranges: birth to 6 months, 6 months to 2 years, 2–11 years and 11 years to adulthood and assessed their association with adult blood pressure and hypertension at mean ages 61.5 and 66.4 years, in 1036 individuals from the HBCS. Mean time between visits was 4.9 years (s.d. 0.8 years). Our aim was to assess whether the association between early growth and blood pressure amplifies with age. Due to the nature of amplification, we hypothesized that two time points of observation might be sufficient, as the subjects were studied during late adult life.
Methods
The HBCS consists of 13,345 singletons born in Helsinki in 1934–1944 who were alive in 1971 when all residents of Finland received a unique personal identification number. 8760 of the individuals were born in the Helsinki University Central Hospital and of these, 2902 were invited to participate in a clinical examination. The original clinical study (clinic visit 1) took place in 2001–2004 and 2003 of the invited individuals participated.Reference Ylihärsilä, Kajantie, Osmond, Forsén, Barker and Eriksson 18 A follow-up study (clinic visit 2) with 1083 participants was conducted in 2006–2008, focussing on individuals without type 2 diabetes at the time of the original study. The intent of the follow-up study was to recruit at least 1000 individuals living within 100 km of Helsinki. Diabetes diagnosis was based upon laboratory tests, self-reporting, and use of diabetes medication. Compared to the study population, the excluded individuals were heavier and had higher levels of blood pressure and fasting glucose. A larger proportion of them used antihypertensive medication. These differences are described in Supplemental Table S1.
A detailed set of birth, child welfare, and school health records were available for the participants, including an average of 18 weight and height measurements between birth and 12 years of age.Reference Barker, Forsén, Eriksson and Osmond 19 , Reference Osmond, Kajantie, Forsén, Eriksson and Barker 20 The birth records additionally included information on maternal age, height, weight, parity, and last menstrual period. The records have been described elsewhere in detail.Reference Osmond, Kajantie, Forsén, Eriksson and Barker 20 The participants’ highest attained socioeconomic status (SES) was derived from census data gathered every 5th year between 1970 and 2000. This information was obtained from Statistics Finland. Childhood SES was based on the fathers’ highest level of occupation, derived from birth, child welfare clinic and school health records.
During both clinic visits, at mean ages 61.5 and 66.4 years, respectively, weight was measured to the nearest 0.1 kg and height to the nearest 0.1 cm. Blood pressure was measured using a standard sphygmomanometer from the right arm with the participant in sitting position, and was recorded as the mean of two subsequent measurements. Hypertension was defined as a systolic blood pressure (SBP)⩾140 mmHg and/or a diastolic blood pressure (DBP)⩾90 mmHg and/or current use of antihypertensive medication according to either register data of reimbursement or questionnaire information. All measurements were performed by trained study nurses.
A questionnaire was used to obtain information on current medication, medical history, smoking, and leisure-time physical activity. Those who exercised at least moderately, defined as brisk walking or comparable activity, three times weekly or more often, were defined as physically active. Information on smoking status and physical activity was collected at the first clinic visit. Daily sodium intake was derived from a validated food frequency questionnaires, which the participants completed at both clinic visits. This study includes 1036 individuals who participated in the 2001–2004 clinical study as well as in a follow-up in 2006–2008 for whom weight and height measurements were available for birth, 6 months, 2 years and 11 years. Individuals both with and without current antihypertensive medication were included in the study, in order to retain the same study population in the analyses of both study visits.
Statistical methods
Individual height and weight measurements were converted to z scores (s.d. scores) representing the number of standard deviations the observed measurement differed from the mean of the whole cohort (n=13,345). Z scores were obtained by interpolation as measurements were not performed exactly on the children’s birthdays. Conditional size measures were then calculated by regressing current size (as represented by the z scores) on previous size measures. Conditional relative weight represents current weight accounting for previous height and weight as well as current height. Conditional height is current height accounting for previous height and weight. The conditional variables represent how much an individual’s body size at a certain age differs from what would be expected based on the individual’s previous body size as well as the growth of the cohort’s other participants. For example, a negative conditional height or weight variable represents a slower than expected linear growth or relative weight gain. The variables are statistically independent from each other and can therefore be entered side by side into the same regression model. The methodology has been described elsewhere in greater detail.Reference Adair, Fall and Osmond 16 The following intervals were included in the analysis: birth to 6 months, 6 months to 2 years, 2 years to 11 years and 11 years to adulthood. The first three intervals were chosen to reflect early infancy, late infancy and childhood. Adult weight and height at the first and second visit were used for the first and second visit models, respectively. We additionally calculated conditional relative birth weight by conditioning birth weight on birth length.
The associations between childhood growth and adult SBP, at first and second visit respectively, were analysed using multiple linear regression. All conditional growth variables were entered into the models along with birth length (expressed as s.d. score), conditional relative birth weight, sex, age, childhood SES (ordinal, three levels), daily sodium intake in grams (logged due to skewedness), and current antihypertensive medication (no/yes). The analysis of the associations with SBP at second visit was performed both without and with SBP at mean age 61.5 years as a covariate, the latter to explore whether the conditional growth measurements predicted later SBP independent of previous SBP. The first and second clinic visit models included 1023 subjects, and 1016 subjects, respectively. The reduced number of subjects included was due to missing information on childhood SES (n=7), and sodium intake (n=6 at first visit, n=13 at second visit), respectively. We also considered including attained adult SES, gestational age, exercise frequency, and smoking status as covariates but none of these were significant predictors of SBP. As the effect sizes of the variables of interest were only marginally affected by adding these additional covariates, and data on smoking and physical activity were missing from the second clinic visit, we decided to exclude all of the above from the analysis. Linear regression analyses were additionally performed with DBP as outcome variable.
We also created logistic regression models with hypertension at first and second visit, respectively, as outcome variables. We included the same covariates as for the linear models, save for current antihypertensive medication as this was part of the outcome. For the second visit model, we compared a full model including SBP and DBP at first visit as covariates with a model without them. The significance level for the omnibus test for the full model was 0.03 and hence these were retained as covariates. All subjects were included in the first visit model. The second visit logistic regression model included 311 subjects who were without antihypertensive medication and additionally normotensive at the time of the first clinic visit.
Results
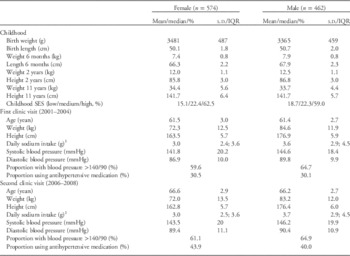
The study population is described in Table 1. Mean age at first and second visit was 61.5 (s.d. 2.9) and 66.4 (s.d. 2.8) years, respectively. In all, 30.3% of the participants were using antihypertensive medication at the time of the first clinic visit. The corresponding number at the second clinic visit was 42.2%. The proportion of individuals with blood pressure within the hypertensive range was 61.9 and 62.8%, respectively, at the first and second clinic visit.
Characteristics of study participants (n 1036)

1 Median and interquartile range presented due to skewedness.
Conditional relative weight gain and adult blood pressure
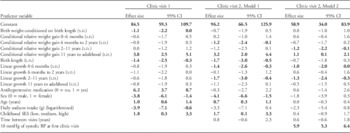
Conditional relative weight gain between ages 2 and 11 years was inversely associated with SBP at mean age 66.4 years in the full model, including adjustment for SBP at mean age 61.5 years (Table 2). A one s.d. increase in conditional relative weight at 11 years was associated with 1.2 mmHg (95% CI: 0.1, 2.2) lower adult SBP. Conditional relative weight gain after age 11 years was positively associated with SBP in all models (Table 2). The most prominent association was found between SBP and conditional relative weight at mean age 61.5 years, where a one s.d. increase of adult conditional relative weight was associated with 3.8 mmHg (95% CI: 2.5, 5.1) higher SBP.
Estimated change in systolic blood pressure per unit predictor variable

CI, confidence interval; SES, socioeconomic status; BP, blood pressure.
Each linear regression model, as represented by the ‘clinic visit 1’, ‘clinic visit 2, model 1’, and ‘clinic visit 2, model 2’ columns includes all covariates in the ‘predictor variable’ column up until ‘Childhood SES’. ‘Clinic visit 2, model 1’ additionally includes time between visits in years and ‘clinic visit 2, model 2’ additionally includes 10 mmHg of systolic BP at first clinic visit as covariates. All predictor variables in each model entered simultaneously. Significant associations at 0.05 level bolded for clarity.
Linear growth and adult blood pressure
None of the conditional height variables included in the analysis were associated with SBP at mean age 61.5 years (Table 2). Linear growth between birth and 6 months and between 2 and 11 years, however, were inversely associated with SBP at mean age 66.4 years, both with and without adjustment for SBP at mean age 61.5 years. For example, a one s.d. increase of conditional height at 11 years was associated with 1.3 mmHg (95% CI: 0.3, 2.4) lower SBP in the fully adjusted model (Table 2).
Change in relative body size and hypertension
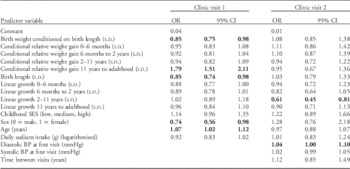
Table 3 shows the odds ratios (ORs) for hypertension per unit of the predictor variables at mean ages 61.5 and 66.4 years. A one s.d. increase of conditional height at age 11 years, representing linear growth between ages 2 and 11 years, was associated with an OR of 0.61 (95% CI: 0.45, 0.81) for hypertension.
Odds ratio for hypertension per unit predictor variable

OR, odds ratio; CI: confidence interval; BP, blood pressure.
Significant associations at 0.05 level bolded for clarity.
Additional analyses
We also analysed the associations between childhood growth and adult DBP. Apart from the positive associations between adult conditional relative weight and DBP demonstrated in all models, no other association reached significance at the 0.05 level (Supplementary Table S2).
Additionally, we repeated the linear regression analyses of the associations between growth and SBP including only those who were without antihypertensive medication at both clinic visits (n=430). In this analysis, an inverse association between linear growth between 2 and 11 years and SBP was present at mean age 61.5 years. This association amplified by the time of the second clinic visit, at mean age 66.4 years (Supplemental Table S3). For every s.d. increase in conditional height at age 11 years, SBP at mean age 66.4 years decreased 4.9 mmHg (95% CI: 2.7, 7.2). After additional adjustment for SBP at mean age 61.5 years, this attenuated to a decrease of 2.6 mmHg (95% CI: 0.7, 4.4).
Discussion
We have studied the associations between childhood growth and blood pressure at mean ages 61.5 and 66.4 years in a Finnish birth cohort born between 1934 and 1944. A higher adult conditional relative weight, i.e. a faster than expected relative weight gain (independent of linear growth) between age 11 years and adulthood, was associated with higher adult SBP. Conversely, conditional relative weight gain and linear growth between 2 and 11 years were inversely associated with SBP at mean age 66.4 years. The inverse association with conditional height at age 11 years remained significant despite adjustment for SBP at mean age 61.5 years. Additionally, a one s.d. increase in conditional height at 11 years was associated with an OR of 0.61 (95% CI: 0.45, 0.81) for hypertension at mean age 66.4 years. Potentially, the beneficial influence of an optimal early growth could become more important with increasing age which in turn could explain why associations were observed only at the second clinic visit. Our findings support the importance of not just taking current body size into account but also previous growth patterns, that is the concept of a lifecourse approach when assessing who is at risk of developing adult disease.
The beneficial effects of a faster than expected childhood growth have previously been demonstrated in the HBCS. For example, liver fat content, as defined by an algorithm score, at mean age 61.5 years was lower for every s.d. of conditional body mass index (BMI) gain between birth and 2 years of age in both sexes and additionally for every s.d. of BMI gain between 2 and 7 years in men.Reference Sandboge, Perälä and Salonen 21 We have also demonstrated that body fat content was inversely associated with linear growth between birth and age 2 years.Reference Sandboge 17
The associations between early growth and hypertension have previously been explored in the HBCS.Reference Eriksson, Forsén, Kajantie, Osmond and Barker 8 In a study featuring 2003 individuals who attended the first clinic visit in 2001–2004, two groups of individuals were identified. The first group had already been diagnosed with hypertension before mean age 62 years. They were thin and short at birth, gained weight slowly between birth and 2 years, and thereafter grew rapidly ending up with an average body size at age 11 years. The second group had blood pressure levels within the hypertensive range when visiting the clinic, at mean age 62 years. These were short at birth, grew slowly during childhood, and were short and thin at age 11 years. The study findings indicate that there seems to be different developmental pathways leading to hypertension.
Several previous studies have demonstrated positive associations between rapid childhood weight gain and blood pressure levels in childhood,Reference Jones, Charakida and Falaschetti 9 , Reference Min, Kong and Park 10 adolescence,Reference Gamborg, Andersen and Baker 11 – Reference Menezes, Hallal and Dumith 13 and early adulthood.Reference Law, Shiell and Newsome 14 – Reference Adair, Fall and Osmond 16 In a study of 102 3-year-old girls and boys, conditional weight gain between birth and three years of age was positively associated with SBP, whereas no significant association was found with birth weight.Reference Min, Kong and Park 10 Another study demonstrated that a one s.d. increase in early childhood weight gain (between 1 and 5 years, conditioned on previous weight), was associated with a 1.4 mmHg (95% CI: 0.4–2.5) increase of SBP at age 22 years whereas no significant association was seen for growth between birth and age 1 year.Reference Law, Shiell and Newsome 14 After adjustment for current BMI, significance was lost, indicating that the association was, at least partly, mediated by adult adiposity.
In a recent publication from the Avon Longitudinal Survey of Parents and Children study (ALSPAC), weight gain between 17 months and 10 years was more strongly associated with blood pressure at age 10 years than birth size and growth before 17 months, that is during infancy.Reference Jones, Charakida and Falaschetti 9 After adjustment for sex, a one s.d. increase of conditional weight for height growth was associated with a 1.56 mmHg (95% CI: 1.32, 1.81) higher SBP at age 10 years. The ALSPAC participants were larger at age 10.5–11.49 years than the participants in our study at age 11 years with a mean BMI of 18.3 kg/m2 (s.d. 3.1) compared to 16.9 kg/m2 (s.d. 1.7).Reference Warrington, Howe and Wu 22 Whereas childhood obesity is currently a rapidly growing health concern, it was rare when our study population grew up. At age 11 years, only 3 male and 21 female participants had BMI values corresponding to an adult BMI of >25 kg/m2.Reference Cole, Bellizzi, Flegal and Dietz 23 None had BMI values corresponding to an adult BMI of >30 kg/m2. This might explain the differences between our findings and those featuring individuals born more recently. A faster childhood growth than expected among individuals in our study is likely a result of a beneficial childhood environment rather than the beginnings of later obesity.
In our study, conditional relative weight gain after age 11 years was positively associated with adult blood pressure. Several studies have demonstrated that more recent weight changes have a larger impact on current blood pressure than earlier ones.Reference Jones, Charakida and Falaschetti 9 , Reference Gamborg, Andersen and Baker 11 , Reference Chiolero, Paradis and Bovet 12 , Reference Law, Shiell and Newsome 14 In a study applying path analysis to compare three different standard regression models (simple linear, multiple linear, and conditional linear regression), the effect of change in BMI after age 11 years on adult blood pressure was more pronounced than earlier in childhood.Reference Gamborg, Andersen and Baker 11 Results from Chiolero et al support this conclusion, showing that conditional weight increase during late childhood and early adolescence (between 12.5 and 15.5 years), was had a stronger positive association with adolescent SBP, than growth during earlier years.Reference Chiolero, Paradis and Bovet 12
A few studies have demonstrated positive associations between rapid height gain and later blood pressure.Reference Jones, Charakida and Falaschetti 9 , Reference Adair, Fall and Osmond 16 In a publication from the five prospective birth cohorts comprising the COHORTS study, childhood linear growth and relative weight gain were weakly positively associated with blood pressure in young adulthood.Reference Adair, Fall and Osmond 16 In the previously cited ALSPAC article, a one s.d. increase of height growth between age 17 months and 10 years was associated with a 1.20 mmHg (95% CI: 0.96, 1.45) increase in SBP.Reference Jones, Charakida and Falaschetti 9
There are several potential explanations to why our findings differ from those of previous studies on the association between childhood growth and later hypertension. Whereas previous studies have primarily focussed on children and young adults, the HBCS consists of individuals who are already in their late adulthood. The participating men and women are 3.8 and 3.7 cm shorter in average, respectively, than the mean attained adult height of current Finnish growth standards. In childhood, they were also shorter and leaner.Reference Saari, Sankilampi and Hannila 24 Compared to the U.S. Centres for Disease Control and Prevention (CDC) population references, they were taller and heavier during early childhood but shorter and leaner during later childhood.Reference Kuczmarski, Ogden and Guo 25 A similar pattern was seen when comparing with WHO growth standards. 26 , Reference Onis, Onyango and Borghi 27 Supplementary Table S4 gives a full comparison with the CDC population references and WHO growth standards. Childhood overweight was rare and obesity was not present. Our findings indicate that, among a population of relatively low childhood height, and weight adjusted for height, both relative weight gain and height growth before age 11 years is beneficial, whereas relative weight gain thereafter is associated with increased adult blood pressure.
Previous studies have suggested that the association between birth weight and adult blood pressure amplifies with age. In a pooled analysis of three follow-up studies of adults and one longitudinal study of children, the inverse association between birth weight and adult SBP increased in magnitude from childhood to adulthood.Reference Davies, Smith, May and Ben-Shlomo 5 These conclusions have been questioned, however, and it has been suggested that although blood pressure increases with age, this can largely be accounted for by current BMI.Reference Hardy, Kuh, Langenberg and Wadsworth 28 A more recent study, however, comprising over 6500 men and women with up to 15 recorded blood pressure measurements, demonstrated that the association between SBP and birth weight amplified with age, regardless of adjustment for race and current BMI.Reference Chen, Srinivasan and Berenson 6 We are not aware if any previous studies have analysed whether the associations between childhood growth and adult blood pressure amplifies with age. In our study, significant associations with childhood growth were only demonstrated at mean age 66.4 years, indicating that beneficial effects of a more rapid than expected childhood growth in this study population become apparent with increasing age. In the reduced analysis, including only individuals without antihypertensive medication (n=430, Supplemental Table S3) an amplification effect was demonstrated between the two clinic visits. It is possible that this would also take place in the whole study population, should the analysis be repeated at a future date.
There are some limitations to our study. First, as the follow-up study at mean age 66.4 years focussed on individuals without diabetes at mean age 61.5 years, we are studying relatively healthy representatives of the age group. Second, our analysis is only based upon blood pressure measurements at the clinic visits, which might not correctly represent sedentary blood pressure. One could suspect that the recorded values are somewhat higher than the individuals’ true resting blood pressure. Still, there is no reason to suspect that this potential over-estimation would vary based on childhood growth trajectory. Third, the cohort only includes individuals born in Helsinki who attended childhood welfare clinics in the city and might not be representative of the Finnish population. However, SES at birth, defined as father’s highest attained occupational status, was comparable to the contemporary Helsinki population.Reference Eriksson, Forsen, Tuomilehto, Osmond and Barker 29 Lastly, all subjects were born and/or grew up during World War II which might have influenced both nutritional status and stress levels of mothers and offspring. The results, therefore, might not be generalizable to children born and growing up in Finland today, but might hold true for individuals approaching old age, a population with high prevalence of hypertension. Additionally, our findings might be generalizable to some developing countries undergoing rapid socioeconomic transitions today.
In conclusion, we have studied the associations between childhood growth and adult blood pressure. In a full model adjusting for previous SBP, we found that linear growth between birth and 6 months, as well as conditional relative weight gain and linear growth between ages 2 and 11 years were inversely associated with SBP at mean age 66.4 years, whereas relative weight gain after age 11 years was associated with increased SBP. A one s.d. increase of conditional height at age 11 years was associated with an OR of 0.61 for hypertension at the second clinic visit. On the other hand, no associations were found between childhood growth before age 11 years and SBP at mean age 61.5 years indicating that the beneficial effects of a more rapid than expected childhood growth might become apparent with increasing age.
Acknowledgements
None.
Financial Support
The Helsinki Birth Cohort Study has been supported by the Academy of Finland [grant numbers 120386, 125876], the Finnish Special Governmental Subsidy for Health Sciences, Finska Läkaresällskapet, the Juho Vainio Foundation, Liv och Hälsa, Samfundet Folkhälsan, and the Signe and Ane Gyllenberg Foundation.
Conflicts of Interest
None.
Ethical Standard
The authors assert that all procedures contributing to this work comply with the ethical standards of the Finnish national guidelines on human experimentation and with the Helsinki Declaration of 1975, as revised in 2008, and has been approved by the Ethics Committee of Hospital District of Helsinki and Uusimaa. Written informed consent was obtained from all subjects.
Supplementary Material
To view supplementary material for this article, please visit http://dx.doi./org/10.1017/S2040174415007886