Implications
Cows experiencing subacute rumen acidosis (SARA) often suffer from inflammation, which might modulate their metabolic responsiveness to immunogenic compounds such as lipopolysaccharide (LPS), leading to alterations of metabolites related to energy and mineral metabolism. The present study showed that an intramammary LPS challenge caused stronger metabolic perturbations in cows experiencing SARA conditions compared with control cows. This implies that cows experiencing SARA might face greater efforts to restore metabolic variables when suffering from an acute mastitis caused by gram-negative bacteria compared with cows without SARA.
Introduction
High yielding dairy cows are commonly fed diets rich in grain to meet their nutritional needs, which increases the risk of SARA (Zebeli and Metzler-Zebeli, Reference Zebeli and Metzler-Zebeli2012). The SARA is marked by an intermittent drop in ruminal pH that often leads to alterations of rumen microbiota, like an increased lysis of gram-negative bacteria (GNB) (Khafipour et al., Reference Khafipour, Li, Plaizier and Krause2009), ending up with the release of large amounts of cell-free LPS in rumen fluid (Plaizier et al., Reference Plaizier, Khafipour, Li, Gozho and Krause2012). The LPS is part of the outer leaflet of the cell wall of GNB like Escherichia coli with high immune properties (Plaizier et al., Reference Plaizier, Khafipour, Li, Gozho and Krause2012; Zebeli and Metzler-Zebeli, Reference Zebeli and Metzler-Zebeli2012). Thus, cows fed high grain diets and experiencing prolonged SARA typically undergo an increased translocation of LPS or other immunogenic compounds or pathogens from their gastrointestinal tract, thereby increasing the odds for inflammation (Li et al., Reference Li, Gozho, Gakhar, Khafipour, Krause and Plaizier2012; Zebeli and Metzler-Zebeli, Reference Zebeli and Metzler-Zebeli2012).
In this regard, translocation of LPS into the systemic circulation has been linked to perturbations of several blood metabolites related to glucose, lipid and mineral metabolism (Ametaj et al., Reference Ametaj, Zebeli and Iqbal2010). Besides LPS translocation due to high grain feeding, a further and more potent source of LPS, that dairy cows are often exposed to, derives from clinical bovine mastitis caused by E. coli (Kobayashi et al., Reference Kobayashi, Oyama, Numata, Rahman and Kumura2013). A specific external LPS stimulus by intramammary infusion is a common method to mimic natural gram-negative mastitis (Moyes et al., Reference Moyes, Larsen, Sǿrensen and Ingvartsen2014). In this context, it has also been recently demonstrated that experimental E. coli mastitis is accompanied by changes in several blood metabolites like glucose, NEFA and BHBA (Moyes et al., Reference Moyes, Larsen, Sǿrensen and Ingvartsen2014). Due to the long-lasting exposure to LPS in cows suffering from grain-induced SARA, we hypothesized that they might respond differently to a subsequent exposure to LPS compared with cows with healthy ruminal pH conditions. The present study was part of a larger study, in which we observed that cows experiencing intermittent SARA conditions were more responsive to an external LPS stimulus in terms of reducing feed intake, chewing behavior and milk yield compared with control cows (Aditya et al., Reference Aditya, Humer, Pourazad, Khiaosa-ard, Huber and Zebeli2017). However, the impact of SARA on the stress and metabolic responses to external infectious stimuli, such as intramammary LPS has not been evaluated yet. Therefore, the objective of this study was to evaluate the effects of an intramammary LPS challenge on blood metabolites related to lipid and glucose metabolism as well as on liver health and stress in dairy cows experiencing or not intermittent SARA conditions.
Material and methods
Animals, experimental design and diets
The animal trial was conducted at the Dairy Research Center of the University of Veterinary Medicine Vienna (Pottenstein, Austria). All procedures involving animal treatment were approved by the National Authority of Austria in accordance with §26 of the Law for Animal Trials, 2012-TVG (GZ BMWFW-68.205/0096-WF/V/3b/2015) and the Institutional Ethics Commission of the University of Veterinary Medicine Vienna.
Details regarding feeding and experimental design are reported in our companion paper (Aditya et al., Reference Aditya, Humer, Pourazad, Khiaosa-ard, Huber and Zebeli2017). In brief, a total of 18 early-lactating Simmental cows (eight primiparous and 10 multiparous) with 712±101.3 kg BW and 67±20.5 days in milk (DIM) were selected for this experiment based on appropriate udder health criterion (<200 000 somatic cells/ml). The animals were blocked by lactation number and DIM and allocated in two different feeding regimens: Control (n=6) and SARA (n=12). The control cows (CON) received 40% concentrates in the diet throughout the experiment (Supplementary Material Table S1). The SARA cows received an intermittent SARA-feeding challenge, consisting of four periods: feeding with 40% concentrate for 6 days (Baseline), then stepped up to a level of 60% concentrate in the total mixed ration (TMR) for 8 days (SARA 1), then stepped down again to 40% concentrate for 7 days (SARA Break), and during the last 17 days of feeding the concentrate level was stepped up again to 60% in the TMR. The occurrence of SARA episodes was monitored using wireless-bolus sensors (Smaxtec Animal Care Sales GmbH, Graz, Austria). According to Neubauer et al. (Reference Neubauer, Humer, Kröger, Braid, Wagner and Zebeli2017) a reticular pH below 6.0 for at least 5.24 h/day was considered as being representative of SARA. More details regarding the reticuloruminal pH measurements are presented in our companion paper (Aditya et al., Reference Aditya, Humer, Pourazad, Khiaosa-ard, Huber and Zebeli2017).
All diets were formulated to meet or exceed the nutrient and energy requirements of dairy cows weighing 700 kg and producing 30 kg milk/day with 3.4% protein and 4.0% fat according to the recommendations of the German Society of Nutrition Physiology (2001). Ingredients and chemical composition of diets are shown in Supplementary Material Table S1. By using a robotic feeding system (Triomatic T15; Trioliet Feeding Technology, Oldenzaal, the Netherlands), fresh TMRs were prepared daily and offered in separate electronically regulated feeders (Insentec B.V., Marknesse, the Netherlands) to the cows twice a day (0800 and 1500 h). The feeding method was ad libitum and daily offered-TMR allowed about 5% to 10% feed refusals. All animals had free access to water throughout the experiment.
Feed sampling and nutrient analyses
Feed samples were collected weekly for proximate nutrient analysis and all analyses performed are described in detail by Aditya et al. (Reference Aditya, Humer, Pourazad, Khiaosa-ard, Huber and Zebeli2017).
Intramammary lipopolysaccharide challenge
The intramammary LPS infusion is also described in detail by Aditya et al. (Reference Aditya, Humer, Pourazad, Khiaosa-ard, Huber and Zebeli2017). In brief, on day 30 of the experiment, the intramammary LPS infusion was conducted 3 h after the morning milking. A single dosage of 50 µg LPS from E. coli (O26:B6; Sigma-Aldrich Inc., Missouri, MI, USA), diluted in 10 ml of sterile NaCl solution (B. Braun, Melsungen, Germany) was intramammarily administrated into the left front quarter of all CON cows (CON-LPS) and half of the SARA (SARA-LPS), whereas the other six SARA cows obtained 10 ml of sterile NaCl solution as a placebo (SARA-PLA).
Blood samples and analyses
Blood samples were taken shortly before the morning feeding via jugular vein on day 2 (Baseline), 8 (SARA 1), 15 (SARA Break), and 30 (SARA 2, 4 h before LPS challenge) as well as at 6, 12, 24 and 48 h after the LPS intramammary challenge. The blood samples were collected into two different vacutainer tubes (Vacuette; Greiner Bio-One GmbH, Kremsmünster, Austria); 9 ml vacutainer tubes containing spray-coated silica were used to collect blood serum and 6 ml vacutainer tubes containing sodium fluoride for blood plasma collection. Shortly after collection, the obtained blood samples in spray-coated silica tubes were allowed to clot for 2 h at room temperature. Meanwhile, the blood samples collected in sodium fluoride-tubes were immediately put into cold water with a temperature of 4°C for 2 h. Thereafter, all samples were centrifuged at 2000×g at 4°C for 15 min and then the acquired serum and plasma samples were stored at −80°C until further analysis.
The obtained sera samples were used to analyze cortisol, calcium (Ca), non-esterified fatty acids (NEFA), β-hydroxybutyrate (BHBA), cholesterol, as well as liver enzymes including aspartate aminotransferase (AST), γ-glutamyltransferase (GGT) and glutamate dehydrogenase (GLDH), whereas the obtained plasma samples were used to assay glucose and lactate. All metabolites were measured using an auto large-scale analyzer for clinical chemistry (Cobas 6000/c501; Roche Diagnostics GmbH, Vienna, Austria) at the laboratory of the Central Clinical Pathology Unit, Vetmeduni Vienna. The intra-assay variation was controlled by limiting the coefficient of variation to ⩽5% for all blood variables.
Statistical analyses
The data were statistically analyzed by ANOVA using the MIXED procedure of SAS (version 9.4; SAS institute Inc., Cary, NC, USA). Assumptions that are required for a ANOVA were tested following the protocol from Zuur et al. (Reference Zuur, Ieno and Elphick2010). Homogenity of variance was assured by applying the Levene’s-Test. No transformation was required. To assess the diet effect before LPS challenge, the blood metabolites of cows subjected to the two different feeding regimens (CON (n=6) and SARA (n=12)) were compared. The model also included the fixed effects of period and the interaction between period and feeding regimen. In addition, the effect of the intramammary LPS challenge on cows experiencing SARA or not was evaluated. This model included the three different groups (CON-LPS (n=6), SARA-LPS (n=6) and SARA-PLA (n=6)), the effect of time (h relative to LPS/PLA infusion), and the interaction between time and group. For both ANOVAs, the individual cows were considered as random effect. The data obtained from one cow at different times were considered as repeated measurements with a first-order autoregressive variance-covariance matrix. Comparisons among the least squares means (LSM) were evaluated by the pdiff option. Additionally, the significance of the overall effect of LPS challenge (i.e. LPS groups v. PLA) as well as the overall effect of LPS challenge associated with feeding regimen (i.e. SARA-LPS v. CON-LPS) was tested by orthogonal contrasts. The significance level was set at P⩽0.05, and differences among LSM with 0.05<P⩽0.10 were considered as a trend.
Results
Reticuloruminal pH before lipopolysaccharide infusion
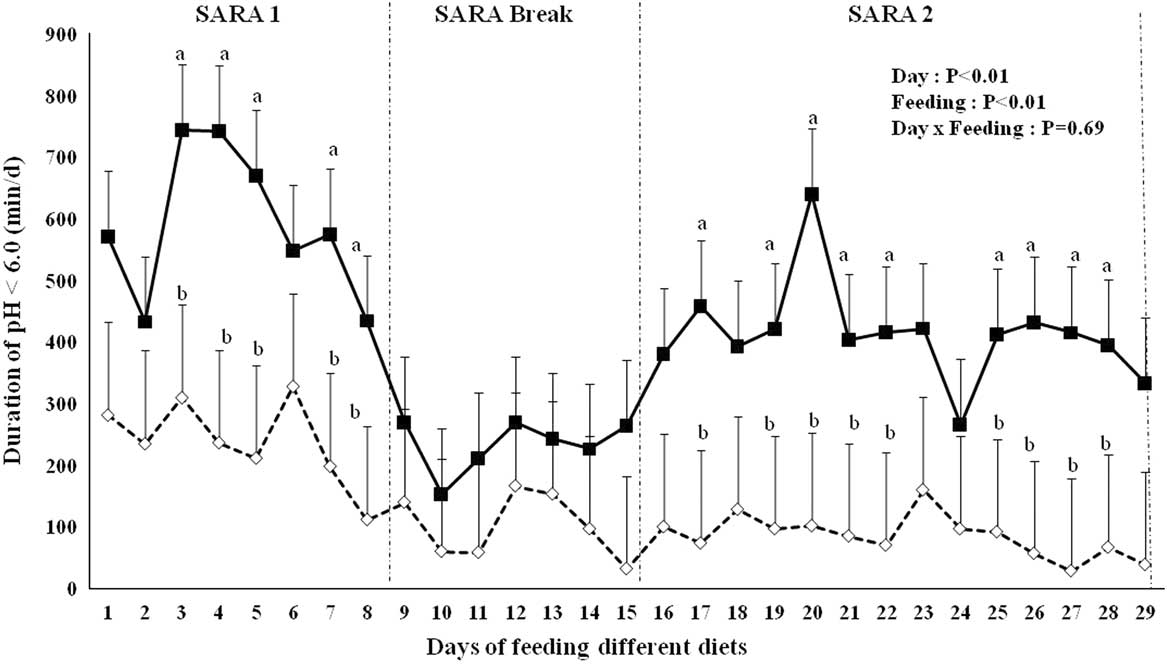
Data of reticuloruminal pH measured in SARA and CON cows are shown in Figure 1. Data of both SARA groups (SARA-LPS and SARA-PLA) were summarized throughout the experiment, as they did not differ in the time duration of pH<6.0. Data revealed that SARA cows significantly had longer time duration of pH below 6.0 compared with CON cows during both SARA challenges (P<0.01), while no difference occurred in the SARA Break. In both SARA periods, the time duration of 314 min/day of pH<6.0 was exceeded, although cows showed a stronger response in SARA 1 than SARA 2 (on average 589.4 v. 413.2 min/day).
Time duration of reticuloruminal pH below 6.0 in lactating cows fed a control (CON;  ) diet or a subacute rumen acidosis (SARA;
 ) diet. The SARA cows received a diet containing 60% concentrates for 8 days (SARA 1), followed by a 7-day period with 40% concentrates afterwards (SARA Break) and were finally fed 14 days with 60% concentrates (SARA 2). The CON cows were fed a diet containing 40% concentrates throughout the trial. The superscripts a, b indicate differences among least squares means of the same day at P⩽0.05.

Blood metabolites before lipopolysaccharide infusion
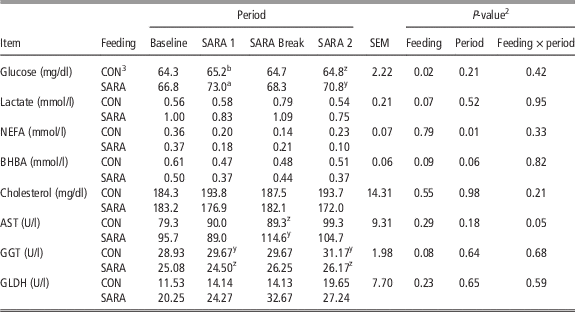
The metabolic responses in cows of CON and SARA-feeding regimens before the LPS challenge measured at the end of all four periods (Baseline, SARA 1, SARA Break and SARA 2) are summarized in Table 1. Data of both SARA groups (SARA-PLA and SARA-LPS) were summarized, as separate analyses demonstrated no differences in all investigated parameters before the LPS/PLA infusion.
The concentrations of blood metabolic variables before the intramammary lipopolysaccharide (LPS)/placebo (PLA) challenge in lactating dairy cows experiencing (n=12) or not (n=6) subacute rumen acidosis (SARA)Footnote 1

NEFA=non-esterified fatty acids; BHBA=β-hydroxybutyrate; AST=aspartate aminotransferase; GGT=γ-glutamyltransferase; GLDH=glutamate dehydrogenase.
abIndicate differences among LSM between CON and SARA in the same period at P⩽0.05
yzIndicate differences among LSM between CON and SARA in the same period at 0.05<P⩽0.10.
1 Before the trial, both groups were fed with Baseline diets consisting of 40% concentrate for 6 days. The SARA-feeding protocol consisted of feeding cows 60% concentrates for 8 days (SARA 1), followed by a 7-day period with 40% concentrates afterwards (SARA Break) and finally of 14 days of 60% concentrates (SARA 2). The Control (CON) feeding was 40% concentrates throughout the trial.
2 Effect of feeding group (feeding), time before LPS infusion (period), interactive effect of group and period (feeding×period).
3 Data are summarized among both SARA groups (SARA-LPS and SARA-PLA) as no differences in all variables were observed between the SARA cows that underwent LPS or PLA exposure, respectively, later.
SARA cows showed higher glucose concentrations (P=0.02), whereby a stronger rise occurred in SARA 1 (73 mg/dl in SARA cows compared with 65 mg/dl in CON cows, P=0.02) followed by a trend toward a higher concentration in SARA 2 after the break (71 mg/dl in SARA cows v. 65 mg/dl in CON cows, P=0.07). Also, concentrations of lactate in blood tended to be higher in cows that received the SARA-feeding regimen (0.92 mmol/l) compared with the CON cows (0.62 mmol/l; P=0.07). For NEFA, the different feeding regimen did not show an overall difference (P=0.79), but a time effect was noticed (P=0.01), which indicates that NEFA concentration was highest in the baseline. In SARA cows, lowest concentrations in NEFA were found in both SARA periods, especially at the end of SARA 2 (P<0.10). The concentration of BHBA tended to be lower in cows with SARA compared with CON cows (P=0.09). Similarly to NEFA, a tendency toward a time effect was observed (P=0.06), whereby the BHBA concentration decreased after the baseline period, particularly in SARA cows during the SARA- periods (P<0.10).
Feeding regimes did not differ regarding the cholesterol concentrations (P=0.55), while slight effects on liver enzymes were noticed. For AST, an interaction between feeding regimen and period (P=0.05) revealed a tendential difference in the SARA Break period, with higher AST concentrations in cows experiencing SARA. Furthermore, the GGT concentration tended to be higher in CON cows compared with SARA cows (30 v. 26 U/l; P=0.08). No difference of GLDH was observed between the feeding regimens (P=0.23).
Blood metabolites relative to lipopolysaccharide infusion
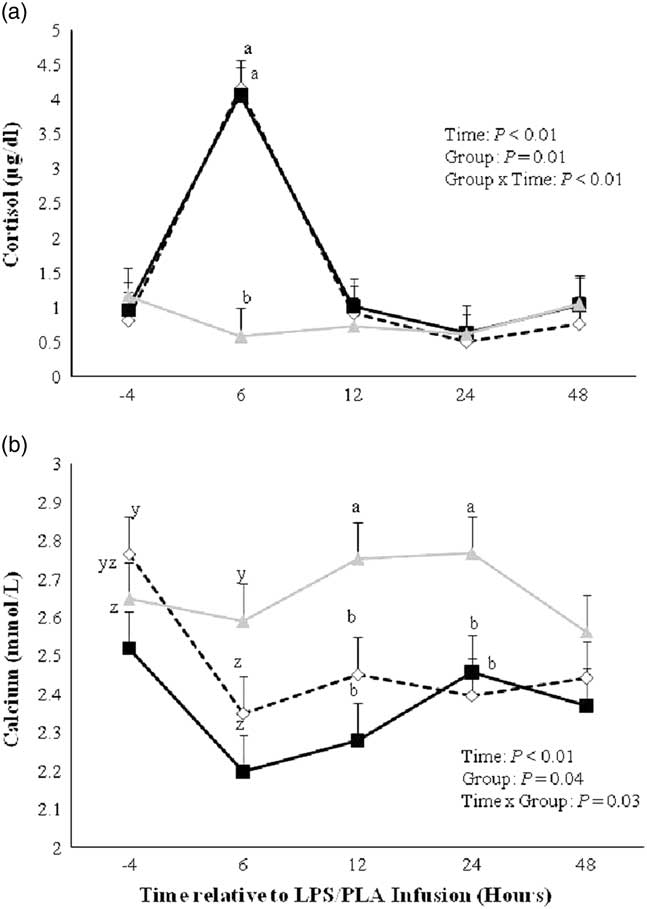
Cows receiving LPS had a tremendous increase in the cortisol concentration compared with PLA infusion (P<0.01), whereby no difference was observed between CON-LPS and SARA-LPS (Figure 2a). The cortisol values of both LPS groups peaked 6 h after the LPS infusion and declined 12 h afterwards to the concentrations measured before the infusion.
Cortisol (a) and calcium (b) in the blood of lactating cows fed a control diet and receiving a lipopolysaccharide infusion (CON-LPS; ) or a subacute rumen acidosis (SARA) diet and receiving either a lipopolysaccharide (SARA-LPS; ) or placebo infusion (SARA-PLA;  ), measured shortly before as well as 6, 12, 24 and 48 h after the lipopolysaccharide/placebo infusion. Data are demonstrated as least squares means (LSM)±standard errors. The superscripts a, b indicate differences among LSM of the same sampling time point at P⩽0.05, while the superscripts y, z indicate differences among LSM of the same sampling time point at 0.05<P⩽0.10.

The effects of the LPS challenge on alterations in the Ca concentrations are shown in Figure 2b. An interaction between group and time (P=0.03) revealed that the Ca concentration declined after LPS infusion in both SARA-LPS and CON-LPS compared with the SARA-PLA (overall LPS challenge effect: P=0.02). The reductions were especially pronounced between 6 and 24 h after the challenge. According to orthogonal contrast analysis, no difference was observed between SARA-LPS and CON-LPS cows regarding the Ca response to LPS infusion (P=0.28).
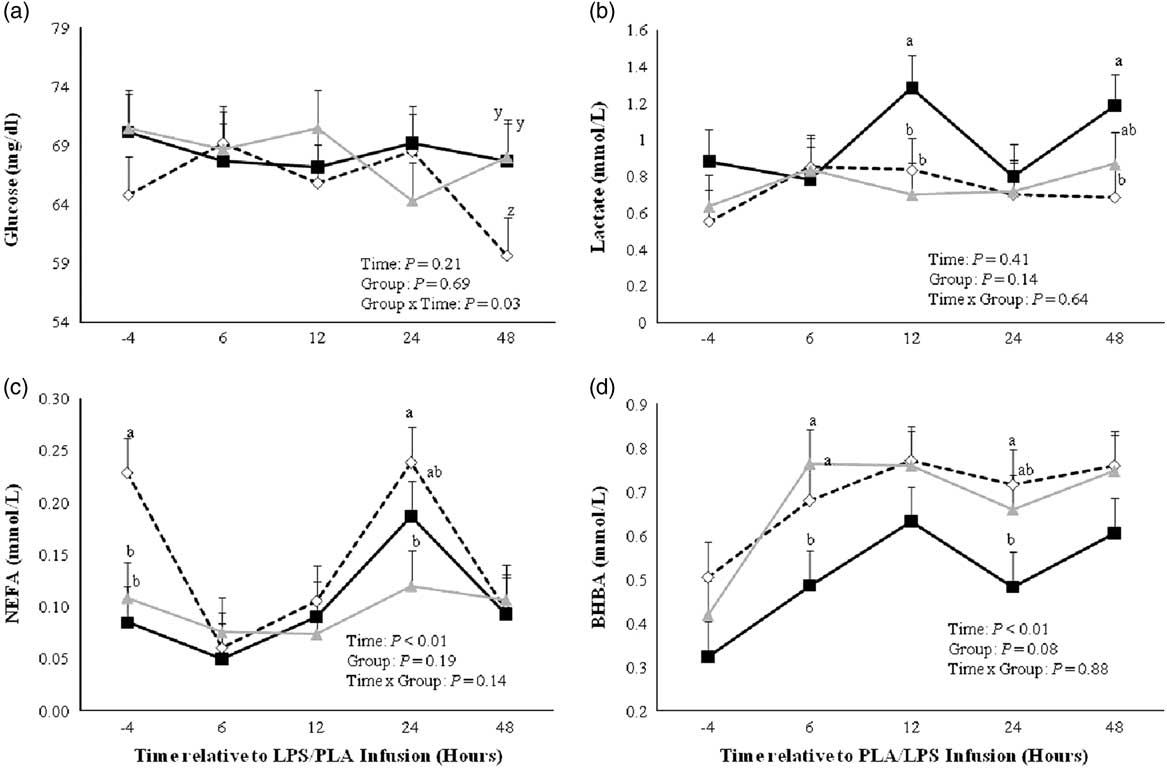
For the glucose concentration, an interaction between time and group (Figure 3a, P=0.03) showed a lower concentration in CON-LPS compared with SARA-LPS and SARA-PLA at 48 h after challenge (P<0.10). For lactate, no significant difference was noted between different groups across all time points (P=0.14). A more specific comparison of measurements among groups within the single sampling time points revealed significantly increased lactate concentrations in SARA-LPS compared with CON-LPS and SARA-PLA at 12 h after the LPS challenge and with CON-LPS groups at 48 h (Figure 3b). Furthermore, orthogonal contrast analysis showed an overall trend toward higher concentrations of lactate in SARA-LPS compared with CON-LPS cows (P=0.07).
Glucose (a), lactate (b), non-esterified fatty acids (NEFA) (c) and β-hydroxybutyrate (BHBA) (d) in blood of lactating cows fed a control diet and receiving a lipopolysaccharide infusion (CON-LPS; ) or a subacute rumen acidosis (SARA) diet and receiving either a lipopolysaccharide (SARA-LPS; ) or placebo infusion (SARA-PLA; ), measured shortly before as well as 6, 12, 24 and 48 h after the lipopolysaccharide/placebo infusion. Data are demonstrated as least square means (LSM)±standard errors. The superscripts a, b indicate differences among LSM of the same sampling time point at P⩽0.05, while the superscripts y, z indicate differences among LSM of the same sampling time point at 0.05<P⩽0.10.

A higher concentration of NEFA was found in the CON cows before the LPS challenge compared with both SARA groups (P<0.05), whereas CON-LPS and SARA-LPS cows had similar concentrations during all sampling points after the intramammary LPS challenge (Figure 3c). An overall time effect (P<0.01) was found. For CON-LPS cows, the NEFA decreased at 6, 12 and 48 h after the infusion, whereas the concentration 24 h after the challenge was similar to the initial value. Meanwhile, SARA-LPS cows had an elevated concentration only at 24 h after the challenge, whereas no changes in NEFA concentrations were observed in cows receiving PLA infusion. Furthermore, BHBA was significantly affected by time relative to LPS infusion (P<0.01) and also tended to differ between groups (Figure 3d, P=0.08). While all groups showed higher BHBA concentrations after the LPS/PLA infusion, differences among groups were significant at 6 and 24 h after the challenge, showing lowest values for cows of the SARA-LPS group (Figure 3d). Orthogonal contrast analysis revealed lower BHBA concentrations of SARA-LPS cows compared with CON-LPS across time points (P=0.04).
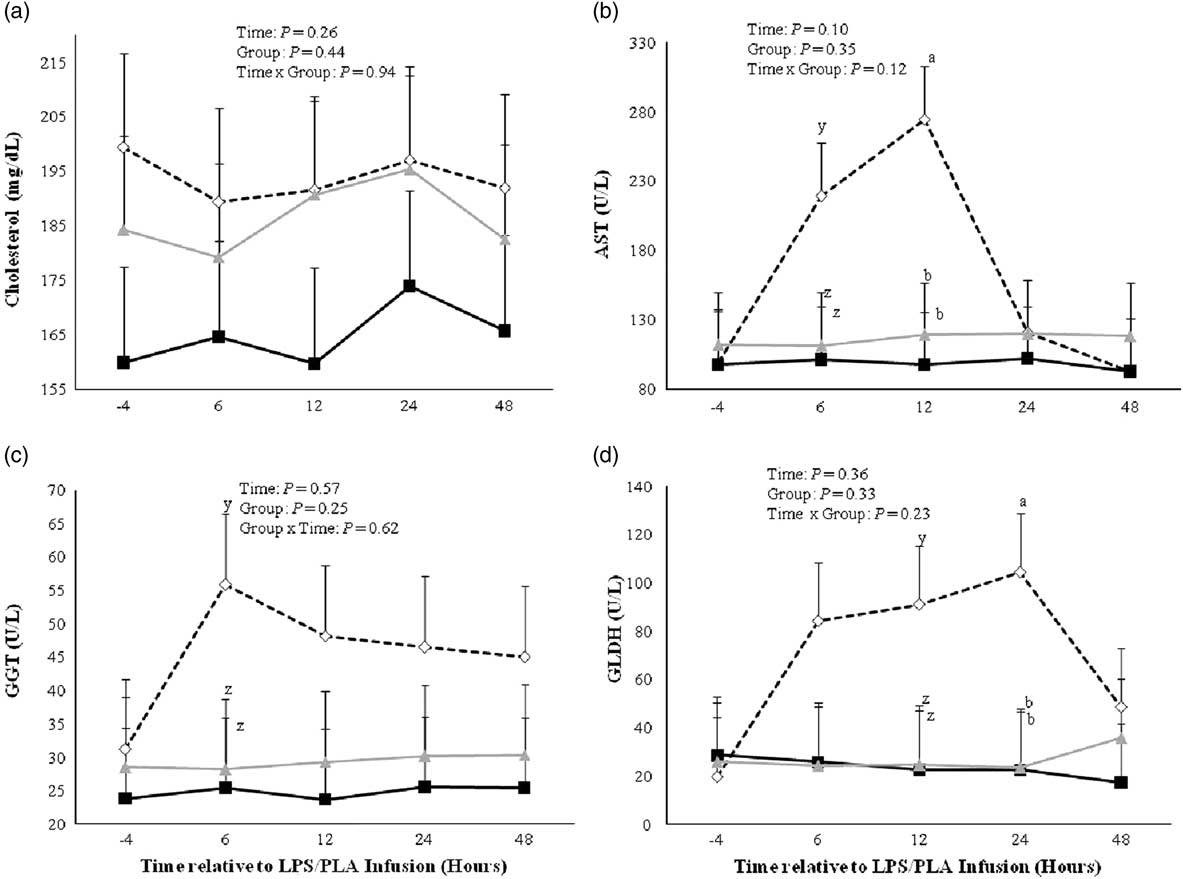
No difference was observed for cholesterol among groups (Figure 4a, P=0.44). Also, no significant differences were noticed regarding liver enzymes among groups across sampling times (AST, P=0.35; GGT, P=0.25; GLDH, P=0.33). However, a specific comparison among groups at different sampling times showed higher values in CON-LPS compared with both SARA groups after the LPS infusion. Specifically, differences were noted among the groups at 6 and 12 h for AST, from 6 h onwards for GGT and from 6 to 24 h for GLDH. These differences occurred due to one cow in CON-LPS group having extremely high concentrations in all of the measured enzymes at the respective times after the LPS infusion, reaching values of up to 793 U/l for AST, 188 U/l for GGT and 370 U/l for GLDH; however, in none of the other cows liver enzymes differed among sampling times relative to LPS/PLA infusion.
Cholesterol (a), aspartate aminotransferase (AST) (b), γ-glutamyltransferase (GGT) (c) and glutamate dehydrogenase (GLDH) (d) in blood of lactating cows fed a control diet and receiving a lipopolysaccharide infusion (CON-LPS; ) or a subacute rumen acidosis (SARA) diet and receiving either a lipopolysaccharide (SARA-LPS; ) or placebo infusion (SARA-PLA; ) measured shortly before as well as 6, 12, 24 and 48 h after the lipopolysaccharide/placebo infusion. Data are demonstrated as least squares means (LSM)±standard errors. The superscripts a, b indicate differences among LSM of the same sampling time point at P⩽0.05, while the superscripts y, z indicate differences among LSM of the same sampling time point at 0.05<P⩽0.10.

Discussion
The characterization of changes in various metabolic blood parameters in cows subjected to a single intramammary LPS infusion was part of a larger study in dairy cows, in which the effects of SARA induction on reticuloruminal pH and temperature, feed intake and milk as well as health clinical variables were investigated (Aditya et al., Reference Aditya, Humer, Pourazad, Khiaosa-ard, Huber and Zebeli2017). In brief, cows subjected to the SARA-feeding regimen experienced SARA conditions as shown by a drop in reticuloruminal pH below 6.0 longer than 5.24 h/day during the SARA periods. However, the LPS infusion per se had no effect on reticuloruminal pH but led to a short-term febrile condition, increase of reticuloruminal temperature, and decline in DMI, chewing activity, and milk yield. These effects were stronger in cows experiencing SARA compared with control cows.
Effects of intermittent high concentrate feeding
Cows subjected to the SARA-feeding regimen had higher blood glucose concentrations than CON cows. This result was expected as no depression of the DMI occurred (Aditya et al., Reference Aditya, Humer, Pourazad, Khiaosa-ard, Huber and Zebeli2017) and is generally in agreement with previous findings (Ametaj et al., Reference Ametaj, Emmanuel, Zebeli and Dunn2009; Rodríguez-Lecompte et al., Reference Rodríguez-Lecompte, Kroeker, Ceballos-Márquez, Li, Plaizier and Gomez2014) and can be explained by the greater amount of starch fed, which results in higher propionate generation and absorption in rumen, and in gluconeogenesis in the liver (Aschenbach et al., Reference Aschenbach, Kristensen, Donkin, Hammon and Penner2010). The higher supply of glucose provides increased glucose and energy for milk production and in turn decreases the need to mobilize fat tissues to fulfill the high energy requirements. This is reflected in lower concentrations of NEFA and BHBA (De Koster and Opsomer, Reference De Koster and Opsomer2013), which were observed in cows fed the energy-dense diet.
It is well-known that high lipid mobilization from adipose tissues can impair the cellular integrity of the liver, which leads to an elevation of several enzymes (e.g. AST, GGT and GLDH). These are widely distributed in many tissues but have a high activity in the liver, and leak out into the systemic circulation when liver tissue is injured (Bobe et al., Reference Bobe, Young and Beitz2004). In the present study, a tendency toward an overall higher concentration of GGT was observed in CON cows. However, as the values of NEFA and BHBA in the control cows were still under normal ranges and did not reach a concentration that indicate lipolysis that may impair liver health (Ospina et al., Reference Ospina, Nydam, Stokol and Overton2010), it is not justified to assume that the lower provision of energy via alimentary sources impaired liver function of CON cows. Furthermore, the measured GGT values were within reference ranges (Cozzi et al., Reference Cozzi, Ravarotto, Gottardo, Stefani, Contiero, Moro, Brscic and Dalvit2011) and differences between both groups were indeed quite small (4 U/l). Alternately, AST showed higher values in cows receiving the SARA diet at the end of the SARA break compared with the control cows. In general, AST exceeded the threshold value measured in clinically healthy cows (Wille et al., Reference Wille, Simon, Platen and Oertel2010) in SARA cows at the last sampling times (⩾105 U/l). Therefore, it can be suggested that the increase in AST in cows subjected to the SARA-feeding regimen reflects the metabolic stress associated with the activation of inflammatory responses associated with low ruminal pH readings that might afflict liver function (Plaizier et al., Reference Plaizier, Khafipour, Li, Gozho and Krause2012).
Effects of intrammamary lipopolysaccharide challenge
In general, the initiation of SARA is such a disorder associated with an increased risk of several metabolic disorders and might lead to a stronger responsiveness to external infectious stimuli like intramammary infusion of LPS (Aditya et al., Reference Aditya, Humer, Pourazad, Khiaosa-ard, Huber and Zebeli2017). The response of some metabolic parameters due to experimental E. coli mastitis have been reported previously (Moyes et al., Reference Moyes, Larsen, Sǿrensen and Ingvartsen2014), but it has not been clarified yet whether cows experiencing SARA respond in a similar manner compared with healthy cows or would rather show more severe responses. Therefore, the main objective of the present study was to monitor stress and metabolic health responses of cows subjected to SARA or non-SARA (control) conditions to external infectious stimuli using an intramammary LPS challenge model.
In the current study, the LPS challenge increased cortisol concentration in CON-LPS and SARA-LPS cows. This increase derives from the stress due to strong inflammatory effects as reported previously in cows receiving an intramammary LPS infusion at a dosage of 200 µg (E. coli O26:B6) (Lüttgenau et al., Reference Lüttgenau, Wellnitz, Kradolfer, Kalaitzakis, Ulbrich, Bruckmaier and Bollwein2016). More specifically, the activation of pro-inflammatory cytokines due to infusion of LPS has been reported to lead to an increased synthesis of glucocorticoids, thus resulting in higher cortisol concentrations (Beishuizen and Thijs, Reference Beishuizen and Thijs2003).
In contrast with cortisol, serum Ca concentration decreased after the LPS infusion. Similar results have been found previously (Waldron et al., Reference Waldron, Nishida, Nonnecke and Overton2003b) and it has been suggested that the decreased serum Ca is part of the immune response to facilitate the detoxification of LPS (Ametaj et al., Reference Ametaj, Zebeli and Iqbal2010; Eckel and Ametaj, Reference Eckel and Ametaj2016). In this regard, studies have shown that Ca inhibits the binding of LPS to lipoproteins (Eggesbø et al., Reference Eggesbø, Lyberg, Aspelin, Hjermann and Kierulf1996). Therefore, the translocation of LPS to the systemic circulation which induces endotoxemia is frequently associated with hypocalcemia (Andersen, Reference Andersen2003). Nevertheless, no difference was observed between cows subjected to the SARA-feeding regimen or not.
CON-LPS and SARA-LPS cows responded differently to the LPS infusion, in particular with regard to lactate and BHBA concentrations. The LPS challenge resulted in higher lactate concentrations in SARA-LPS cows than in CON-LPS cows. In general, there are different sources of blood lactate in ruminants. First, one source of plasma lactate derives from rumen fermentation, especially when low ruminal pH occurs due to high grain feeding (Ametaj et al., Reference Ametaj, Emmanuel, Zebeli and Dunn2009; Aschenbach et al., Reference Aschenbach, Kristensen, Donkin, Hammon and Penner2010). A recent study of our team evidenced the capacity of the rumen epithelium to absorb lactate during intermittent or transient SARA conditions (Qumar et al., Reference Qumar, Khiaosa-Ard, Pourazad, Wetzels, Klevenhusen, Kandler, Aschenbach and Zebeli2016). Second, plasma lactate can originate from anaerobe oxidation of glucose occurring in the skeletal muscle and other peripheral tissues (Kaneko et al., Reference Kaneko, Harvey and Bruss2008). Given that no difference of reticuloruminal pH after the LPS challenge was observed between CON-LPS and SARA-LPS cows (Aditya et al., Reference Aditya, Humer, Pourazad, Khiaosa-ard, Huber and Zebeli2017), it is not likely that the higher lactate concentration in SARA-LPS cows derived from increased generation of lactate via fermentation processes occurring in the rumen. Steiger et al. (Reference Steiger, Senn, Altreuther, Werling, Sutter, Kreuzer and Langhans1999) speculated that an increased anaerobic glycolysis due to poor tissue perfusion as well as lowered capacity to utilize lactate leads to enhanced plasma lactate in cows challenged with LPS. The underlying mechanisms seem to derive from a downregulating effect of LPS on mitochondrial phosphoenol pyruvatecarboxykinase, a key liver enzyme involved in the process of gluconeogenesis required for lactate recycling (Caton et al., Reference Caton, Nayuni, Murch and Corder2009). Overall, it appears that the previously observed effect toward increased plasma lactate concentration after LPS infusion (Steiger et al., Reference Steiger, Senn, Altreuther, Werling, Sutter, Kreuzer and Langhans1999) has been only pronounced in SARA-LPS cows, but not in the CON-LPS cows.
Additionally, the BHBA concentration after the LPS infusion differed among groups, with SARA-LPS cows showing lowest concentrations. One has to consider that BHBA in ruminants can derive from butyric acid generated in the rumen (McDonald et al., Reference McDonald, Edwards, Greenhalgh, Morgan, Sinclair and Wilkinson2011), but also from the oxidation of NEFA to acetyl CoA, which is converted to ketone bodies such as BHBA during periods of severe negative energy balance (Bobe et al., Reference Bobe, Young and Beitz2004). As serum BHBA increases after feeding due to butyric acid production during ruminal fermentation (Bines and Davey, Reference Bines and Davey1978), the more pronounced decline in DMI in SARA-LPS cows in response to the LPS challenge compared with CON-LPS cows (Aditya et al., Reference Aditya, Humer, Pourazad, Khiaosa-ard, Huber and Zebeli2017) might have led to a decrease in BHBA in the blood of the respective cows. Moreover, several previous studies suggest a decreased ketogenesis in the liver as the causative reason for the lowered plasma BHBA concentration following the administration of LPS (Steiger et al., Reference Steiger, Senn, Altreuther, Werling, Sutter, Kreuzer and Langhans1999; Moyes et al., Reference Moyes, Larsen, Sǿrensen and Ingvartsen2014). However, as most of the circulating BHBA in well-fed cows derives from butyrate metabolism in the rumen, the lowered substrate supply and/or repression of ketogenic capacity of the ruminal epithelium (Waldron et al., Reference Waldron, Nonnecke, Nishida, Horst and Overton2003a) can be considered as the primary causes of the lowered BHBA concentration in SARA-LPS compared with CON-LPS cows.
The higher NEFA concentration in CON-LPS cows compared with both SARA groups before LPS infusion is likely related to the higher mobilization of the body lipid stores to provide the necessary fuels for milk production in those cows. Data at 24 h after LPS infusion revealed an elevated level of NEFA in SARA-LPS and CON-LPS cows. It might be that the lower feed intake after the LPS challenge in cows receiving LPS compared with SARA-PLA cows was the reason behind this (Aditya et al., Reference Aditya, Humer, Pourazad, Khiaosa-ard, Huber and Zebeli2017). Additionally, the increase in NEFA in SARA-LPS 24 h after the infusion could be related to LPS challenge per se. Indeed, Kushibiki et al. (Reference Kushibiki, Hodate, Shingu, Hayashi, Touno, Shinoda and Yokomizo2002) observed increased plasma NEFA albeit unaffected DMI in heifers receiving recombinant TNF-α.
Furthermore, it has been reported that the oxidative stress associated with LPS induces damage to the liver (Kaur et al., Reference Kaur, Tirkey, Bharrhan, Chanana, Rishi and Chopra2006), which might be finally reflected in an increase of liver enzyme activity. Nevertheless, in the present study, no overall effect of LPS on AST, GGT and GLDH was observed. Thus, it appears that the production of reactive oxygen intermediates due to the LPS infusion was not increased to a concentration that causes liver damage. However, higher values of liver enzymes were found in the CON-LPS group, whereby this derives from one cow in this group which tremendously overreacted to the LPS challenge regarding the respective reactants of liver health, but not with regard to the other analyzed blood metabolites. However, other cows either in CON-LPS, SARA-LPS or SARA-PLA group did not show any difference on liver enzyme concentrations.
Overall, only little research is available on the responsiveness of dairy cows to an intramammary LPS infusion after prolonged exposure to low amounts of LPS. However, in humans ‘low doses’ (1 to 100 ng/ml) of LPS have been shown to induce a state of tolerance, while ‘super low doses’ (0.05 to 0.5 ng/ml) have been shown to cause an augmented response to a subsequent endotoxin challenge (Morris and Li, Reference Morris and Li2012).
Conclusions
In conclusion, the present study showed that a single intramammary LPS challenge increased cortisol and lowered serum Ca concentrations in cows independent of feeding regimen. The data also suggest that this challenge leads to stronger responses in terms of the perturbation of the blood metabolites lactate and BHBA in cows experiencing intermittent SARA conditions compared with healthy cows. This implies that cows experiencing SARA might necessitate greater attention and care to restore metabolic variables when suffering from an acute mastitis compared with cows that do not experience SARA.
Acknowledgments
The authors acknowledge the staff of the teaching and research farm Kremesberg (University of Veterinary Medicine Vienna) for their excellent technical assistance and help with the animal experiment. The authors thank A. Fengel, K. Wiesböck and M. Qumar (students at Vetmeduni Vienna) for their help during the experiment. They thank A. Dockner and S. Eisen (Institute of Animal Nutrition and Functional Plant Compounds, Vetmeduni Vienna) for the laboratory analyses assistance. The first author thanks the Austrian Agency for International Cooperation (OeAD) in Education and Research, the ASEAN-European Academic University Network (ASEA UNINET) for the financial support of PhD program. Finally, the authors gratefully thank the Vienna Science and Technology Fund (WWTF) for the support of this research project (“D-I.INFLACOW, LS12-010”).
Supplementary Material
To view supplementary material for this article, please visit https://doi.org/10.1017/S1751731117002191