1. Introduction
Several studies of hedonic prices have determined that environmental variables are significant factors affecting housing prices: for instance, noise level (Swoboda et al., Reference Swoboda, Nega and Timm2015; Trojanek and Huderek-Glapska, Reference Trojanek and Huderek-Glapska2018; von Graevenitz, Reference von Graevenitz2018; Zambrano-Monserrate and Ruano, Reference Zambrano-Monserrate and Ruano2019), distance to urban parks with green areas (Zhang and Yi, Reference Zhang and Yi2017; Yuan et al., Reference Yuan, Wu, Wei and Wang2018; Kim et al., Reference Kim, Lee, Lee and Choi2019), number of urban trees (Donovan and Butry, Reference Donovan and Butry2011; Mei et al., Reference Mei, Hite and Sohngen2017), air pollution (Hitaj et al., Reference Hitaj, Lynch, McConnell and Tra2018), different types of vegetation (Belcher and Chisholm, Reference Belcher and Chisholm2018) and urban water bodies (Poor et al., Reference Poor, Pessagno and Paul2007; Zhang and Boyle, Reference Zhang and Boyle2010; Walsh et al., Reference Walsh, Milon and Scrogin2011; Artell, Reference Artell2014; Chen, Reference Chen2017; Chen and Li, Reference Chen and Li2017; Du and Huang, Reference Du and Huang2018).
Water bodies such as rivers, streams, lakes or wetlands within cities can positively or negatively affect housing prices. These water bodies can be an environmental amenity by virtue of being considered natural and recreational landscapes (Ryan, Reference Ryan2005; Sander and Zhao, Reference Sander and Zhao2015). However, they can sometimes produce negative impacts on property prices due to their degradation (Brasington and Hite, Reference Brasington and Hite2005). The deterioration of water bodies is manifested in water pollution, river erosion, irritating odors and the presence of insects, among others (Netusil et al., Reference Netusil, Kincaid and Chang2014; Chen and Li, Reference Chen and Li2017).
The degradation of water bodies represents a serious threat to sustainable urban development (Chen, Reference Chen2017). Previous studies have analyzed the negative impact of water bodies in different locations. For example, Chen and Li (Reference Chen and Li2017) found that homebuyers are willing to pay an additional premium for an apartment located away from polluted streams. Zhang and Boyle (Reference Zhang and Boyle2010) found that lakes in the USA with invasive aquatic species decreased the price of properties in front of them.
Other studies have analyzed the effect of improvement in the quality of water bodies on housing prices. For example, Chen (Reference Chen2017) found that restoring a Chinese river could reverse the negative externalities of polluted watercourses, especially for those apartments on the 10th floor or lower. Artell (Reference Artell2014) found that, as water quality improved, the prices of Finnish properties adjacent to the Baltic Sea, lakes and rivers increased. Walsh et al. (Reference Walsh, Milon and Scrogin2011) showed that property prices in the USA are affected by water quality (when living close to a water body), the location of the property, proximity to the coast, and the surface of the water body.
Studies such as those described previously are common in developed countries. However, in developing countries, they are practically nonexistent, despite the frequent problems of water pollution in these countries. In South America, for example, water bodies such as estuaries have serious pollution problems due to inefficient treatment of wastewater and unplanned urban growth, as well as the excessive use of fertilizers and pesticides in suburban areas (Wittmann et al., Reference Wittmann, Householder and Wittmann2015).
An estuary is a partially enclosed body of coastal water which is permanently or periodically open to the sea, and that receives at least periodic discharges from a river or rivers. Therefore, its salinity is typically less than that of natural seawater (Potter et al., Reference Potter, Chuwen, Hoeksema and Elliott2010). Estuaries have always been an attraction for humans. Large settlements have developed near estuaries around the world (Davis and Kidd, Reference Davis and Kidd2012; Boerema and Meire, Reference Boerema and Meire2017). The attractiveness of estuaries can be linked to the ecosystem services they provide, such as the supply of water and fish, water for transport, protection against floods and storms, water purification, primary production, cultural services and recreation opportunities (Edgar et al., Reference Edgar, Barrett, Graddon and Last2000; Beaumont et al., Reference Beaumont, Austen, Atkins, Burdon, Degraer, Dentinho and Marboe2007).
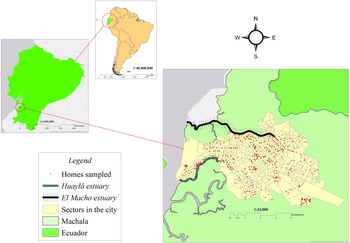
Ecuador, a country in South America, is severely affected by the pollution of its estuaries. Ecuador has grown at an accelerated rate in recent years (World Bank, 2018). Nevertheless, this growth has not been accompanied by proper urban planning. An example of this situation is Machala, a city located in southwestern Ecuador (figure 1). At the beginning of the 1990s, Machala had its highest peak of banana and shrimp production. The city attracted a large number of people who were looking for employment and growth opportunities. This produced irregular human settlements on the peripheries of the city, known as slums. The illegal settlements plus the authorities' lack of control caused the pollution of two big estuaries in Machala: El Macho and Huaylá (figure 1).
Study area.
Source: Elaborated by the authors.

The El Macho estuary, located in the north of the city, has a length of 6.5 km and a width of 26 m. It was built to take advantage of the flow of the Jubones River with the goal of irrigating the main crops of the city, especially banana crops. However, due to the slums in the area, the pollution of this estuary has accelerated rapidly. Thus, the El Macho estuary receives wastewater discharges, without previous treatment, as well as discharges from the banana and shrimp processing. As a consequence, the area has been affected by fetid smells which, even though they are not toxic, do generate discomfort in the population. Furthermore, the presence of fecal matter in the estuary can carry different diseases such as cholera, typhoid and meningitis, which are a danger to people in the surrounding areas. In fact, Ramirez (Reference Ramirez2017) concludes that the El Macho estuary does not comply with permissible quality criteria, finding high concentrations of cadmium, arsenic and lead, which classify the estuary as polluted. Furthermore, Ramirez (Reference Ramirez2017) finds that the cadmium concentrations, in water and sediment, are so high that they make aquatic and wildlife preservation impossible on the site.
The Huaylá estuary is located in the southeastern part of the city and extends for 4.5 km, with a width ranging between 50 and 94 m. The Huaylá estuary is an arm of the sea, and is affected by the pollution of domestic waste (garbage and wastewater) that comes from the slums. Along the canal, there are plastic bottles, gas and outboard motor oil, abandoned ships, fishing material and fecal matter, which provide evidence of the site's pollution. The pollution of the estuary has caused the disappearance of some species from the site, such as red crabs, fish (cachema), oysters, pelicans, herons and others. In fact, the fecal coliform concentrations are higher than 600 MPN (most probable number)/100 ml, which surpasses by far the maximum limit recommended, which is 200 MPN/100 ml. The pollution of the site is so critical that it has been estimated that thousands of kilos of fecal matter are discharged daily without any type of treatment.
The pollution of the estuaries is a negative environmental externality for the city, which generates social costs to the inhabitants, causing changes in their production and consumption behavior. Accordingly, some families that rent houses have decided to move far away from the estuaries, thus avoiding their direct exposure to pollution. Furthermore, the contraction of demand for houses close to these places is causing a reduction in their rental prices. Therefore, the main hypothesis of this research is that the rental price of housing increases as the distance of the residence from the estuaries increases (ceteris paribus).
2. Methodology
2.1 Environmental economic valuation method: hedonic pricing
Environmental economic valuation aims to find a monetary measure of the earnings/losses of welfare that a person gets from the provision of an environmental good or change in the provision of that good. It is a fundamental tool for the proper definition of environmental policy instruments (Kolstad, Reference Kolstad2011; Zambrano-Monserrate, Reference Zambrano-Monserrate2020; Zambrano-Monserrate and Ruano, Reference Zambrano-Monserrate and Ruano2020). Environmental economic valuation methods are classified into two categories: (1) the stated preference method or the direct method, which exploits the survey technique of asking people about the value they give to environmental goods and nonmarketable services and about the changes in the environmental goods provided; and (2) the revealed preference method or the indirect method, which studies the ‘substitute markets,’ measures the value of nonmarketable goods and environmental services through analysis of the price fluctuations in the market for related economic goods (Zambrano-Monserrate, Reference Zambrano-Monserrate2016; Gregg and Wheeler, Reference Gregg and Wheeler2018).
The hedonic price method (HPM) is an indirect economic valuation method that has been applied in different areas, one of them being the housing market. Residences are multi-attribute; nevertheless, most of their attributes – for example, the environmental ones – are not commercially separated, meaning they do not have an explicit price (do not have a market). In spite of this, they have value, the reason why people are willing to pay for them. HPM tries to identify these attributes and differentiate the quantitative importance of each one of them. In other words, the method assigns an implicit price to each attribute of the good. This implicit price represents an individual/family's marginal willingness to pay for an additional unit of the given attribute (Rosen, Reference Rosen1974).
In the housing market, HPM generally uses regression analysis to estimate the effects of the attributes on the housing price. An attribute that has received special attention is location, since it is common for the residence price to be strongly related to the prices of contiguous residences and weakly related to the prices of distant homes. This could show that there are spatial effects that must be considered in the analysis. These spatial effects are spatial autocorrelation and spatial heterogeneity. Due to such effects, traditional estimations by ordinary least squares (OLS) generate non-consistent estimators. To solve this problem, several academics have developed econometric models that consider these spatial effects (Huang et al., Reference Huang, Chen, Xu and Zhou2017).
2.2 Econometric specification
To determine the effect of the estuaries on the residences' values, a base model is estimated through the OLS method. This can be represented as:

where ${\rm ln}( P )$ is the natural logarithm of the housing rental price; X represents several control variables; $Destuary$
 is the interest variable and represents the distance between a residence and the closest estuary; and $\varepsilon$
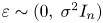
 is the stochastic disturbance term with a distribution $\varepsilon \sim ( {0, \;{\sigma^{2}}{I_{n}}} )$
 .
As previously mentioned, the models estimated by OLS do not consider the possible spatial effects, which are usually in the hedonic rental price model. There are three spatial regression models: the spatial lag model (SLM), the spatial error model (SEM) and the spatial Durbin model (SDM) (Elhorst, Reference Elhorst2010). According to LeSage and Pace (Reference LeSage and Pace2009) and supported by Li and Wu (Reference Li and Wu2017), the SDM is superior to the first two models since it can capture both the spatial correlation of the explained variable (global effects) and the spatial spillover effects of the explanatory variables (local effects). Furthermore, the SDM incorporates new explanatory variables that could have been omitted, thus correcting the bias of the omitted variable. However, because of this interaction, the model may exhibit an endogenous problem. To solve this problem, LeSage and Pace (Reference LeSage and Pace2009) advise applying the maximum likelihood (ML) method, hence providing the necessary theoretical framework to estimate the spatial lag values of the dependent and independent variables, including the direct and indirect effects as well.
In our model, the SDM can be presented as:

where $\lambda$ is an autoregressive spatial parameter and W is the spatial autocorrelation matrix $N \times N$
 in which the weighing element, ${w_{ij}},$
 is specified as:

where $i \ne j$ . ${\rm \Gamma }$
 and ${\rm \Upsilon }$
 are added to capture the local spatial effect of the variable Destuary and of other exogenous variables, respectively. As previously mentioned, the SDM has the advantage of capturing global $( \lambda )$
 and local effects $( {{\rm \Gamma }, \;{\rm \Upsilon }} )$
 at the same time. The other elements of equation (2) were previously defined.
On a different note, it is important to mention that under a non-spatial regression model (equation (1)), the total effect on the dependent variable will be equal to the estimation of the ${\beta _k}$ coefficient, ceteris paribus, no matter the location. However, in the case of the spatial effects model (equation (2)), the total effect depends on the neighbor units of each location and the magnitude of the coefficients along with the spatial variables. The total effect can be deconstructed into a direct and an indirect effect. The direct effect is the impact of the change of the explanatory variable on the dependent variable in each residence. This effect will tend to be similar to the one obtained by a non-spatial regression model if the spatial elements are close to zero. The indirect effect is due to the spatial dynamic generated by the presence of the spatial parameter and which affects all the model's units (Drukker et al., Reference Drukker, Prucha and Raciborski2013).
2.3 Construction of the spatial weights matrix and spatial autocorrelation tests
Prior to the analysis of any test of spatial contrast, it is necessary to construct the spatial weights matrix. In order to correctly construct it, the nature of the externality to be modeled should be considered, in this case, the estuaries. If the model to be estimated follows an exponential decay process (ergodic process), the spatial autocorrelation matrix can be structured through a nonparametric approach to this process.
Due to the structure of the data (points rather than polygons), the applied criteria were of k nearest neighbors.Footnote 1 Following Mei et al. (Reference Mei, Hite and Sohngen2017), the test and error method was used to calculate the importance of the spatial parameter and thus determine the nearest neighbor specification. As such, the five nearest neighbors were chosen for the analysis.Footnote 2 Finally, the matrix created was binary and standardized by row. Once the spatial weights matrix was built, a spatial autocorrelation diagnostic was done through the test of the Lagrange Multiplier (simple and robust). This test contrasts the SLM and SEM models.
2.4 Construction of influence zones (buffers)
The construction of areas of influence is a useful technique when studying the spatial effect of environmental externalities. They allow us to analyze this effect graphically and numerically, producing a detailed view of the externality. There are two basic methods to build areas of influence: Euclidean and Geodesic. Euclidean influence zones are the most common type of influence zone and work well when analyzing distances around entities in a projected coordinate system that are concentrated in a relatively small area (such as a Universal Transverse Mercator (UTM) zone) (ArcMap, 2018).
2.5 Data collection
Despite the fact that the statistics in Ecuador on a national level have improved, the transaction data with regard to the housing market are very limited and are restricted. On the one hand, the housing companies refuse to hand out data on the executed transactions due to confidentiality issues. On the other hand, public information on the housing market is very limited (data is incomplete and is not geo-referenced). Therefore, primary, geo-referenced information was collected on the residential rental market of the city of Machala.
A conglomerate sampling was implemented since it is the most recommended when there are ‘natural’ clusters as is the case with people or families that rent houses. Machala is divided into census areas, which are comprised of an average of 10 sectors. Likewise, each sector represents a conglomerate of blocks. Of all the census areas, only the most representative ones were considered. Then the sectors were also selected. In the sectors chosen, a block was picked, and surveys were carried out in up to four blocks surrounding the given block.
The study population was families (individuals) who lived in Machala, who rented houses, apartments or rooms. Sampling was used in order for the surveyed homes that were chosen to geographically represent all the areas in the city. A qualified and experienced pollster was in charge of data collection. Four groups of interviewers were formed, with two members each. The questionnaire had an average duration of approximately 10 min, and the interviews were done face-to-face at the homes. Data were collected over a two-week period, on weekends and workdays, from 23 July 23 to 5 August 2018. Four hundred surveys were carried out in total, with a sampling error of ± 5 per cent with a 95 per cent confidence level.
2.6 Variables
Despite the fact that several hedonic studies use the housing rental market price as the independent variable, other authors such as Donovan and Butry (Reference Donovan and Butry2011) and Choumert et al. (Reference Choumert, Stage and Uwera2014) have determined the housing rental price as the dependent variable. This was done due to the dynamism of the rental market, which perfectly reflects the changes in the environment, particularly in the characteristics of the study subject, such as the pollution of the estuaries. Thus monthly payments of rental values in US$ was taken as the dependent variable (table 1). Additionally, control variables were considered as groups divided into three categories: structural, surrounding and environmental, where the main exogenous variable was the distance of the houses from the closest estuary.
Description of variables considered in this study

a Noise measurements were made at different times. However, only data for 9:00 p.m. was chosen, since it is one of the times with the greatest variation in noise in the city. The detail of noise measurement can be found in Zambrano-Monserrate and Ruano (Reference Zambrano-Monserrate and Ruano2019).
3. Results
3.1 Descriptive statistics
Results show that the average rental price of a residence in Machala is US$179.84, and each residence has, on average, 89 square meters of construction. The average age of the residence is 14 years. The average distance of the rental residence from the main road of the city, avenue 25 de Junio, is 1,278 m. Furthermore, on average, the housing is located 1 km from the closest urban park with green areas. Also, when observing the average distance of the residences from the city mall, most surveyed houses are very far from the site. This result can be explained by the fact that the mall is located outside the city.
On the other hand, analyzing the variable of interest, it is observed that on average houses are located 1,400 m from the closest estuary. Nevertheless, the standard deviation of these variables is 1,341, which means that there are houses located close to these pollution points. This result confirms the danger to which certain people in the city are exposed. Their houses are at risk of flooding due to the growth of the flow of estuaries in the rainy season; moreover, they are at risk from direct exposure to pollution.
Table 2 also shows that most rented residences are apartments in houses or buildings (76.25 per cent) and that most rented houses (92 per cent) are not in gated neighborhoods. Likewise, a small percentage of residences (4.50 per cent) are furnished. A smaller percentage (10.75 per cent) have a garage and backyard (19.50 per cent). Additionally, the main material on floors is ceramic floor, tiles or vinyl (63.50 per cent) followed by cement or brick (24.50 per cent). Only a small percentage (2.25 per cent) have marble. This result could be due to marble being one of the most expensive materials in Ecuador, thus its usage in rental residences is not that common. Regarding the type of structure of walls, concrete, block or brick is the main material used (79 per cent). Also, concrete, slab and cement is the primary material for the roof of most residences (76 per cent). Nevertheless, there is a smaller percentage (20 per cent) that uses zinc as a roof cover. Regarding water service, most houses (93.25 per cent) get water from the public network. Likewise, a significant percentage of homes (88.25 per cent) dispose of their waste using public service. In another scenario, most residences (87.25 per cent) have paved streets or roads as their main road. Furthermore, almost half of the residences (43.25 per cent) have a view of the main road. Finally, only a small percentage of rented residences (8 per cent) are in safe locations in the city.
Descriptive statistics

3.2 Empirical analysis
3.2.1 Model estimation: robust OLS versus spatial regression models
The Durbin spatial model estimate, described in section 2, as well as the base model (estimated by robust OLS), is presented in this section.
An estimation by robust OLS (model 1) allows us to obtain a first impression of the relationship of the variables (table 3). For instance, for each additional square meter that the residence has, its price increases by 0.68 per cent on average (ceteris paribus). Also, the coefficient of the variable ‘view’, 0.2591, can be interpreted. Thus, it can be affirmed that the median of the rental values of houses that have a view of the main street, is 29.58 per cent higher than those that do not have this characteristic.Footnote 3 On the other hand, analyzing the results of the variable ‘safety’ it can be shown that with each unitary increment of the level of the crime index (low, medium, high), the price of the residence is reduced on average by 37.18 per cent. This impact is high and significant. This first model shows the variable ‘Distance to estuaries’ as significant and positive. As such, the residences closer to the estuaries in the city have a lower rental price than those that are farther away.
Model estimations

a The other structural and surrounding variables described in table 1 are not shown due to lack of space; however their results are available upon request.
Notes: The T statistic is shown in parentheses. The Z statistic in shown in square brackets. For model 1, robust standard errors were estimated. For spatial models, conventional standard errors were calculated. * p < 0.01; ** p < 0.05.
Even though this first model shows a good adjustment and the signs of the variables are as expected, spatial autocorrelation is a common problem in hedonic price studies. Thus the spatial dependence tests described previously were performed. The results show that the null hypothesis of no spatial autocorrelation was rejected in all the scenarios.Footnote 4 Thus model 1 requires spatial elements.
Four SDMs were estimated, which differ from each other by the number of control variables considered (table 3). Model 2 considers only the variable of interest ‘Distance to estuaries’. The coefficient's positive sign indicates that as the distance of the house from the nearest estuary increases, its rental price is revalued. Such a significant relationship confirms that contaminated estuaries represent a negative externality for the city's housing market.
In models 3, 4 and 5, the stability of the variable of interest is evaluated. It is observed that the coefficient is stable; that is, it retains its sign and significance in all models. Despite this, a non-monotonous decrease can be seen in the coefficient as control variables are added. This result means that the effect of the externality is mitigated by other factors, for example, noise level and distance to urban parks. The noise level negatively affects housing prices. On the other hand, urban parks with green areas do not influence rental prices.
3.2.2 Buffers analysis for estuaries
In order to determine the influence area of the estuaries, some dummy variables were coded. The estimationsFootnote 5 by robust OLS (table 4) show that the pollution effect of the estuaries drops as the distance of the residence from them increases. For instance, rental prices of houses within a 100 m radius of the estuaries are approximately 49.09 per cent lower than those of houses that are within a radius greater than 2,800 m from the estuaries.
Estimation of the price difference for different buffers

Notes: The T statistic is shown in parentheses. * p < 0.01; ** p < 0.05.
This price difference drops to 31.98 per cent when comparing houses that are within a radius of 101–500 m from the closest estuary. Nevertheless, the pollution effect of the estuaries disappears at a distance of 800 m. Figure 2 illustrates the different influence areas.
Influence area of estuaries
Source: Elaborated by the authors.

3.2.3 The average economic value of pollution of estuaries
As previously mentioned, estimating the economic value of the pollution of estuaries is useful when establishing public policies focused on its solution. As such, it is important to remember that the marginal effects of the spatial regression models have a direct component and an indirect one. To estimate these effects, the procedure proposed by LeSage and Pace (Reference LeSage and Pace2009) was followed. Table 5 shows that the direct effect is slightly higher than the coefficient obtained in model 5. On the other hand, the indirect effect can be interpreted as those spillover effects generated by the spatial elements. In this case, approximately 44 per cent of the total effect (of estuaries on housing prices) is explained by indirect effects.
The average economic value of pollution of estuaries

In addition, table 5 shows the marginal willingness to pay (at the mean) to avoid the pollution of estuaries. The total effect was multiplied by the average rental price since the dependent variable was in logarithm. This value was multiplied by 100; hence the marginal analysis is easier to understand. Thus the rental price of a residence increases, on average, by US$9.45 (ceteris paribus) for every 100 m of distance from the residence to the closest estuary. This amount constitutes approximately 5.25 per cent of the average rental value in Machala and represents the average economic value of the pollution of estuaries.
4. Discussion
The dynamic of rental prices is explained by several variables, such as structural, surrounding and environmental variables. Recently, special emphasis has been placed on the study of environmental variables, given their nature and their significant effect on the price of houses (Belcher and Chisholm, Reference Belcher and Chisholm2018). Some environmental variables provide services to society that are not often quantified and are sometimes undervalued in decision making (Daily et al., Reference Daily, Polasky, Goldstein, Kareiva, Mooney, Pejchar and Shallenberger2009). Nevertheless, there are other types of environmental variables that generate costs for society, creating negative externalities – for instance, the pollution of estuaries.
In Ecuador, the pollution of estuaries is a serious environmental problem that has not been solved yet; it affects important cities in the country such as Machala. This city has two big estuaries: the El Macho and the Huaylá. Due to the city's unplanned growth and the lack of wastewater treatment, the estuaries have turned into critical sources of pollution. This pollution has caused negative externalities for the citizens, which has changed their production habits and consumption. For instance, many families that rent houses have decided to move far from the estuaries, which has triggered a reduction in rental prices in the area.
4.1 Main findings
This research aimed to quantify the impact of polluted estuaries on the rental prices of houses in Machala. It was found that there is a negative relationship between house prices and estuaries. That is, the greater the distance between the estuary and the house, the higher the price of the property. However, this relationship is not linear; as the distance increases, the effect of the estuary falls, until it disappears at 800 m. These findings are consistent with studies that have analyzed the effect of urban water body pollution on housing prices, i.e., Chen and Li (Reference Chen and Li2017) in China, and Zhang and Boyle (Reference Zhang and Boyle2010) in the USA.
Other results show that apartments with a view to the main road have an average rental price higher than those that do not have this characteristic. This result can be explained due to the recreational effect (distraction) generated by observing the main street. Previous studies such as Zhang and Yi (Reference Zhang and Yi2017) and Lu (Reference Lu2018) have determined that residences with a view to different landscapes have a higher price. Moreover, residences located in safer sectors have a higher rental price. Authors such as Liebelt et al. (Reference Liebelt, Bartke and Schwarz2018) have confirmed that the level of crime in the sector significantly affects the property price. The distance to the main shopping center of the city does not affect rental prices. This result could be associated with the fact that Machala has only one mall, which is located on the outskirts of the city, surrounded by some gated neighborhoods. Therefore, the effect on the house rental price, which is in other sectors of the city, is nonexistent.
4.2 Limitations
Our research has some limitations. On the one hand, the methodology of hedonic prices does not consider non-use values such as existence, legacy and option values; thus, the estimated economic value of pollution of estuaries could be much higher. On the other hand, due to the lack of historical information regarding rental prices, it was not possible to do a comparative analysis of the evolution of the data.
4.3 Policy recommendations
Our results allow us to recommend some public policies. For example, regulatory policies such as the creation of taxes could be established for those who generate pollution in estuaries. This measure would deter the irresponsible behavior of a particular part of the population that throws their waste into these water bodies. On the other hand, the local government should establish sustainable urban growth policies in the city. This policy would prevent irregular settlement of families on the peripheries of the city and thereby the pollution of estuaries. Along these same lines, the creation of wastewater treatment plants near the estuaries is a policy that would help prevent the direct discharge of waste.
The main contribution of this research is the finding of evidence that polluted estuaries are determinants of rental prices. The effect of pollution on this type of water body has been studied extensively in developed countries such as the USA, China and Finland, among others. However, in developing countries, no previous work is evident, so our research covers this theoretical gap.
4.4 Impact and future research
Finally, our study encourages future work on the subject in developing countries. For example, future research could analyze whether unpolluted estuaries in other locations revalue property prices. If this is proven, estuaries could be defined as environmental amenities. Also, it is recommended that future studies use complementary valuation approaches such as contingent valuation. These approaches would allow for the estimation of the economic cost of pollution, considering use and non-use values at the same time.
Appendix
Moran spatial autocorrelation test for different distance classes.