Introduction
A developing body of behavioral genetic research has demonstrated significant genetic influence on a range of purportedly environmental variables. Kendler & Baker (Reference Kendler and Baker2007) reported a range of studies on the topic showing modest to moderate genetic impact on phenomena such as stressful life events, marital quality, peer interactions and parent–child relationships. As each of these traits is clearly affected by more conventional genetically influenced traits such as personality, mental health and intelligence, the discovery of non-zero heritability estimates for such traits should not be surprising in itself. However, studies demonstrating these effects may be of particular interest for researchers in psychopathology because of their power to illustrate the potential for ‘outside-the-skin’ pathways for genetic influence on psychopathology, in which the impact of genes on disease risk is mediated by genetically influenced pathogenic environments. Longitudinal studies on the impact of genetic factors on purportedly environmental variables are crucial for identifying such mediation effects but, as Kendler & Baker (Reference Kendler and Baker2007) noted, few such studies exist.
One ongoing effort that addresses this deficit is the Minnesota Twin Family Study (MTFS), a longitudinal twin study that has explored the role of genetic factors in the parent–child relationship (Elkins et al. Reference Elkins, McGue and Iacono1997; McGue et al. Reference McGue, Elkins, Walden and Iacono2005) and how this relationship contributes to externalizing psychopathology (Burt et al. Reference Burt, McGue, Krueger and Iacono2005). The latter study demonstrated one ‘outside-the-skin’ pathway when it showed that genetic factors affecting the early expression of a purportedly environmental variable (the parent–child relationship) contributed to levels of externalizing behaviors exhibited at a later age. The connection of the parent–child relationship with psychopathology and criminal behavior has long been recognized (cf. Rothbaum & Weisz, Reference Rothbaum and Weisz1994), but the ability of Burt et al. (Reference Burt, McGue, Krueger and Iacono2005) to control for confounding genetic factors enabled them to demonstrate that the individual plays some role in the emergence of the environmental risk itself.
Although the role of genetic influence in the parent–child relationship has been explored extensively by several investigators (Rowe, Reference Rowe1981, Reference Rowe1983; Kendler, Reference Kendler1996; Reiss et al. Reference Reiss, Neiderhiser, Hetherington and Plomin2000), newer contributions have focused on the change in heritability for this phenotype over time. Using a cross-sectional design, Elkins et al. (Reference Elkins, McGue and Iacono1997) found far greater heritability estimates for the parent–child relationship in the late-adolescent cohort of the MTFS than for the pre-adolescent cohort. This work was supported by later longitudinal data from the MTFS presented by McGue et al. (Reference McGue, Elkins, Walden and Iacono2005), who found increased heritability on the same measure between ages 11 and 14 years. Both of these studies contributed to a growing literature in behavioral genetics concerning change in heritability over time. A summary and meta-analysis by Bergen et al. (Reference Bergen, Gardner and Kendler2007) showed that increased heritability was observed from childhood to adulthood in all domains examined, including mental disorders, intellectual functioning, social and political attitudes, and family relationships. These increases in heritability tend to come at the expense of shared environmental contributions (i.e. the environmental effects associated with growing up together in the same family), whose role in influencing individual differences often begins to diminish well before the age when children typically leave the home.
Nevertheless, the growing recognition of biometric trends in development has remained significantly agnostic as to the processes responsible for them. Although this topic may ultimately be addressed at the molecular level, quantitative behavioral genetic methods can provide insight into the processes involved by clarifying the manner in which genetic influences on the phenotype change over time. Plomin (Reference Plomin1986) noted that although genetic factors account for much less variance in IQ at early ages than in adulthood, there were indications of a high degree of overlap in the genetic factors involved throughout this period. This suggested that genetic factors accounted for increasing amounts of variance through a process Plomin termed genetic amplification, in which initial genetic effects acquire greater influence as the individual ages. Alternatively, change in heritability estimates over the developmental course could indicate that some genetic factors influence the phenotype only at particular ages. In the context of increasing heritability this might be termed genetic addition, as these genetic factors would increase the net influence of genes on a phenotype without any necessary relationship to earlier genetic influences on the trait. A final possibility is that raw variance due to non-genetic sources declines through development, leading to an increase in heritability estimates even in the absence of any increase in variance due to genetic factors. Identifying which alternative is responsible for the biometric course of a trait allows some inferences to be made regarding the nature and influence of certain sources of phenotypic variation, as outlined below.
Conventional biometric models are sufficient to identify heritability changes that result from decreasing environmental variance. However, differentiating between the two alternatives in which genetic variance increases throughout development is best accomplished by growth curve modeling, a statistical technique available only to longitudinal studies with three or more assessments of the trait. When applied to a genetically informative sample such as twins, such models can identify both whether and how much genetic and environmental factors contribute to change and stability in the phenotype over time, and also what forms those contributions take. Some contributions of genetic and environmental factors may be specific to a single time point, and growth curve models isolate these contributions as age-specific effects. Biometric contributions that are part of a continuous trend throughout development are identified by their effects on the initial level (intercept), changes in that level (slope), and the relationship between those two (intercept–slope covariance).
Under the amplification model, a strong genetic association between the intercept and slope is expected, as this would indicate a growing importance for genetic influences on change that were already contributing to the phenotype when first assessed. By contrast, if the genetic association between intercept and slope is weak, and either a strong genetic influence is found for slope or large age-specific genetic effects are found in later assessments, the increased heritability can be attributed to genetic addition. Although there exist empirical demonstrations for the latter process (Hjelmborg et al. Reference Hjelmborg, Fagnani, Silventoinen, McGue, Korkeila, Christensen, Rissanen and Kaprio2008), amplification has a more plausible theoretical grounding for psychological phenotypes. This is because individuals are generally thought to have greater freedom to act in accordance with genetic dispositions as they age (Scarr & McCartney, Reference Scarr and McCartney1983) and become less constrained by the influences of their parents. Thus, for any traits in which genetic factors increase in importance because of the increasing freedom of the individual to express their disposition, latent growth modeling may be expected to identify genetic amplification at the heart of increasing genetic variance for the trait.
For the parent–child relationship, this could be interpreted as the relationship becoming more individualized and responsive to the particular genetically influenced characteristics of the child, which gradually displace the effects of parental or societal conceptions of child rearing. Genetic amplification also indicates that such child characteristics already influencing deviation from the mean at an early age have increasing effects over time, so that those who are relatively extreme tend to become more extreme. By contrast, in genetic addition any change in individual differences derived from genetic factors may be unrelated or even negatively related to initial individual differences resulting from genetic factors.
We examined MTFS data on the parent–child relationship in a large longitudinal sample assessed at ages 11, 14 and 17 years to identify phenotypic changes in this relationship and characterize any biometric patterns over this period. Although previous research has suggested that the parent–child relationship stabilizes in later adolescence (e.g. Loeber et al. Reference Loeber, Drinkwater, Yin, Anderson, Schmidt and Crawford2000; Kim et al. Reference Kim, Conger, Lorenz and Elder2001), these studies typically included only a few hundred participants and so may have been underpowered.
Method
Participants
The sample consisted of participants from the MTFS, an ongoing community-based longitudinal study of reared-together, same-sex twins and their parents. Table 1 presents the number and gender breakdown of participants. Comprehensive descriptions of this study's procedures and sample characteristics have been provided elsewhere (Iacono et al. Reference Iacono, Carlson, Taylor, Elkins and McGue1999; Iacono & McGue, Reference Iacono and McGue2002).
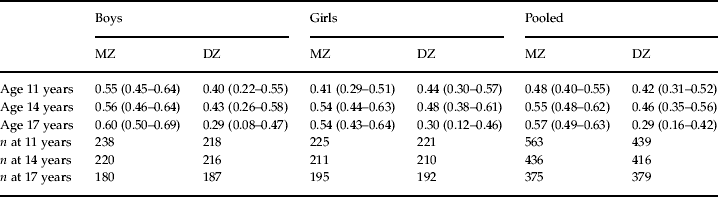
Twin correlations (with 95% confidence intervals) for the Parent Environment Questionnaire (PEQ) at ages 11, 14 and 17 years
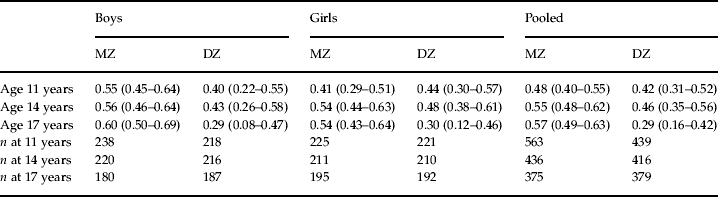
MZ, Monozygotic; DZ, dizygotic.
Correlations were estimated using the Expectation–Maximization (EM) algorithm assuming unobserved data were missing at random.
The present sample was first assessed at age 11 (mean = 11.7, s.d. = 0.43) years, with follow-up assessments performed approximately 3 years later, and then again 3 years after that. Although only 73% of the twins completed the relevant assessment at all three time points, another 20% were assessed twice. Analysis of information provided at age 11 by those not present in later assessments showed that although a composite score of externalizing symptoms did not predict non-participation at age 14, it did predict non-participation at age 17, with non-participants scoring 0.4 s.d. higher on age 11 externalizing symptoms. Scores from other assessments at that age, including internalizing symptoms and parent–child relationship quality, did not predict later participation in the study.
Measures
Data on the parent–child relationship were collected at each assessment when the twins completed the Parent Environment Questionnaire (PEQ) for each rearing parent. The PEQ is a 42-item survey developed by MTFS researchers to measure the relationship of the child with each parent; representative items include ‘My parent often criticizes me’ and ‘My parent comforts me when I am discouraged or have had a disappointment’. Elkins et al. (Reference Elkins, McGue and Iacono1997) provided a description of the development, theoretical rationale and psychometric properties of the PEQ, noting that factor analyses suggest the PEQ primarily assesses one major dimension of the parent–child relationship, which we follow McGue et al. (Reference McGue, Elkins, Walden and Iacono2005) in interpreting as concerned with parental warmth versus conflict. Previous work with the PEQ (Elkins et al. Reference Elkins, McGue and Iacono1997; McGue et al. Reference McGue, Elkins, Walden and Iacono2005) has examined this dimension using four different scales (Conflict, Involvement, Parental Regard for Child, and Child Regard for Parent). These scales are all highly correlated (between 0.59 and 0.70) and a principal components analysis of the constitutive items showed a first component accounting for >33% of the variance and the second factor accounting for <6%. Accordingly, for the present analysis we summed the raw scores on these four scales (after reverse scoring the Conflict scale) to form a unitary factor scale in which high scores reflect a more positive relationship.
Consistent with previous research based on self-report (Juang & Silbereisen, Reference Juang and Silbereisen1999) and direct observation (Baumrind, Reference Baumrind1991; Kim et al. Reference Kim, Conger, Lorenz and Elder2001), children's ratings of their relationships with their mothers and their relationships with their father were highly correlated. For both boys and girls, the correlations between mother and father ratings exceeded 0.60 at every assessment. For the analyses reported here we followed procedures used in other studies (e.g. McGue et al. Reference McGue, Elkins, Walden and Iacono2005) by averaging participants' ratings of relationships with mother and father to form a parent composite. In cases where there was only one rearing parent, the participant's ratings for that parent were used.
Statistical methods
Analysis of the longitudinal twin data was based on standard biometric methods (Neale & Cardon, Reference Neale and Cardon1992); that is, we assumed that the total phenotypic variance (P) for a given scale could be decomposed into independent additive genetic (A), shared environmental (C) and unique environmental (E) components. Additive genetic factors influence phenotypes without regard to other genes (i.e. epistatic effects) and are not expressed in dominant and recessive alleles. Shared environment refers to aspects of the environment that have similar effects on the phenotype of interest in each twin, regardless of zygosity. Non-shared environment refers to environmental variables that cause phenotypic differences between the members of a twin pair. Because monozygotic (MZ) twins share 100% of additive genetic effects whereas dizygotic (DZ) twins share only 50%, and because shared environmental effects are assumed to contribute equally to the similarity of the two types of twins, the three variance components (A, C and E) can be estimated from the observed variances and covariances for the two types of twins. The rationale and empirical support for the assumptions that underlie application of the standard biometric model to twin data have been discussed extensively and justified elsewhere (Pike et al. Reference Pike, McGuire, Hetherington, Reiss and Plomin1996; Plomin et al. Reference Plomin, DeFries, McClearn and Rutter1997; Kendler et al. Reference Kendler, Myers, Prescott and Neale2001; Johnson et al. Reference Johnson, Krueger, Bouchard and McGue2002). Nonetheless, we recognize that because we cannot directly establish the validity of these assumptions in the present application, the estimates of the variance components we report should be considered approximate.
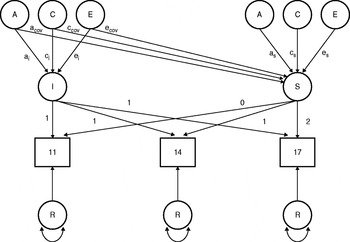
Biometric latent growth curve modeling was used to examine the changing contributions of A, C and E over time (Neale & McArdle, Reference Neale and McArdle2000). The full biometric growth curve model is depicted in Fig. 1. In this model, the variance in parental–child relationships over time was decomposed into four portions: contributions to intercept (I), slope (S), the covariance between the two, and contributions specific to each assessment (R). These were then decomposed into their respective additive genetic, shared environmental and non-shared environmental components. Contributions to the intercept (a i, c i and e i) comprised variance in the parent–offspring relationships that were stable across assessments, that is they contributed to the phenotype equally at each evaluation. Slope estimates (a s, c s and e s) represent the roles of the factors in linear change across assessments. Covariance estimates (a cov, c cov and e cov) represent the relationship between factors contributing to initial level and change. One of the merits of growth curve models is that, by modeling intercept and slope as latent factors, non-shared environmental influences are not confounded with measurement error. Instead, effects of measurement error show themselves in the contributions specific to single assessments. (As these can be thought of as the contributions not captured by the general regression terms, they are referred to as residuals.) These were estimated for each factor and for each assessment age.
Path diagram of the linear ACE growth curve model (for one individual) centered on age at the initial assessment. Letters A, C and E denote additive genetic, common environmental and unique environmental effects respectively. I and S denote level at baseline (intercept) and rate of change (slope) respectively, and R denotes the residual effect. Intercept–slope covariance is represented by the path connecting the A, C and E intercept estimators and the slope.

Even though attrition from the MTFS sample at follow-up was not related to PEQ, we accommodated missing data using full-information maximum-likelihood (FIML) raw data techniques, which produce efficient and consistent estimates in the presence of missing data (Little & Rubin, Reference Little and Rubin1987).
Using the Mx software system (Neale et al. Reference Neale, Boker, Xie and Maes2003) we obtained fit statistics for growth curve models (Neale & McArdle, Reference Neale and McArdle2000) of PEQ data for three models. The first of these was a no-sex-differences model in which parameter estimates for the male and female samples are constrained to be equal. Our second was a scalar-sex-differences model that allows the variance–covariance estimates in the male and female samples to differ only by a freely estimated scalar. Third, we estimated an unconstrained model in which parameters were freely estimated in the two samples. Following the guidelines in Markon & Krueger (Reference Markon and Krueger2004) based on sample size, biometric composition and skewness, the Akaike Information Criterion (AIC; Akaike, Reference Akaike, Petrov and Csaki1973) was the preferred fit statistic.
Results
Change and stability across assessments
McGue et al. (Reference McGue, Elkins, Walden and Iacono2005) found that the parent–child relationship deteriorated between ages 11 and 14 years in the MTFS sample, with increased levels of conflict and declining levels of involvement and mutual regard. We saw a modest continued deterioration in this relationship between ages 14 and 17. SAS Proc Mixed (SAS Institute Inc., USA) indicated that the decline in mean PEQ score between age 14 (mean = 63.41, s.d. = 15.19) and age 17 (mean = 62.71, s.d. = 15.48) was significant at p < 0.05, with a Cohen's d of 0.05. There was no significant sex difference (p = 0.91) or age-by-sex interaction (p = 0.36).
The stability coefficients for the PEQ suggested moderate stability for the phenotype over time: with boys and girls analyzed together, we found a correlation of 0.44 between ages 11 and 14, 0.52 between 14 and 17, and 0.29 between 11 and 17.
Twin correlations
Although growth curve models are more informative for data such as ours, a brief look at the twin correlations helps to highlight important patterns. Maximum-likelihood estimates of the twin correlations at each assessment are provided in Table 1, with boys and girls evaluated both separately and pooled. There are two trends worthy of comment. First, MZ–DZ differences in correlation strength were more pronounced in boys than girls across all time points, suggesting a possible stable sex difference in the heritability of the parent–child relationship. Second, the MZ correlations were generally greater than the corresponding DZ correlations, a trend that increased markedly as the sample aged. The biometric models were needed, however, to determine how differences in correlations corresponded to changes in the components of phenotypic variance over time.
Biometric analysis
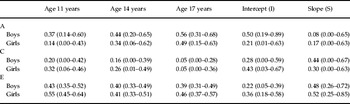
A superior fit was indicated by AIC values for the unconstrained model (22674.90) compared to both the no-sex-differences model (22683.99) and the scalar-sex-differences model (22685.98), suggesting that the biometric presentation of the parent–child relationship differed between boys and girls. Whereas boys increased in phenotypic variance between each assessment, the increase in variance for girls was complete by age 14. The lack of fit of a scalar-sex-differences model indicates that these different patterns, rather than a general sex difference in variance, are responsible for the improved fit observed when treating sexes separately. Common to both boys and girls was a substantial increase in raw genetic variance between each assessment, in addition to a decrease in raw shared environmental variance between ages 11 and 17 and a modest increase in unique environmental variance. The resulting standardized biometric estimates are presented in Table 2, showing substantial increases in heritability estimates, with corresponding declines in shared environmental factors.
Standardized ACE estimates (with 95% confidence intervals) from the growth curve

A, Additive genetic component of variance; C, shared environmental component; E, non-shared environmental component.
Biometric estimates for each age represent the standardization of the results depicted in Fig. 2. Estimates for biometric contributions to intercept (I) and slope (S) are standardized values from Table 3. A, C and E parameters sum to 100 for any group, and represent the percentage of the variance accounted for by that parameter.
Supplementary analyses were completed to characterize the growth curve results further. We used a Cholesky model (Neale & Cardon, Reference Neale and Cardon1992) to test whether genetic variance increased between ages 11 and 17 formally, in absolute and relative terms. Neither the raw nor the standardized genetic variance could be constrained across time without loss of fit as measured by the AIC, indicating the significance of these changes (unconstrained model AIC: 15088.185; raw genetic variance constrained AIC: 15092.363; standardized genetic variance constrained AIC: 15089.292). Despite the increase in genetic variance, the estimated genetic correlation between ages 11 and 17 remained very high [0.95, 95% confidence interval (CI) 0.04–1.00 in females and 0.90, 95% 0.46–1.00 in males] and not significantly different from 1.0. Increasing genetic variance accompanied by high genetic correlations is consistent with a model of genetic amplification. McGue et al. (Reference McGue, Elkins, Walden and Iacono2005) previously reported this pattern for this sample when comparing ages 11 and 14, but the addition of age 17 data allowed us to explore these patterns further using growth curve modeling.
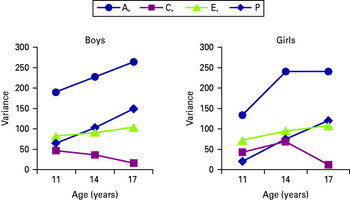
Parameter estimates from the growth curve model are presented in Table 3 and accounted for the distinct patterns of change in genetic and environmental variance components depicted in Fig. 2. Several aspects of this table are worth highlighting. First, the genetic covariance parameter (boys = 16.65, girls = 12.04) was positive and large compared to the genetic slope parameter (boys = 4.34, girls = 6.99) and the age-specific genetic residuals (all <5.0). The increase in genetic variance over time seen in Fig. 2 was thus primarily a result of the positive correlation between the genetic factors contributing to initial differences and those contributing to change. That is, genetic amplification was present. Second, the shared environmental covariance parameter was negative (boys = −29.34, girls = −22.11) and larger in absolute value than the corresponding shared environmental slope parameter (boys = 23.96, girls = 12.45), whereas the age-specific shared environmental variances were uniformly small (all <8.0). The decrease in shared environmental variance over time seen in Fig. 2 was the result of the negative correlation between the initial values and change. Finally, the non-shared environmental covariance parameter was negative (boys = −12.18, girls = −15.35) and smaller in absolute value than the corresponding non-shared environmental slope parameter (boys = 25.63, girls = 20.84), whereas the age-specific non-shared environmental variances were relatively constant across the three ages. The slight increase in non-shared environmental variance observed in Fig. 2 was a result of large non-shared environmental contributions to change (i.e. the slope), which more than compensated for the negative correlation between the initial values and change.
Unstandardized variance components derived from the growth curve model. Original unstandardized values of the biometric variance components derive from the parameter estimates from the growth curve model represented in Table 3. A, additive genetic component of variance; C, shared environmental; E, non-shared environmental; P, total phenotypic variance.

Growth curve parameter estimates for the Parent Environment Questionnaire (PEQ)
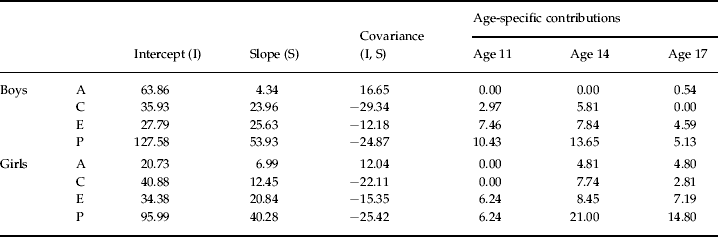
A, Additive genetic component of variance; C, shared environmental component; E, non-shared environmental component; P, phenotypic component.
The results are from the growth curve model for each biometric parameter (A, C, E), which sum to provide the complete phenotypic growth curve results (P).
Discussion
We identified a change in relationship quality between parent and child between ages 14 and 17 years. Although consistent with the results from other samples (e.g. Loeber et al. Reference Loeber, Drinkwater, Yin, Anderson, Schmidt and Crawford2000; Kim et al. Reference Kim, Conger, Lorenz and Elder2001), the observed deterioration (d of 0.05) was considerably smaller than that reported by McGue et al. (Reference McGue, Elkins, Walden and Iacono2005) in the same sample between ages 11 and 14. Throughout adolescence we observed increasing genetic influences on this relationship, accompanied by a decline in the importance of shared environment. The biometric changes occurred primarily because genetic factors that contributed to the initial phenotype exerted increasing influence on the phenotype over time, with the result that early individual differences on the phenotype due to genetic effects extended their influence over time. This pattern contrasted with the trend found for the broader phenotype and also the shared and unique environmental factors, each of which indicated that those with extreme initial parent–child relationships experienced less change than did those who had more average initial relationships. In the context of the deteriorating parent–child relationship over this period, this may indicate that those with particularly poor relationships at age 11 did not experience as sharp a deterioration in that relationship as did those whose relationship at age 11 had more warmth and involvement.
There are several important limitations to consider when interpreting the results of this study. First, the study involved only adolescent self-reports on their relationships with their parents. Thus, it is possible that part of the increase in heritability represents increasing roles of genetic factors in how individuals process, interpret and report their relationships with their parents, rather than changes in those relationships themselves. Self-report measures of parenting are only modestly correlated with measures based on direct observation (Holden & Edwards, Reference Holden and Edwards1989). Furthermore, because parent reports may be influenced by ideals of equal treatment for children and method-based reporting problems, previous work (Kendler, Reference Kendler1996) has found higher rates of reported concordance in parental behavior towards members of both identical and fraternal twin pairs, resulting in decreased estimates for genetic and unique environmental effects and increased estimates for shared environment when compared to estimates based on twin report. Nonetheless, the substantial support for the reliability and predictive utility of adolescent reports on the parent–child relationship (Elkins et al. Reference Elkins, McGue and Iacono1997; Metzler et al. Reference Metzler, Biglan, Ary and Li1998; Burt et al. Reference Burt, McGue, Krueger and Iacono2005) demonstrate the utility of such measures.
Second, the present study relied on child reports. If children become increasingly accurate reporters as they age, we would expect estimates of the E parameter, which includes both non-shared environmental effects and measurement error, to decrease with age. However, we did not observe decreases in E, and the two primary features of interest in the growth curve results (i.e. the negative covariance of slope and intercept for environmental components and the positive covariance of slope and intercept for genetic factors), suggest that the increase in estimated heritability was not due to a simple improvement in measurement.
Third, when interpreting the observed heritability increase it is also important to consider the finding in the context of theorized developmental changes in the nature of gene–environment correlation (rGE) processes during this time period. Early correlations between genotype and environment are generally due to the actions of parents, who actively shape their children's environments throughout the early years. As children age, their environments are shaped increasingly by responses to their behavior from people outside the home and eventually by the kinds of environments the children create or select for themselves (Scarr & McCartney, Reference Scarr and McCartney1983), thus shifting from correlation between A and C to correlation between A and E. Purcell (Reference Purcell2002) noted that the presence of any correlation between genes and shared environment will produce inflated estimates of C, whereas correlation between genes and non-shared environment will produce inflated estimates of A. Thus, an age-related decline in estimates for the importance of shared environmental factors and increasing importance of genetic influences is expected for any phenotypes that exhibit declining ‘passive’ and increasing ‘active’ or ‘evocative’ rGE processes with age. In the context of the marked increases in total variance for the parent–child relationship across adolescence, however, we suggest that the observed biometric trends are likely to represent more than an artifactual shift of this nature.
Fourth, with only three data points, growth curve models have limited power to distinguish linear from non-linear growth trajectories. Future work should seek to ascertain the forms of these parental relationship trajectories more precisely by including a larger number of time points.
Fifth, although the sample is representative of the Minnesotan population during the period in which the sample was born, it is more ethnically homogeneous than the US population (see Iacono et al. Reference Iacono, Carlson, Taylor, Elkins and McGue1999; Iacono & McGue, Reference Iacono and McGue2002). Several studies (e.g. Turkheimer et al. Reference Turkheimer, Haley, Waldron, D'Onofrio and Gottesman2003; Legrand et al. Reference Legrand, Keyes, McGue, Iacono and Krueger2008) have illustrated the need for caution in generalizing results from behavioral genetic studies into populations meaningfully different than that represented in the study.
With those limitations in mind, we believe the results presented here provide an intriguing window into the nature of the relationship between parents and their children. Our growth curve model shows that the increasing importance of additive genetic influences between ages 11 and 14, identified previously by McGue et al. (Reference McGue, Elkins, Walden and Iacono2005), is part of a continuing trend that shows further increases in genetic influences between ages 14 and 17. This took place in the context of generally deteriorating parental relationships and increasing overall variance in those relationships. This suggests that, in the earlier years, some of the quality of parental relationships may be maintained by the control parents are able to exert (and that the children essentially must accept) over their children's experiences and behavior. As children grow, however, they have more choice over their experiences and can more freely express their own reactions to the choices their parents have made for them, some accepting them readily and others less so. These two patterns may be related: if the parent–child relationship proceeds more smoothly when children are more accepting of the terms of that relationship offered by the parent, then we should expect that periods of high parental influence over the characteristic (indicated by high values for shared environmental influence) would be characterized by relatively positive relationships between parent and child. To the extent that the child's efforts to bring the relationship in line with their individual dispositions are resisted by the parent, an increased role for genetic influence on this relationship should be accompanied by greater levels of discord. As parents may differ in how easily they accommodate such efforts, future research should explore whether parents whose opinions on child rearing indicate greater resistance to such an accommodation witness a particularly steep decline in their relationship with their child throughout adolescence as a result of the increasing individualization identified in the present study.
With the growth curve model we also identified important trends behind the observed increase in heritability. Although variance due to additive genetic sources increased almost universally for both sexes at both intervals, variance due to shared environmental factors decreased markedly between ages 14 and 17. Furthermore, although variance due to non-shared environmental factors increased, it did so at a modest pace compared to additive genetic factors, leading to a decline in its importance when standardized. Of particular interest is that these trends were not the result of small environmental contributions to slope. Indeed, the contributions to slope were higher for environmental than for genetic factors. However, both shared and non-shared environmental factors had negative correlations between slope and intercept. This stands in contrast to additive genetic factors, for which the slope and intercept were positively correlated. We interpret these results as an indication that genetic effects are amplified in importance throughout development (Plomin, Reference Plomin1986).
The findings of increased heritability throughout development in this particular phenotype are consistent with two important and growing bodies of literature within behavioral genetics. The first of these was summarized by Kendler & Baker (Reference Kendler and Baker2007), who reviewed findings of genetic influence on environmental variables such as exposure to stressful life events (Kendler et al. Reference Kendler, Neale, Kessler and Heath1993), peer interactions (Walden et al. Reference Walden, McGue, Lacono, Burt and Elkins2004) and the family environment (Elkins et al. Reference Elkins, McGue and Iacono1997). Genetic effects of small to moderate size are consistently demonstrated for a wide range of purportedly environmental variables in this literature.
The present work also contributes to another more thoroughly explored vein of research, summarized by Bergen et al. (Reference Bergen, Gardner and Kendler2007), that notes the increases in heritability during development found across all domains examined to date. These include previous cross-sectional (Elkins et al. Reference Elkins, McGue and Iacono1997) and longitudinal (McGue et al. Reference McGue, Elkins, Walden and Iacono2005) work on this particular phenotype, in addition to a host of other psychological features such as IQ (McGue et al. Reference McGue, Bouchard, Iacono, Lykken, Plomin and McClearn1993b; Plomin et al. Reference Plomin, DeFries, McClearn and Rutter1997), social and political attitudes (Eaves et al. Reference Eaves, Martin, Heath, Schieken, Meyer, Silberg, Neale and Corey1997), personality (McGue et al. Reference McGue, Bacon and Lykken1993a) and religiousness (Koenig et al. Reference Koenig, McGue, Krueger and Bouchard2005).
Both of these research areas derive from long-standing conceptions of how genes and environments come to correlate over time periods during development; in particular, the above-noted concept of rGE (Scarr & McCartney, Reference Scarr and McCartney1983), in which the correlation between genotype and environment across development is increasingly a function of the expression of each person's own genotype. As many of the psychological features that are conventionally pictured as affecting or creating an individual's environment (e.g. an individual's level of agreeableness, extraversion or antisociality) are known to be significantly subject to genetic influence, genetic influence on environmental variables such as those examined here is not unexpected. Similarly, the increasing contribution of genetic factors to environmental variables as individuals age is expected under this framework, as genetic contributions to individuals' personalities and preferences become increasingly relevant as they become more able to influence their environments. The mechanism demonstrated by the growth curve model to be responsible for this process, the amplification of any initial differences due to genetic influences as children age, has a comparably sound theoretical footing (cf. Plomin, Reference Plomin1986) and, to our knowledge, the present study is the most direct demonstration of this process.
Acknowledgments
This work was supported in part by US Public Health Service Grants AA09367 and DA05147. We greatly appreciate the assistance of Minnesota Center for Twin Family Research (MCTFR) staff in this work and especially that of Dr G. Perlman.
Declaration of Interest
None.