Introduction
This article will detail the nature and quantities of nitrogen flows in livestock production farms. These flows have three specific features that distinguish them from large-scale farming nitrogen flows. The first involves the wide variety of inputs: inorganic fertilisers and inputs from the atmosphere, animal feed, animal bedding and symbiotic nitrogen fixation by legumes in open fields. The second is in situ recycling capacity: production of waste, storage and manuring. Finally, concerning output flows, exports in the form of animal products are generally lower per unit surface (hectare) than in the case of plant products and losses into the environment (NO3, NH4, N2O, N2, NO) and are in most cases higher than in the case of crops (whose nitrogen utilisation efficiency is higher). The relative importance of all these flows depends to a large extent on the type of livestock farming system in question. Work in this field clearly distinguishes farming systems qualified as ‘industrial’ (generally swine and poultry) from those ‘linked to the land’ (generally ruminants).
Scientific knowledge is classically described using increasing levels of organisation, from the animal (ingestion and excretion) up to the ‘animal production system’, with intermediate steps of the management of efluents, feed and the farm, the latter being the principal scale at which decisions are made. The largest body of knowledge concerns the scales of the animal and plots of land, although the relevance of managing flows involves higher levels, or broader scales, the last of which could be the geographic region in which the impacts are determined.
A summary table that concludes the article lists the principal information discussed.
Nitrogen efficiency at the scale of the animal
The nitrogen efficiency of an animal is usually the ratio of nitrogen output in products and input from feed. Efficiency depends on the stage of growth, characteristics of the animal (size, genetics) and the composition of its feed. In the case of young growing animals, we also speak of the nitrogen retention rate. The quantities of nitrogen excreted depend on the quantities ingested, estimated from the composition of feed and feed concentrates. If no analyses are available, we can refer to tables of feed values prepared for all livestock species (INRA-AFZ, 2004) and feeds (INRA, 2007). These tables also provide values of apparent nitrogen digestibility for all species and thus enable the detailed determination of the quantity of nitrogen excreted.
Swine
A fattening pig receiving feed containing primarily cereals and soybean meal retains about 30% to 35% of nitrogen ingested and excretes about 60% to 70%, almost three-fourth of which is in urine (Dourmad et al., Reference Dourmad, Rigolot and Jondreville2009). In piglets in the post-weaning period, that is, between 8 and 30 kg live weight, the retention efficiency of ingested nitrogen is higher (close to 50%), as proteins in feed given during this period are more digestible and better equilibrated. The nitrogen retention rate is lower in breeding sows (25% to 30%) and is intermediate in fattening pigs (35%). Is suckling piglets, the retention rate of milk nitrogen is very high, close to 90% (Dourmad et al., Reference Dourmad, Etienne, Valancogne, Dubois, van Milgen and Noblet2008).
Improving animal nitrogen balances involves reducing the excess protein supply via mainly two means. The first involves better adaptation of protein supplies to animal requirements depending on growth and physiological stage, potential of animals and production objectives. Excretion by sows is thus reduced by 20% to 25% when specific feeds are given during gestation and lactation. Nitrogen excretion by fattening pigs is reduced by about 10% when feed supplied during the finishing phase contains less protein, better suited to the animals’ needs. The second means involves better equilibrating the supplies of amino acids to be closer to the ideal profile of needs. In fattening pigs, a 35% reduction of nitrogen excretion was found after improving the amino acid balance (biological value) of the regimen, without affecting the appetite, feed efficiency or the body composition of animals. These reduction strategies, however, may increase the cost of feed logically hindering their use (Dourmad et al., Reference Dourmad and Le Mouel1995 and Reference Dourmad, Seve, Latimier, Boisen, Fernandez, van der Peet-Schwering and Jongbloed1999).
Poultry
Nitrogen flows and orders of magnitude in a poultry farm can be systematised in light of the predominantly standardised ‘industrial’ nature of poultry farms even if alternative breeding methods are developed for chickens and laying hens. Existing references are based on work done in 2008 (Mitran et al., Reference Mitran, Harter-Dennis and Meisinger2008) on a standard broiler chicken farm whose production cycle is 42 days. At the end of the cycle, 67% of nitrogen ingested is retained in the animals, 26% in bedding and 13% in atmospheric nitrogen emissions, primarily NH3. For laying hens, nitrogen balance flows determined recently (2011) in hens smaller than French laying hens provided the following orders of magnitude: for a mean ingestion of 3 g of nitrogen/day, 20% are retained by the animal, 33% are exported into eggs and 65% are excreted in droppings. A well-balanced diet significantly increases the retention rate of ingested proteins as several studies have shown a reduction of nitrogen excretion of up to 40% (Neijat et al., Reference Neijat, House, Guenter and Kebreab2011).
Excretion values vary considerably, however, depending on the organisation of the building, on feed, the species and lines. Estimations of final nitrogen efficiency also differ depending on the reference unit. Thus, life cycle analyses have shown that a standard chicken discharges much less nitrogen in excretions per kg produced than ‘designated broilers’ in the French system (16 v. 26 g on average), but the opposite result is obtained for livestock farming systems when the data are expressed per farm or per unit surface (Da Silva et al., Reference Da Silva, van der Werf and Soares2010). Laying hen farms are also large producers of excreta in view of their size.
Cattle
Average nitrogen efficiency in ruminants is lower than in monogastric species and on average varies from 0% to 35% depending on the type of production. It is minimal in animals in an ‘upkeep’ state such as dry cows, varies from 8% to 20% to 22% in growing and finishing animals, and is highest in lactating dairy cows, at 20% to 35%. As a result, most of nitrogen ingested (up to the totality) is excreted by the animal in dung (Estermann et al., Reference Estermann, Sutter, Schlegel, Erdin, Wettstein and Kreuzer2002; Marini and van Amburgh, Reference Marini and van Amburgh2005).
As for monogastric animals, nitrogen excreted varies above all with total quantities of dry matter (DM) in ingested feed, with the size of the animal and the level of production, especially in dairy cows (Delaby et al., Reference Delaby, Peyraud and Vérité1995). The authors agree when stating that the more a cow produces, the less nitrogen is excreted per tonne of milk produced, which is the expression of improved nitrogen efficiency for elevated production levels. Nitrogen waste per tonne of milk thus decreases by 5%/1000 l of milk on average. At the scale of the farm, however, this conclusion no longer holds as an increased production level is generally accompanied by a higher rate of herd renewal and thus a larger number of heifers; feeding practices are also less stringent in order to maintain a high level of production per cow and include more manufactured compound feeds. At the scale of the cattle industry, other compensations are involved: increased milk production per animal leads to a reduced herd size, thus fewer cull animals and less associated meat; the suckler herd compensates this decrease but its nitrogen efficiency is lower than that of the dairy herd (Faverdin and Peyraud, Reference Faverdin and Peyraud2010).
The nitrogen content of animal feed is another factor that determines nitrogen efficiency. In all ruminants, the nitrogen content influences the quantity of nitrogen waste in proportion to the nitrogen supply being higher than rumen microbial needs for degradable nitrogen and the amino acid needs of the animals. These excesses reduce the efficiency of nitrogen utilisation and increase the risks of ammonia emissions. This is why a large number of publications have proposed reducing the proportion of pasture grass in ruminant feeds in favour of a maize ensilage diet (feed depleted in proteins) and a supplementation with soybean concentrates (van Vuuren and Meijs, Reference van Vuuren and Meijs1987; Valk, Reference Valk1994). This is relatively effective from a strictly nutritional standpoint, but is less so towards the environment, as grazing is an effective means for recycling and/or storing nitrogen. The review of a large number of tests conducted in dairy cow farms has shown that it is also essential to consider the equilibrium between metabolisable protein supplies and energy supplies. A supply 10% higher than optimum needs leads to a minimal increase in production (<0.5 kg milk/day) but increases nitrogen waste up to 20 kg/year. In the 1970s, INRA in joint work with several companies had developed a process of tanned proteins (principally soybeans and canola, also called rapeseed) that augments their metabolisable protein value (+70% for soybeans). It thus permits to reduce the nitrogen content of feed without affecting animal performances.
The international literature contains few publications on suckler cow herds. Suckler (beef) cows are less efficient than dairy cows, in particular because of their low milk production (Table 1). This production, located in France primarily in the Massif Central, is generally much less intensive than dairy cow production systems and is a larger consumer of pasture. Nitrogen balance excesses are thus much lower in suckling regions than in those producing milk (see Donnars et al., Reference Donnars, le Perchec, Girard, Guillaume and Réchauchère2014, in this issue).
Rates of nitrogen efficiency in cattle depending on the type of animal

Marini and van Amburgh (Reference Marini and van Amburgh2005), Micol et al. (2003), Peyraud et al. (1995), Castillo et al. (2000).
Fate and management of nitrogen flows in livestock farm effluents
Nitrogen in urine is composed of a high proportion of urea (or uric acid for poultry) that is rapidly transformed to ammonia and thus volatile (Portejoie et al., Reference Portejoie, Dourmad, Martinez and Lebreton2004). Faecal nitrogen is a more complex proteinaceous form and is mineralised more slowly. Aside from direct restitution by grazing, the two forms are mixed and nitrogen transformations and leakage from excreta depend on how effluents are managed. According to livestock farming system techniques and animal species, waste is liquid (liquid manure), solid (dung) or excreted while grazing. Schematically, liquid manure is obtained from systems involving slatted floors or scraping, in which no bedding is used. The resulting product is composed primarily of animal urine and faeces plus uneaten feed and water used for washing. In the case of solid manure, on the other hand, in addition to urine and faeces, bedding (straw, sawdust, wood chips, etc.) is an additional component. During the phases of collecting and storing of liquid manure, transformation conditions are mostly anaerobic (except if a specific treatment such as aeration is used), whereas the porosity of solid manure enables a supply of oxygen that creates partially aerobic conditions. Transformations of nitrogen are thus very different for the two types of excreta, but for the most part, both end up being applied to croplands for purposes of fertilisation and soil improvement. When excreta are applied to land to fertilise crops, nitrogen transformation depends primarily on agricultural conditions.
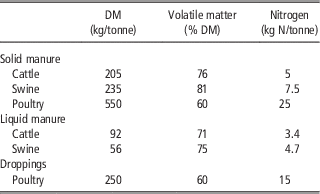
The quantities of nitrogen in liquid and solid manure are highly variable depending on the characteristics of the excreta and the species (Table 2). For the same type of excreta from the same species, the lack of uniformity is related to livestock farming system practices (type of building, management of bedding and/or removal of liquid manure, feed, how water is given, etc.).
Average characteristics of different excreta per animal species

DM=dry matter.
Gac et al. (Reference Gac, Béline, Bioteau and Mague2007).
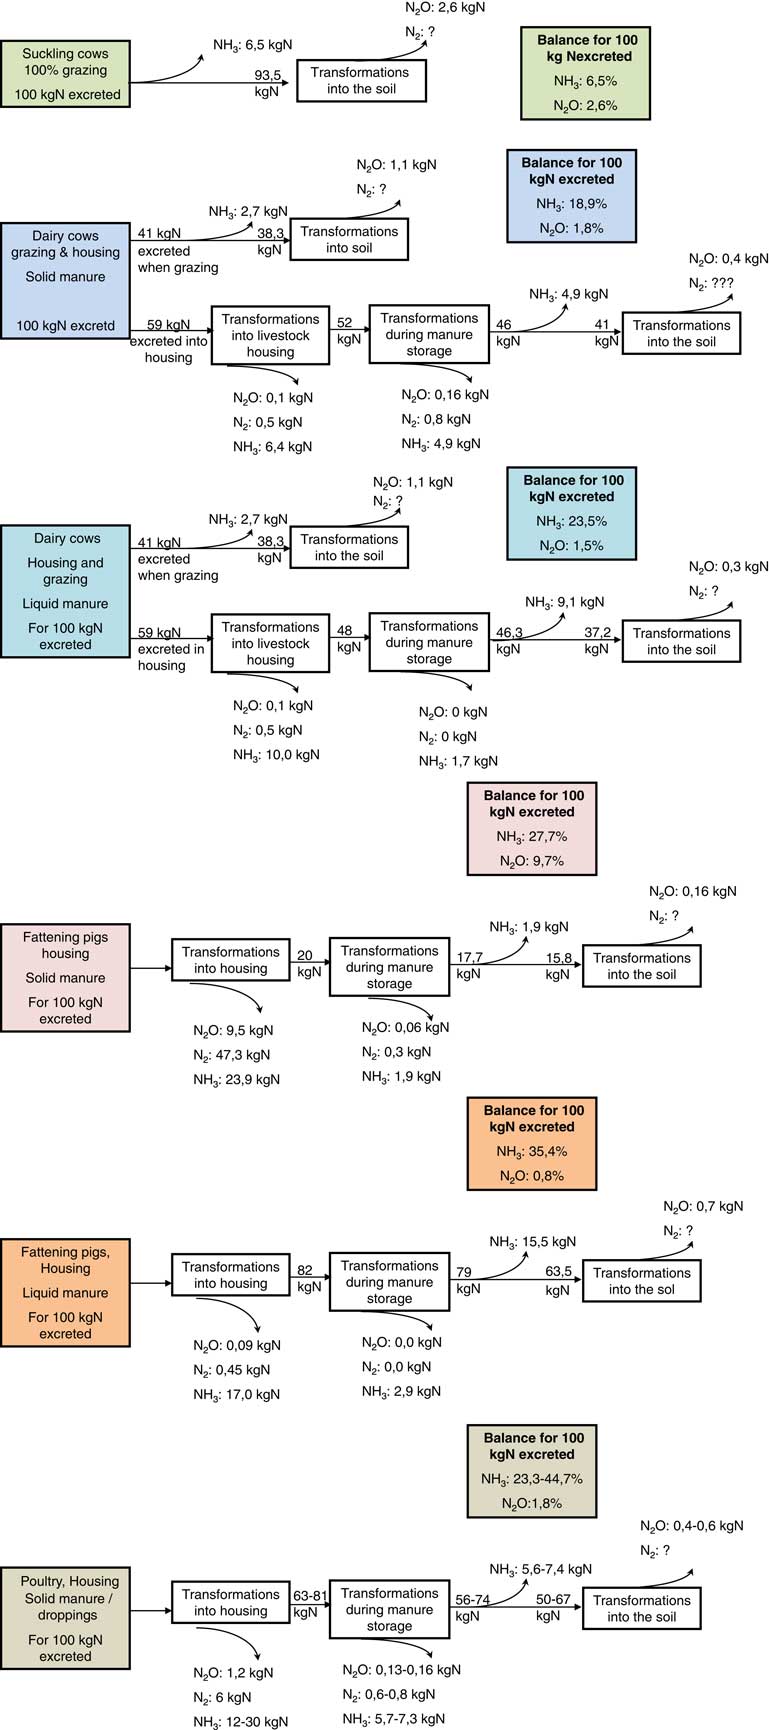
In France, the mean nitrogen flows and gaseous losses have been estimated between the production of excreta and their final destination in the soil, based on a literature search of 324 national and international references published in 2005 to 2006 and discussed below (Figure 1).
Fate of excreta and associated losses in several animal production systems (after Gac et al., Reference Gac, Béline and Bioteau2006).

Fate of nitrogen in pig livestock farms
In France, pig manure accounts for 10% to 12% of total nitrogen excreted by livestock farming systems.
Managing pig excreta in the form of liquid manure involves 80% of French pig farms, the alternative being dung mixed with straw or sawdust animal bedding. Considerable differences (in contrast to cattle) exist between liquid and solid manure, in particular levels of N2O emissions, which is higher for solid manure. Uncertainty on gas flows remains very high, with coefficients of variation for different emission factors of the order of 100% for both N2O and NH3 (Rigolot et al., Reference Rigolot, Espagnol, Robin, Hassouna, Béline, Paillat and Dourmad2010a and Reference Rigolot, Espagnol, Pomar and Dourmad2010b).
In the case of liquid manure, nitrogen losses occur primarily as ammonia emissions. The European Environment Agency (EEA-EMEP/CORINAIR, 2007) has established references for calculating ammonia emissions that are consistent with results obtained from French swine installations with slatted floors and liquid manure. If these emissions are expressed as a function of nitrogen excreted, emissions in livestock housing are 22.4% (25% for Corpen) (Corpen, 2006) and 10.4% during storage (5% for Corpen), for total losses of 30.5% (28.5% for Corpen). The value proposed by the GIEC (2006) for total emissions is a bit lower (25%) with a range of variation between 15% and 30%. N2O emissions are low for liquid manure (<1% and primarily when returning to the soil). The GIEC counted only losses on the surface of slatted floors by nitrification in aerobic conditions. The reference adopted by the GIEC sets down a loss value between 0% and 0.4% for liquid manure (default value 0.2%), which seems somewhat low in comparison with published values.
In the case of animal bedding
In this case, the porosity of the substrate and the availability of carbon and oxygen enables nitrification and denitrification reactions to occur that cause substantial emissions of non-reactive N2 but also of N2O. Losses vary from 1% (accumulated bedding without mixing) to almost 10% (accumulated bedding with regular mixing) and emissions occur primarily inside livestock housing. Emissions of NH3 are close to 28% and depend mainly on the humidity of the bedding. The relative importance of these various emissions depends on litter management and especially the animal density, and the temperature and moisture of the bedding and its aeration.
Estimation of nitrogen losses in French pig production
Based on the above information, it is possible to determine a mean nitrogen flow for the principal types of pig production in France. The total excretion from a farrow-to-finish farm with 100 sows producing 2290 fattening pigs per year is 12 tonnes of nitrogen of which about 17%, 11% and 72% are excreted from sows, piglets and fattening pigs, respectively. When the various gaseous emission factors discussed above are taken into account, it becomes possible to estimate the fate of nitrogen excreted by this farm all the way to manuring, depending on whether or not the pigs are raised on slatted floors or on bedding. In the case of slatted floors, N emissions in the form of NH3 before manuring account for 26% of nitrogen excreted and emission in the form of N2O accounts for 0.4%. In summary, about 70% of nitrogen excreted is in the form of manure and is thus potentially recyclable. In the case of bedding, the proportion of emissions in the form of N2O (about 5% of N excreted) and above all emissions of N2 (30%) are much higher and a bit less than half the nitrogen excreted can be applied as manure. The risks of losses when manuring vary as a function of the inorganic content of waste, being twice as high for liquid manure than for solid manure. This would tend to re-equilibrate losses between the two types of excreta management. The mechanisms of manuring are thus very important in the case of liquid manure (weather conditions, ploughing in, etc.) (Aarnink and Elzing, Reference Aarnink and Elzing1998; Bonneau et al., Reference Bonneau, Dourmad, Lebret, Meunier-Salaun, Espagnol, Salaun, Leterme and van der Werf2008a).
Fate of nitrogen in poultry farms
In France, poultry production accounts for a smaller proportion of nitrogen excretions compared with ruminants and swine: 8% of nitrogen excreted according to the CITEPA. On the other hand, laying hen production systems are large nitrogen emitters because of their size.
There are many factors contributing to the variation. The quantity of excreta per unit of product depends on the species, the strain and whether animals grow rapidly or slowly. The nature of feed affects the state of bedding (quantity and type of starting materials, water). The nature of the bedding plays a role in changes of nitrogen content. Environment conditions in the building (humidity, temperature and ventilation) affect primarily the volatilisation of ammonia. Quantification based on measurements in a rapid growth broiler building gave an emission value of 5.74 g N/chicken for the entire growth period, with no emission of N2O (Guiziou and Béline, Reference Guiziou and Béline2005). Volatilisation led not only to a loss of organic fertiliser, but also resulted in high ammonia levels inside the building, which has adverse effects on the well-being of both the animals and workers. Finally, the use of ‘abatement factors’ such as animal bedding activators (micro-organisms) can favour certain chemical reactions and substantially reduce ammonia emissions. The removal and drying of droppings also leads to considerable decreases of ammonia losses compared with deep cesspools for obtaining liquid manure. One study reported that for a farm containing 60 000 chickens, this process reduced the ammonia emission factor by 61%, but transport led to increases of energy costs.
Estimation of nitrogen losses in French poultry production
Regulatory reference values (Corpen, 2006) for losses and expressed as percentage of nitrogen ingested. For farming systems managing waste in the form of solid manure, losses are 17% in poultry housing, 6% during storage and 3% when manuri;the figures are 30%, 6% and 5%, respectively, when waste is in the form of liquid manure.
Fate of nitrogen in cattle farms
In France, cattle manure account for two-thirds of nitrogen excreted by livestock farming systems (71%: CITEPA, 2011) with substantial regional variations (about 50% of organic N in Brittany and 97% in humid mountainous regions). The bovine sector is thus by far the leading emitter of nitrogen into the environment.
By combining different feeding sequences, it is possible to determine annual nitrogen excretions from a herd and their site of restitution (building, plot of land) depending on the proportion of grazing in the herd’s diet. Nitrogen emitted inside dairy housings accounts for 50% to 100% of the total excreted (depending on the proportion of grazing). The building is thus a strategic target for reducing nitrogen losses. The issue of ammonia emissions in livestock housing has been addressed less in the case of bovine livestock farms than pig farms, but the number of publications on this subject is increasing rapidly. Experimental measurements of these flows encounter a number of difficulties (large and open livestock housing) and still involve many uncertainties. Emission factors in this sector are thus just as imprecise as in other livestock farming systems.
Most work agrees that feed and temperature are two major factors influencing ammonia emission in cattle stables (as in housed pigs). The quantity of urinary nitrogen excreted is the leading factor of ammonia emissions with an amplitude of 1 to 5 depending on the feed, for the same level of nitrogen transfer to milk. In addition, NH3 emissions are proportional to temperature. The type of animal housing also affects emissions. When animals are tethered and solid manure is removed at regular intervals (Austria, Canada, the United States), emissions are lower than in facilities where animals are free to move.
Emissions of N2O inside livestock housing remain poorly understood. Initial results indicate that they are of the order of 0.5 to 0.6 g per cow and per day but these results remain to be confirmed.
Estimation of nitrogen losses in French cattle production
When the entire cattle system is considered, nitrogen losses expressed as percentage of nitrogen excreta are of the order of 19% to 23% in the form of NH3 and about 1.5% to 1.8% for N2O, there is little difference between liquid and solid manure, but there are substantial differences concerning the sites of emissions: relatively more volatilisation inside housings for liquid manure, and more in storage for solid manure (Delaby et al., Reference Delaby, Peyraud and Vérité1995).
Treatments of animal effluents
In addition to conventional steps in the management of animal droppings, we can add treatments that affect the properties of waste and the leakage potential of NO3−, NH3, N2O and NOx directly during treatment and indirectly when products are used in the field. These treatments consume energy and occasionally require additional inputs. Methanation (anaerobic digestion) can cover a part of this energy need of the system and can be an integral part of the overall treatment system.
Phase separation
There are several systems for phase separation of liquid manure, of which the most effective is the centrifugal decanter, as it retains about 14% of total mass, 60% of DM, 70% of phosphorus and 30% of nitrogen. Direct gaseous emissions are negligible and energy consumption is of the order of 2 to 5 kWh/m3. Phase separation provides two products that can be managed differently (and potentially better), with the possibility of exporting the solid phase as fertiliser to other agricultural regions: a solid phase with total nitrogen and phosphorus concentrations 2 and 4 to 5 times higher than those of the starting product, and a liquid phase (<2% DM) with nitrogen primarily in the form of ammonia (85%) (Hjorth et al., Reference Hjorth, Christensen, Christensen and Sommer2010).
Bacterial treatment
Bacterial treatment involves continuous treatment of liquid manure for 30 to 40 days in a bioreactor. Alternating phases of aerobiosis (supply of oxygen) and anoxia (absence of oxygen) coupled with cyclic supplies of liquid manure maintain the microbial flora that carry out nitrification and denitrification processes inside the bioreactor. This technique is used mostly for pig slurry and eliminates about 60% to 70% of nitrogen entering the system, primarily in the form of N2 by nitrification–denitrification. This N2 emission is not directly polluting as the nitrogen molecule is not a reactive form but reflects the loss of reactive nitrogen and thus of energy. N2O emissions are low if treatment conditions are correctly selected but may become high (up to 18% of nitrogen entering the system) when conditions are unsuited. Work has thus shown that the use of a bacterial treatment unit can lead to a 30% to 50% reduction in overall NH3 emissions from excreta (Béline et al., Reference Béline, Daumer and Guiziou2004).
Composting
Composting involves the controlled decomposition of animal waste to eliminate easily biodegradable organic matter and to transform residual organic matter to stable molecules similar to those characteristic of moist organic matter (humus). In order for aerobic decomposition processes to run correctly, an air supply is necessary and causes a temperature increase. This activates drying of the product and favours its purification, but also causes the loss of a fraction of the most volatile compounds, particularly those containing nitrogen. In the course of composting, mineralisation of organic matter leads to losses of organic carbon that can reach 50% to 70% and inversely concentrates inorganic elements (N, P, K) in composts compared with the starting products. Composting leads to nitrogen losses that are substantial but above all highly variable, depending on the extent of process control: they have been estimated at between 30% and 60% of input nitrogen and are primarily in the form of NH3 (up to 90% of losses), but also N2O (1% to 6%) and NO. The bottom liquid layer is rich in soluble nitrogen (nitrate, dissolved organic nitrogen) that can be leached. Although these losses are negligible in a well-run composting process, they can account for 10% to 20% of the initial quantities of nitrogen when the composting process is poorly controlled. Losses in the form of N2 are calculated primarily by difference and are relatively low. In addition, compost does not produce foul odours, which is an asset for its transport (Larney and Hao, Reference Larney and Hao2007; Bernal et al., Reference Bernal, Alburquerque and Moral2009; Szanto, Reference Szanto2009).
Anaerobic digestion
Anaerobic digestion (methanation) is a continuous biological process for waste treatment conducted in a digester in the absence of oxygen. Anaerobic conditions enable the development of a specific microbial flora that ensures the degradation of a portion of organic matter into CH4 (methane) and CO2. It now becomes possible to recover methane in the form of usable energy. This process reduces methane emissions arising from the management of excreta as it can be recovered. The impact of methanation on nitrogen, however, is low as nitrogen is unaffected by methanation and is conserved quantitatively. In all cases, the risks of NH3 emissions during storage and spreading of the digestate are high because of a higher pH and ammoniacal nitrogen concentration resulting from methanation (Bernet and Béline, Reference Bernet and Béline2009).
Use of nitrification inhibitors for liquid manure
The leading source of inorganic nitrogen in animal effluents is NH4+ from the decomposition of faeces and the hydrolysis of urea excreted by livestock production animals. In farms where excreta are managed as liquid, this nitrogen remains as ammonia as a result of anaerobic storage conditions. The prevention of oxidation of this nitrogen after it enters the ground prevents not only emissions of N2O resulting from its nitrification, but also those produced by denitrification, thereby avoiding production of its substrate (NO3−). Several nitrification inhibitors have been proposed to this end. The use of these inhibitors when spreading liquid manure is not yet common practice in France, this is because of their elevated cost and a short period of activity. Some publications have also referred to issues of phytotoxicity and environmental impacts. These inhibitors have been extensively studied in New Zealand, where their potential for use in grazing land is high (Zerulla et al., Reference Zerulla, Barth, Dressel, Erhardt, von Locquenghien, Pasda, Radle and Wissemeier2001).
Acidification of liquid manure
The acidification of liquid manure shifts the NH3–NH4+ equilibrium towards NH4+ and thus limits the potential for volatilisation. In general, a pH of 6 is sufficient to reduce NH3 emissions by at least 50%. Acidification is used little for reasons of cost and safety.
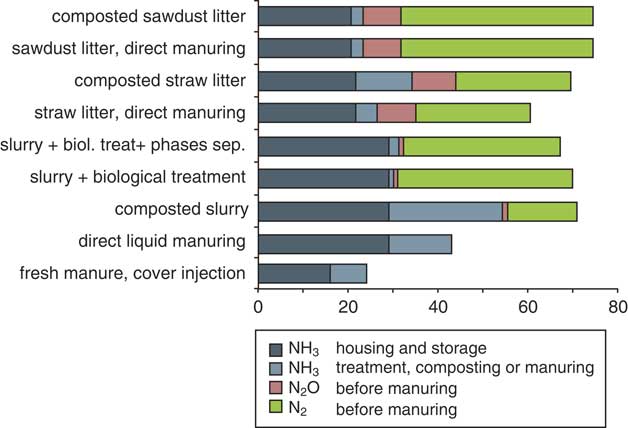
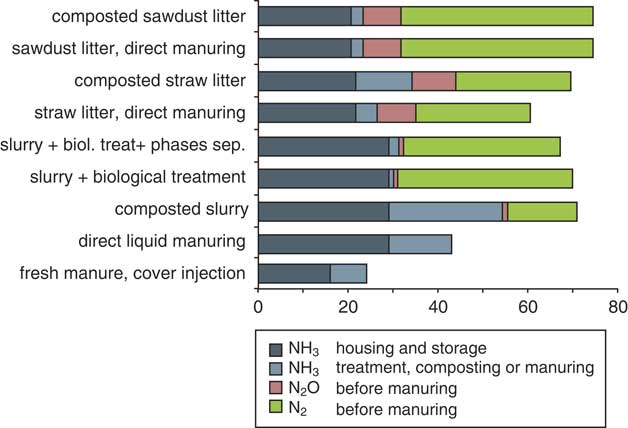
Figure 2 shows the variations and forms of losses depending on the mechanisms of animal waste management. It is seen that they vary considerably depending on treatment mechanisms and that biological treatment of liquid manure evidently produces a large quantity of non-reactive molecular nitrogen thus non-polluting, but at the same time limits possibilities of agricultural recycling. The proportions of NH3 losses inside livestock housing and during storage are discussed in more detail below.
Influence of mechanisms of managing pig waste on nitrogen losses (in % of nitrogen excreted) (after Bonneau, Reference Bonneau2008).
Nitrogen losses during storage and from application of animal manure in fields
Volatilisation of ammonia
There is currently no proven technique to reduce NH3 emissions during the storage of solid manure from pigs and cattle. On the other hand, in the case of liquid manure, it is possible effectively to reduce emissions from storage containers by reducing air circulation on the surface: covered pit or a floating cover on the pit that leads to the formation of a crust, reducing the surface of the storage pit per unit volume.
When manuring fields, emissions vary as a function of the composition of the liquid and solid manure, in particular their DM and nitrogen contents, of the application mechanism, the weather and the soil. There are two means to reduce the contact surface between the waste applied and air: localised application techniques (tractor spraying) for liquid manure can reduce NH3 emissions by 25% to 35%. Ploughing in immediately or rapidly after spreading solid and liquid manure, or injecting liquid manure into the soil can reduce emissions by 70% to 90%. As the effectiveness of these measures depends on conditions at the time of manuring, variation is substantial. Reducing NH3 emissions concomitantly increases the quantity of nitrogen that can be absorbed by plants. This explains the necessity of adjusting the quantities of inorganic nitrogen fertilisers in the fertilisation plan. If the reduction of losses is included in the nitrogen balance of the crop, this could result in substantial economic savings that largely or even totally cover the additional costs of localised manuring or ploughing in (Maguire et al., Reference Maguire, Kleinman, Dell, Beegle, Brandt, McGrath and Ketterings2011). In order to optimise this recycling method, it is essential to manage the production of waste with the greatest value and leading to a minimum of losses, thus avoiding the production of soft solid manure (very low straw content) that is difficult to spread, and of liquid manure with too much straw. Good management is thus partly based on the design of livestock housing and overall management of livestock farming systems.
Emissions of N2O by agricultural soil receiving livestock farm waste
It has been estimated that N2O emitted by agricultural soil in France accounts for 85% of all agricultural sources of N2O (CITEPA), the principal source being biological denitrification. About one-third arises from transformations of nitrogen after manuring with livestock farm waste (two-third from inorganic fertilisers). Manuring is thus the principal source of N2O, even if upstream emissions are not negligible. Surface spreading or injection has little impact on the emission of N2O (even increases it) because of the subsequent deposit of volatilised nitrogen that must be added to the balance in the first case. The physical conditions of the soil (temperature and aeration) affect N2O production, as does the utilisation of nitrogen by plants. Nitrification inhibitors acting on microbial flora can limit N2O emissions (Bouwman et al., Reference Bouwman, Boumans and Batjes2002; Rochette et al., Reference Rochette, Worth, Lemke, McConkey, Pennock, Wagner-Riddle and Desjardins2008).
Losses by leaching
Leaching occurs chronologically after most of the gaseous losses discussed. It depends on the quantity of soluble nitrogen present in the soil during the drainage period, on the drainage layer and on the presence or absence of plant cover that can immobilise all or part of available nitrogen. Considerable work in the 1980s and 1990s on the bioavailability of nitrogen showed that manuring with livestock production waste did not cause additional losses compared with inorganic fertilisers, at the scale of about 15 years, provided that supplies are rational with respect to plant needs (fractionated applications in the spring) and that in the autumn, before the drainage period, manuring with waste having highly available nitrogen (liquid manure) is avoided. In the case of rotated crops fertilised with liquid manure, leaching can be limited by the presence of cultures absorbing nitrogen during this period or of non-fertilised NFIC (nitrogen cash crops) (McNeill et al., Reference McNeill, Eriksen, Bergstrom, Smith, Marstorp, Kirchmann and Nilsson2005; Leterme and Morvan, Reference Leterme and Morvan2010).
Agricultural recycling of livestock farm waste
One of the key points for optimising the use of nitrogen involves managing waste, from production to manuring, combined with the choice of the culture system, how the soil is ploughed and the local climate.
Nitrogen efficiency of manure in the short term (crop cycle or year)
Considerable work, conducted in controlled conditions in the laboratory or fields, has shown a high degree of variability of the nitrogen fertilising value of manure in the short term (scale of the year). Bioavailability of nitrogen corresponds to nitrogen that is rapidly mineralised by the biodegradation of organic matter in waste. In spite of much work done on mineralisation of organic matter, of the soil or of waste, only a handful of software models the dynamics of fertiliser mineralisation: fertilisation assistance tools (Azofert, e.g. Machet et al., Reference Machet, Dubrulle, Damay, Duval, Recous and Mary2007), flow models (STICS, TNT2) or environmental evaluation (Melodie, Syst’N, in the process of finalisation, Agrotransfert Territ'eau; Faverdin et al., Reference Faverdin, Chardon, Rigolot, Baratte, Raison, Piquemal, Martin-Clouaire, Rellier, Le Gall, Dourmad, Leterme, Paillat, Delaby, Garcia, Peyraud, Poupa, Morvan and Espagnol2011). Prediction of the nitrogen fertilising value is generally based on classifying per ‘type of product’, for example, solid pig manure, liquid pig manure, cattle dung, etc., with high values for most liquid wastes and poultry droppings and solid manure, low values for composted waste, and intermediate values for bovine and pig solid manure. Even though several measurement tools exist, for example, Quantofix, and software that provides references, the farmer is generally faced with variability of their organic matter composition and forms of nitrogen with varying degradation properties, without mentioning other major and trace elements (N, P, K, S, Mg, Ca, Na, etc.), organic and biological micro-pollutants and metallic traces. The application of animal manure is limited by their N/P ratio (4 : 1 to 5 : 1) that is different from that of cultures (6 : 1 to 8 : 1), thus favouring the accumulation of phosphorus in soil where livestock farm manure are applied repeatedly. The same comment is applicable to composted products whose N/P ratio is low since composting eliminates nitrogen via gaseous emissions.
Medium-term effects of effluents on the storage of carbon and mineralisation of nitrogen
Supplying organic matter by waste increases the carbon stock of soil. Recent work on a review of national data has refined the estimation of the proportion of stable carbon in waste (Lashermes et al., Reference Lashermes, Nicolardot, Parnaudeau, Thuries, Chaussod, Guillotin, Lineres, Mary, Metzger, Morvan, Tricaud, Villette and Houot2009). It was found that the rate of mineralisation of residual organic matter in waste decreases rapidly over time. A review article cited rates of mineralisation varying from 2% to 18% in year 2, and from 1% to 7% in year 3.
Nitrogen flows depending on fodder and cropping systems associated with livestock farming systems
Pastures are good nitrogen recyclers
Grazing is specific of herbivore livestock systems. Practically all ruminant production systems use pastures even if their annual contribution to feeding is variable depending on how intensive the system is and on the region of livestock farming systems, as well as the pasture’s status: permanent or planted, grazed or harvested.
Results of recent work (Delaby and Journet, Reference Delaby and Journet2009) have provided a new assessment of the efficiency of grazing concerning nitrogen matter. The quantities of nitrogen excreted by grazing cattle varies from 150 to 500 kg of N/ha depending on the load (number of head) and the length of the grazing season (they increase by 70 kg, of which 80% is urine, per additional 100 days of grazing). Nitrogen returns are spread directly by the animals, separately for urine and faeces, but above all non-uniformly over the surface. The quantity of nitrogen deposited by cattle manure is low but concentrated over a very small surface (nitrogen relatively non-leachable); the surface affected by runoff and infiltration of urine is much larger. For example, in the case of a load of 2.5 cows/ha during 200 days of grazing, about 3% to 5% of the surface is covered by solid manure and 35% to 40% by urine, with little or no overlap.
Changes of urinary nitrogen are rapid and depend on the period of emission. Losses of NH3 by volatilisation occur primarily within 48 h. In spite of the high variability related to the context of each experiment, the annual fate of nitrogen from urine is broken down as follows: 25% to 30% organised in the soil, 30% to 35% used by plants, 25% to 30% lost by leaching, and for gaseous losses 10% to 15% as ammonia and at most 5% as N2O and N2. Less work has been done on the fate of nitrogen in solid manure. According to the scientific literature, it can be shown that on an annual basis, the distribution of faecal nitrogen emitted while grazing is: 60% to 70% integrated in the organic matter of the soil, 10% to 20% used by plants, 5% to 10% lost by gaseous emissions and 10% to 15% by leaching.
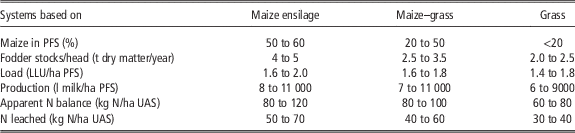
It is thus seen that in spite of the large quantities of nitrogen supplied locally by grazing animals, there are many pathways by which this nitrogen is used: by the pasture plant cover that is active, as herbivores graze during the same period as plant growth, by well-implanted pastures and by soil that can include a large proportion of this excess nitrogen in organic form. In addition, and except for special situations, gaseous losses are low compared with when animals are fed inside buildings. A comparison of livestock farm systems (optimised) that differ by the proportion of maize and grass in animal diets shows a trend to lower nitrogen losses for systems that rely more on pastures. Farms using a large proportion of permanent pastures minimise the risk of leaching associated with crop management for three reasons: animal density is often lower, nitrogen efficiency is higher when grazing and there are no bare soils (uncovered by crops) (Table 3).
Summary of environmental performance in dairy farms (typical in western France) depending on the fodder systems (dairy cows yielding 7000 l/year, with equivalent complementation)

Many European countries including Ireland, The Netherlands, Denmark, Germany, etc. have considered this recycling and consequently have waived the organic nitrogen supply ceiling from 170 kg N/ha per year in the context of the Nitrates Directive to 230 or 250 kg N/ha per year for grassy surfaces, provided they account for a large proportion of UAS (often from 70% to 80%). These systems are widespread in northern Europe and involve harvest for stocks and for feeding zero grazing animals, at the same time as managing and recycling large quantities of waste.
Controlling the risk of leaching from pastures
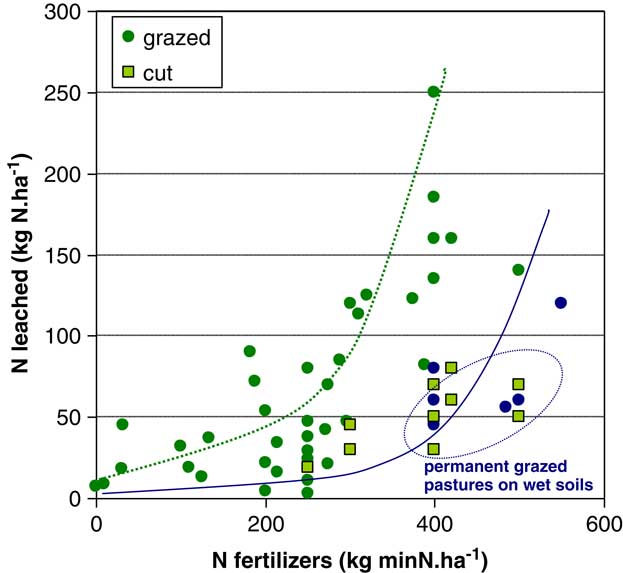
Losses by leaching first increases slowly and then more rapidly when fertilisation is greater than 250 to 300 kg/ha per year, but with high variability depending on soil and climate conditions (Figure 3). Highly fertilised temporary pastures thus have a higher risk, explained by the fact that fertilisation increases both productivity, thus the number of grazing days per hectare, and the nitrogen content of grass consumed by the animals strategies (Simon et al., Reference Simon, Vertès, Decau and Le Corre1997; Vérité and Delaby, Reference Vérité and Delaby1998; Schils et al., Reference Schils, Olesen, del Prado and Soussana2007). Effluents then increase rapidly with nitrogen fertilisation. The risk of leaching is lower for extensively or moderated grazed pastures, or those used for both grazing and harvest (Table 4).
Nitrogen losses in pastures depending on animal density from Vertès et al. (Reference Vertès, Simon, Giovanni, Grignani, Corson, Durand and Peyraud2008). For manure inputs, N fertilisers is expressed in mineral N equivalence.

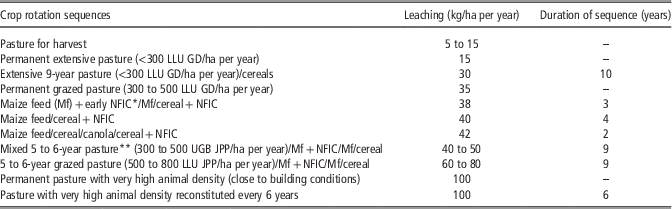
Examples of standardised loss levels for usual crop rotation sequences

Western France context: rainy climate, winter drainage layer>400 mm (http://agro-transfert-bretagne.univ-rennes1.fr/Territ_Eau/).
* NFIC planted under cover or after maize harvest before 1 October.
** Mixed=harvested+grazed.
Losses by leaching also arise from frequent ploughing of temporary pastures. Reference values of losses have been established for different crop successions, involving a variable proportion of pastures used more or less intensively (Table 4). Losses are minimal for permanent pastures harvested (5 to 10 kg/ha), followed by long-term pastures used moderately (extensive or alternating harvest and grazing): 15 to 25 kg N leached/ha per year, values also reached with optimal crop rotation management and including effective NFIC. Losses increase for pasture–crop rotations and depending on the animal load up to values reaching 45 to 60 kg N/ha per year. Even higher values are reached in situations where good practices are lacking: high animal density, even ‘parking’ plots for pastures, over-fertilisation and ground with practically no crop cover (late NFIC, winter cereals). These references are used to assess risks of leaching at the scale of catchment basins.
The question of comparative productivity between temporary pastures, permanent pastures and surfaces planted with maize remains open as intensive systems do not support a decrease in grass production (even for a short period). Many attempts have been made, including in ‘intensive’ western France, to develop forage systems that increase the proportion of long-term or permanent pastures combined with a reduction of inputs. The durability and productivity of temporary pastures are currently topics of research, in particular in sensitive areas for water quality.
Other environmental benefits of pastures
Pastures have other environmental advantages, including the reduction in risks of erosion because of their highly developed root systems and permanent plant cover, the overall reduction of pesticides and storage of carbon and nitrogen in soil. Pasture fodder systems thus can reduce the carbon footprint of meat and milk produced. Finally, pastures are generally found in landscapes with hedgerows, embankments and ditches that are habitats or feeding areas for many animal species using grass cover. These environmental effects are well described for long-term pastures managed with low inputs. But there are less described for pastures included in crops rotations. In spite of these advantages, pasture land has decreased by more than 3 million hectares since the 1970s (source: Eurostat, 2009), in particular, because there has been less support for this by the CAP than for maize. Pastures are often less productive and because many livestock farmers see its management as complicated and associate it with a image of ‘holding on to the past’.
Role of nitrogen-fixing legumes
The major advantage of legumes is their capacity to fix atmospheric nitrogen and produce animal feed from their seeds that are rich in proteins. This contributes to the protein self-sufficiency of the livestock production farm. In the 1990s, legumes were proposed as the basis for the more sustainable development of livestock production.
Lot of studies on nitrogen flows and nitrate leaching in fields of legumes have involved grass-white clover pastures. Nitrogen leaching was generally cases found lower in mixed pastures compared with fertilised pure grasses. This is explained for the most part because mixed pastures do not support animal density as high as highly fertilised grass pastures, and to a lesser extent by the biological regulation of nitrogen fixation by soil mineral nitrogen. Planting alfalfa for 3 years in a wheat–beets rotation field thus leads to a noteworthy reduction of nitrate leaching (Thiébeaur et al., Reference Thiébeau, Lô-Pelzer, Klumpp, Corson, Hénault, Bloor, de Chezelles, Soussana, Lett and Jeuffroy2010).
N2O emissions measured in association pastures are lower than those measured in pure grass pastures (0.2% v. 1.3% N) but there are few publications on this and so these results require more substantiation. The GIEC recommends to not count nitrous oxide emissions occurring during symbiotic nitrogen fixation.
In addition, the introduction of legumes reduces non-renewable energy consumption in livestock farms as they use atmospheric nitrogen, whereas 55 MJ of energy are required to produce, transport and spread 1 kg of inorganic nitrogen. Estimations in conditions prevalent in France have thus shown that 1.2 MJ of energy are required to produce 1 MFL (milk forage unit) with ryegrass fertilised at 150 kg N/ha, but only 0.4 MJ with an association of ryegrass and white clover, and 0.9 MJ for the ensilage of maize planted after wheat. Legumes are thus excellent rotation starters as they contribute to reducing the prevalence of diseases and improve soil fertility.
Limits for the development of legumes
The production performances of legumes are a controversial topic. Productivity of legumes per unit surface are often judged low in comparison with cereals or beets, and this is the prime cause for their reduced use, in particular, on large scale farms. Concerning feed production, association pastures are often less productive that those of highly fertilised grasses. Recent data from projects conducted in Europe, however, show that mixing several well-suited species (two legumes and two grasses) can overcome this obstacle. In addition, while white clover has a high dietary value and above all constant throughout the season, the energy values of red clover and alfalfa are low, especially when stored or dried.
Rotations and catch cropping for nitrogen management
Ploughing a pasture or a crop of legumes causes high inorganic nitrogen release: this substantial amount of nitrogen in the ground could be leached if not used. This is a crucial point for pasture–crop rotations (Vertès et al., Reference Vertès, Simon, Laurent and Besnard2007). Modern farming practices involve the destruction of pastures in the spring (most frequent case in maize–grass fodder systems) that enables elevated production of the following spring crops (maize or beets), with maize yields higher than those of maize used in a crop rotation scheme with cereals (Machet et al., Reference Machet, Laurent, Chapot, Dore and Dulout1997).
The role of catch crops has been known for a long time (e.g. Figure 2), which is one explanation for the regulatory inclusion of this practice in sensitive catchment areas and vulnerable zones (Justes et al., Reference Justes, Beaudoin, Bertuzzi, Charles, Constantin, Dürr, Hermon, Joannon, Le Bas, Mary, Mignolet, Montfort, Ruiz, Sarthou, Souchère, Tournebize, Savini and Réchauchère2012). Their long-term effect has been the subject of recent work with convergent conclusions: NFIC contribute to the reduction of winter losses of nitrogen and increase the stock of organic matter in soil. Catch crops are very valuable for reducing leaching in all rotation schemes, leaving the soil uncovered during the drainage period. Cruciferae (oil plants) are good nitrogen recyclers: for example, mustard planted between cultures can absorb more than 80 kg N/ha in 2 to 3 months and reduce the nitrate content of drainage water by 20% to 50% at the scale of the plot. As maize is harvested late in western France, good development of a catch crop is less certain than after a cereal harvested in the summer. Several authors have also pointed out the environmental value of fodder beets that can extract >400 kg of available N/ha after destruction of the pasture as a result of their long growth period (Morvan et al., Reference Morvan, Alard and Ruiz2000); (Berntsen et al., Reference Berntsen, Olesen, Petersen and Hansen2006; Constantin et al., Reference Constantin, Mary, Laurent, Aubrion, Fontaine, Kerveillant and Beaudoin2010).
Permanent crop systems are an interesting aspect that is starting to be investigated but it is far from being easy. The development of cereals over a permanent cover of legumes provides both nitrogen and protection against leaching but remains poorly controlled. Attempts to plant cereals after pastures without destruction have thus far been inconclusive as grass covers can compete, thereby preventing the correct development of the cereal.
Finally, at the present time there exist few tools to predict risks of losses in rotation schemes: STICS software (INRA), Syst’N (INRA, being tested) or ‘Territ’eau (Agrotransfer) that contains a module to calculate risks related to crop rotation sequences (Table 5; Machet et al., Reference Machet, Dubrulle, Damay, Duval, Recous and Mary2007).
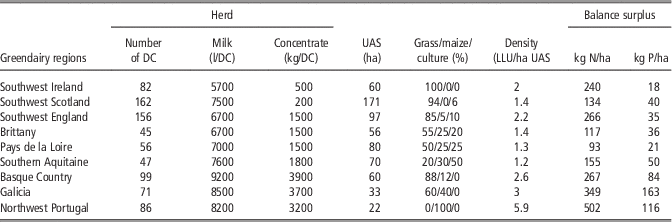
Characteristics of Greendairy pilot farms and surpluses of N and P in 2005 (Pflimlin et al., Reference Pflimlin, Irle and Mirabal2006)

DC=dairy cows.
Nitrogen flows on farms
Every link in the chain of losses
In the domain of the environment, conclusions reached by studying a single link in a system, for example, animal feeding v. managing waste, are often called into question by a link farther down the chain, even at the entire scale of the farm (where possibilities of recycling of nitrogen are increasing). Thus, the ranking of nitrogen utilisation efficiency according to the types of animals of livestock farming systems (poultry>swine>cattle) changes when we pass to the scale of the farm and the industry, as ruminant production systems recycle nitrogen with the fodder system (Jarvis et al., Reference Jarvis and Wilkins1996; Chatellier and Vérité, Reference Chatellier and Vérité2003; Rotz, Reference Rotz2004).
The risks resulting from conclusions reached too hastily are illustrated below by several examples of dairy farms. Considerable work has been carried out to improve the rate of dietary nitrogen efficiency by animals. Two hypotheses for improvement have emerged from this work: (1) increase the milk potential of animals to reduce the number of head required for the same volume of milk produced, (2) eliminate or at least limit situations of nitrogen over-nutrition with respect to the animals’ needs. Concerning the first hypothesis, in a regulated market (milk quotas), increasing milk production per animal evidently has led to a reduction in total dairy herd size but this has been offset by the development of suckler herds to meet demands for bovine meat (meat from culled dairy has decreased). The suckler herd is thus less efficient for nitrogen use and so the increased milk potential has in fact led to an increased nitrogen load. Concerning the second hypothesis, it has been clearly shown that increasing the proportion of silage maize in feed reduces the nitrogen excreted per animal and per kg of milk compared with grazing because silage maize enables preparation of feed less rich in nitrogen. At the scale of the farm, however, the increased use of maize requires increasing exogenous nitrogen inputs, in particular, as commercial protein concentrates purchased, to maintain animals in buildings for a longer time and in the end increases the risks of losses by leaching and volatilisation (Table 5).
Diversity of the management of nitrogen in animal production systems
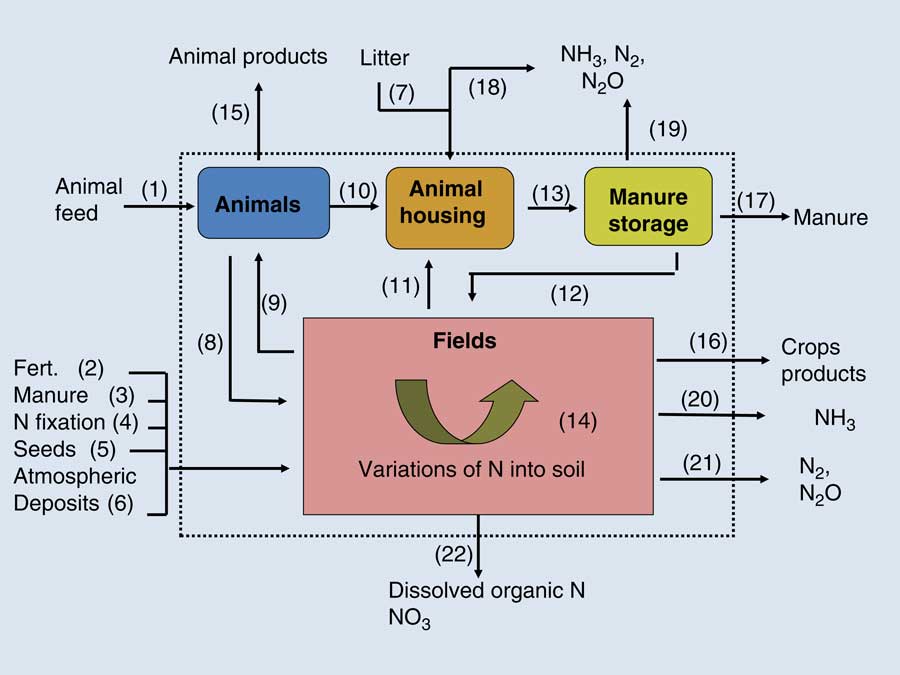
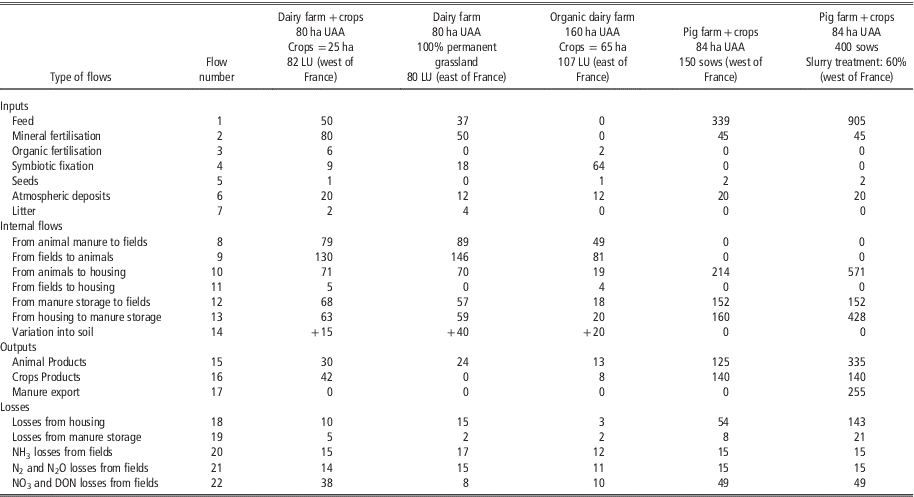
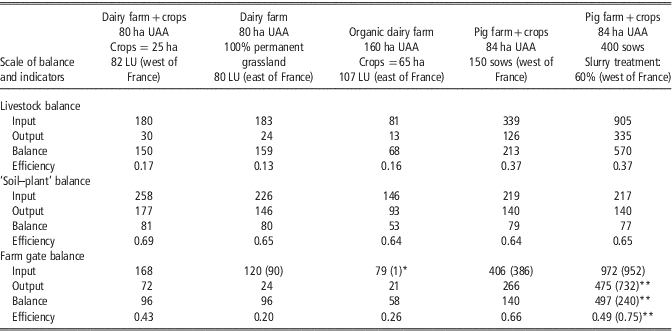
Determining nitrogen flows at the scale of livestock farms presuppose understanding their diversity, from industrial production facilities receiving imported soybean proteins, to livestock farming systems explicitly giving preference to the soil and local resources. Between the two, there is a wide range of coexisting animal production systems, even within the same region. The nitrogen load, impacts and options for managing waste are thus also highly variable. The appendix (p. 45–47) based on Figure 4 is a compilation of published data for several typical systems, using mean data from French dairy and pig farms. These examples show the considerable variability of flows and levels of surpluses of N balances depending on the systems considered. In particular, they show that (1) the intensity of flows and the origin of input nitrogen in the farm (feed v. inorganic fertiliser) are highly variable according to the type of production; (2) flows and losses are low on organic farms; (3) the distribution of losses is different according to the production systems, varying in terms of quantity, of forms and sites of emission; (4) the level of excesses of balances varies with the calculation methods used: the soil–crop balance leads to lower values than the input/output (credit/debit) accounting balance sheet (see Delaby et al., Reference Delaby, Dourmad, Béline, Lescoat, Faverdin, Fiorelli, Vertès, Veysset, Morvan, Parnaudeau, Durand, Rochette and Peyraud2014, in this issue for calculations), the difference being greater when nitrogen inputs are from the purchase of feed.
Mean nitrogen flows on a livestock farm (graph is adapted from Jarvis et al., Reference Jarvis, Hutchings, Brentrup, Olesen and van de Hoek2011). The Appendix on pages 45 to 47 gives balances (in kg N/ha UAA per year) and efficiency for some typical French dairy and pig farms. Calculation by the authors with index farms data; the calculation considers all input flows what is not system farming accounting for environmental policy framework in France.

Greater diversity at the scale of the pig farm than the pig unit
Today’s European hog production is predominantly qualified as intensive. This relative homogeneity does not eliminate differences depending on whether swine farms are specialised per phase (reproduction, weaning and fattening) or manage all phases from production of piglets through fattening. The number of animals per livestock farm also varies considerably in France, from a few dozen sows for the smallest farms to several hundred on the largest farms. In some countries, for example, Brazil, the United States, Denmark, Great Britain, there are livestock farms of several thousand, even several tens of thousands of sows. When all farms that raise pigs are considered, diversity is even greater. For example, specialised ‘hog’ farms account for 14% of French farms with pigs (whereas they account for 38% of total production), while 33% are above all cereal farms (while they account for 27% of total production). The remaining 53% are poly-livestock farming systems.
Little work has addressed the role of animal density in porcine livestock farms in both economic and environmental performances. Modelling work conducted in the context of the ‘Green Piggery’ programme varied the parameters of a farm combining swine (fattening) and crops, according to different hypotheses on management of excreta (liquid manure, solid manure, compost, aerobic treatment, etc.) in order to determine the influence of animal density (number of pigs produced/ha per year) on changes of various technical, economic and environmental criteria. The model determines crop rotation, feed formulas, the fertilisation plan and the proportion of waste to treat in order to maximise the gross profit of the operation at the same time as complying with environmental standards. From an economic standpoint, up to a density of 50 animals/ha, liquid manure offers the highest gross margin. Between 60 and 80 animals/ha, mixed liquid manure/solid manure becomes more profitable. Between 90 and 170 pigs produced/ha, liquid manure with composting or aerobic treatment provides the best compromise between production capacity and gross margin. Beyond 170 animals/ha, only strategies with export of treatment co-products are possible and the animal density is no longer a limiting factor. From an agricultural standpoint, for low density (20 pigs produced/ha per year), the quantity of waste to apply is lower than crop needs, so the operator can add legumes (peas) to the crop rotation sequence to increase his self-sufficiency for feed (up to 80%). Starting at 30 animals/ha, legumes are no longer part of crop rotation and all arable surfaces receive waste. Beyond 60 animals/ha, the entire surface is planted with maize and cereals, whose straw is used to compost excess liquid manure. The level of self-sufficiency for feeding the animal thus drops. Beyond 100 pigs/ha, the farm is required to import straw. It is interesting to note that in this study, environmental and economic optima are close and this result from elevated nitrogen recycling when the density is between 50 and 80 pigs produced/ha per year.
Ruminant livestock farming systems of highly differing degrees of intensiveness
The level and origin of nitrogen inputs have been used to distinguish French livestock farms according to whether preference is given to permanent pastures (Normandy plains, eastern France and humid mountains) or temporary pastures (‘Grand-Ouest’ and northern France). National statistical data show that overall animal density (as large livestock units) per hectare of pasture is moderately high in mountainous grasslands (density from 1.2 to 2 LLU/ha), increases in flatlands (2 to 3 LLU/ha) and is high in northern France, Brittany and Haute-Normandie (>3 with substantial variations). The data also show that risks of losses by leaching are proportional to animal density.
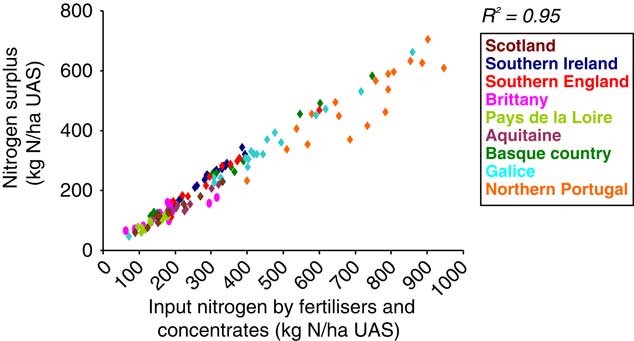
Concerning dairy systems, a comprehensive European study (Greendairy project: Pflimlin et al., Reference Pflimlin, Irle and Mirabal2006) compared 11 regions of the European Atlantic arc and pointed out the diversity of practices, operating structures and economic contexts. This study clearly showed that nitrogen balances per hectare, and thus the risks of leakage, increase with increasing animal density and the quantity of milk produced per hectare (Table 5, Figure 5) regardless of the driving factor, either through enhanced productivity of land surfaces via nitrogen fertilisation or increasing production per cow by providing high levels of concentrates. In north-western Europe, where milk is produced by elevated fertilisation of grasses, nitrogen excesses are of the order of 250 kg N/ha in Ireland and England, and 130 kg N/ha in Scotland and so purchases of nitrogen fertilisers are the major budgetary expenditures for inputs. Intensive dairy farms in Holland have an apparent high balance surplus, from 150 to 200 kg N/ha, potentially lost in discharges into the environment. In southern Europe (Spain, Portugal, Basque Country), very intensive dairy systems (up to 6 LLU/ha UAS) involve zero grazing with feed rations containing 50% concentrate and highly productive forage systems. In these operations, surpluses exceed 200 kg/ha and can reach 500 kg N in Portugal. In comparison, dairy systems in France are less intensive, with density from 1.2 to 1.5 LLU/ha UAS and surpluses are much lower: of the order of 100 kg N/ha in western France and 150 kg N/ha in the southwest.
Relationship between surplus of nitrogen balance of dairy farms and quantities of input nitrogen by fertilisers and concentrates (from Pflimlin et al., Reference Pflimlin, Irle and Mirabal2006).

Low input livestock farming systems based on the optimum use of local resources
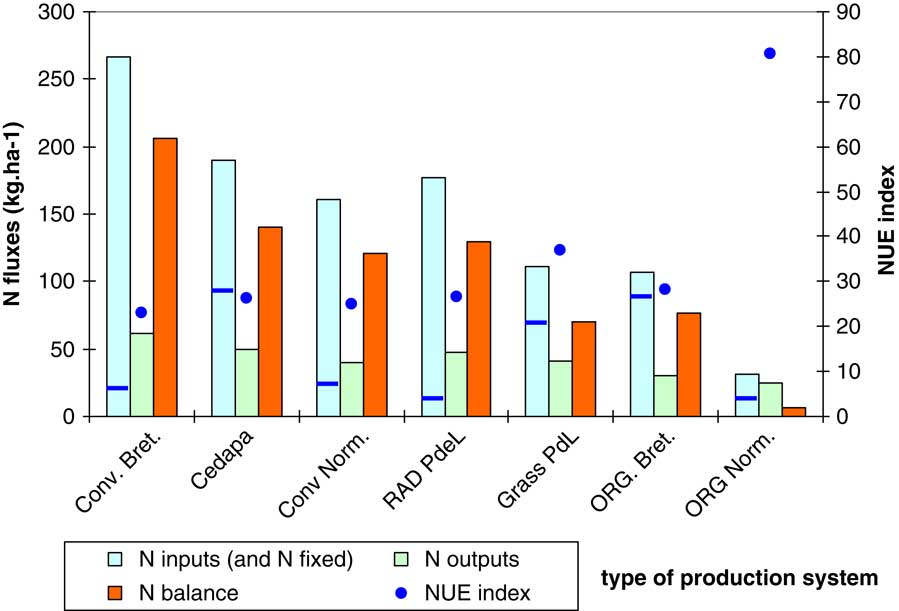
Nitrogen self-sufficiency echoes reduction of external nitrogen inputs and nitrogen recycling within the production system. Several agricultural development groups have sought to promote agriculture for more sustainable, more autonomous and more sparing of inputs such as dairy systems based on grass-legumes pastures and a relatively low animal density. The CEDAPA (Centre for the Study of More Autonomous Agricultural Development) in the Côtes d’Armor Department was a pioneer of this concept in the 1980s. These initiatives have been observed and studied since the 1990s in the framework of R&D programmes and by monitoring different groups. The Sustainable Agricultural Network (Réseau agriculture durable in French) that includes many of these groups is one of the players providing references. The vast majority of farms is practically self-sufficient for feed but not for feed concentrates. Self-sufficiency for total protein is reached in only a handful of livestock farming systems (barely 3%) by the use of legume seed plant crops. As an illustration, the analysis of apparent balances calculated for the network of specialised dairy farms in western France (Figure 6) shows variations between one- and threefold between regions for the same method of production, or for the same region between different methods of production. Optimising practices within one method of production would thus provide improvement of almost 30%, primarily resulting from reduced nitrogen inputs. The effect of the region also undoubtedly plays a role on parameters such as soil fertility and climate (context generally more favourable in the pastures of Basse–Normandie than in Brittany or the Pays de la Loire).
Apparent balances and index of nitrogen utilisation efficiency calculated in the network of specialised dairy farms in western France (adapted from Vertès et al., Reference Vertès, Alard and Le Corre2002). CEDAPA and RAD are low inputs systems; grass is grassland based and low inputs; regions are Bretagne, Normandie and Pays de Loire. Conv.=conventional; ORG=organic.

A question often asked involves the revenue of farmers with low input production systems. It has been mentioned in several publications that the farmer’s revenue does not depend directly on how intensive his production is (intensive with respect to the land or the animal). The economic result per unit of surface is consistently better for intensive operations but available revenue for the farmer varies little and is even often higher in less-intensive systems, provided they are well managed. Above all, gross profit in terms of total energy consumed is higher (of the order of 35%) for systems with lower purchases of resources, making them more resilient and resistant in periods of high energy cost increases (Samson and Dupraz, Reference Samson and Dupraz2009).
Organic farming is ruled by specific standards (EC No. 834/2007): reduced use of inputs (animal feed) and prohibition on the use of nitrogenous mineral fertilisers. These specifications are linked to elevated nitrogen self-sufficiency, high recycling indices and low nitrogen losses. Work on this question (Halberg, Reference Halberg1999) has been done primarily in northern Europe, but a comparison of conventional and organic French cattle production systems involving 90 farms has just been terminated.
Early modelling work had concluded that the conversion of a pig farm to organic farming did not lead to a notable decrease of nitrogen losses as a result of the generally high efficiency at the scale of animals (Dalgaard et al., Reference Dalgaard, Halberg and Kristensen1998). On the other hand, all authors, whether they worked on an experimental farm, by modelling or in a network of commercial farms, concluded that farm nitrogen balances are systematically lower in organic A dairy production systems compared with conventional systems, and that nitrogen utilisation efficiency is higher. Conversion to organic milk production could thus significantly reduce nitrogen losses per unit of surface and this concept was modelled at the scale of Denmark. It led to a 24% reduction of total nitrogen surplus but also to a decrease of total milk production or to an increase in land surface devoted to milk production. If these farms remained in conventional mode (use of inorganic fertilisers) but reduced their animal density to that of organic farming, the nitrogen surplus would decrease by only 15%. Other work involved organic suckler-cows production in grassland areas of the Massif Central in France and concluded that it does not discharge nitrate, and is even in a nitrogen deficit if symbiotic nitrogen fixation by legumes is not considered. A literature review extended by surveys in 18 European countries also showed that OF controls nitrate leaching (up to −50%) better than conventional systems. This risk is minimised by crop rotation with no uncovered ground, and maximises the use of nitrogen from the preceding crop of legumes and from the absence of pesticides that leaves the microbial soil flora intact.
These consensus conclusions on nitrogen confirm the other positive impacts of organic farming concerning the risks of phosphorus losses, maintaining biodiversity, eutrophication, soil quality or consumption of non-renewable energy. As for conventional systems with low input levels, the greenhouse gases balance of organic farming systems is more open to discussion: it is higher per unit of product but lower per unit of surface (hectare). Finally, organic farming can market products with an official quality label that creates economic added value (de Boer, Reference de Boer2003; Knudsen et al., Reference Knudsen, Kristensen, Berntsen, Petersen and Kristensen2006; Mondelaers et al., Reference Mondelaers, Aertsens and van Huylenbroeck2009; Muller-Lindenlauf et al., Reference Muller-Lindenlauf, Deittert and Kopke2010; Veysset et al., Reference Veysset, Lherm and Bébin2011).
Managing nitrogen flows at the scale of a region
Nitrogen transfer between farms
Specialised animal farms often do not have sufficient land surface to manage their waste, but they can transfer fertiliser to other farms. In the same vein, we have seen that the introduction of alfalfa in production systems whose animals are grain or cereal consumers were of agricultural and environmental value, but this alfalfa cannot be used ‘in-house’ by these farms. These considerations show the potential value of changing the scale by including several farms (Paillat et al., Reference Paillat, Lopez-Ridaura, Guerrin, Van der Werf, Morvan and Leterme2009).
If exchanges of slurry between neighbours’ hog and cattle farmers are quite common, few publications have dealt with collective organisation of exchanges of manure between hog and other types of production systems. The hypothesis of transfer of excess waste of French hog production systems to ‘deficient’ farms located at a distance >10 km (6.25 miles) was tested and assessed (Bonneau et al., Reference Bonneau, Dourmad, Germon, Hassouna, Lebret, Loyon, Paillat, Ramonet and Robin2008b; Lopez-Ridaura et al., Reference Lopez-Ridaura, van der Werf, Paillat and Le Bris2009). This is an interesting possibility but insufficient in districts with the highest densities of livestock farming systems, in particular in western France. More detailed approaches have examined collective manure plans between pig and cereal producers. Aerobic treatment and transfer of waste between farms have also been compared using the method of life cycle analysis. All the environmental indicators considered are better for transfer between farms than for treatment, but with limitations for transfer in ‘good’ conditions (no logistics issues, year with no excessive precipitation, unlimited labour, etc.) (Dourmad et al., Reference Dourmad, Rigolot and Bonneau2010).
Another question is determining at what geographic scale this recycling is to be done and how to implement. Rare case studies have stressed the difficulties in combining equipment, crop rotations, states of soil and climatic conditions, and also the reticence of inhabitants towards the transport and re-localisation of waste. The issue of deodorising (compost, industrials treatments, etc.) of waste is also an important consideration in this context. Technical innovations are aiming to remove these obstacles.
Operations to restore water quality in vulnerable areas
The question of water quality occasionally requires major actions that locally involve substantial changes in production practices for the vast majority of farms (Dalgaard et al., Reference Dalgaard, Heidmann and Mogensen2002).
Projects aiming to protect drinking water catchment areas
There are several published examples of regional projects resulting from the wish (or obligation) to control or restore water quality. They are often related to potability issues in catchment areas supplying large cities. These projects are not applicable to the general context but show that they can be implemented locally when water quality is considered to be a priority. These projects are sponsored and driven by private water companies, for example, Société des Eaux Minérales de Vittel and Nestlé-Waters in France, or by municipalities (Munich, Lons le Saunier, La Rochelle, etc.). The nitrate content of Munich water decreased from 14 to 8 mg NO3/l (−43%) from 1991 to 2006 as a result of the promotion of organic agriculture in the catchment area. In this case, almost half of the surface of the principal catchment basin (6000 ha) was covered by a ‘sustainably’ managed forest, 75% of the remaining agricultural surface was OA and 93% of UAS was under pasture.
Another initiative was implemented by the city of Augsbourg, Germany, involving an area of 350 000 ha. An unpublished communication stated that the nitrate content decreased from 35 mg NO3/l in 1990 to <10 mg NO3/l. The city initially purchased land: 1100 ha: 50% forest and 50% agricultural. It implemented a concentric zoning. The ‘red’ zone, the closest to Augsbourg, was covered by a very stringent environment-friendly requirements. The ‘yellow’ zone involved nitrogen fertilisation ceilings and nitrogen thresholds in soils after harvest in counterpart to financial assistance.
In Vittel, France, the mineral water production company Vittel-Nestlé did not opt for OA contract conditions, but encouraged farmers to convert voluntarily. Contractual relations limiting the animal density called for composting waste, reducing the use of industrial fertilisers and excluded the use of pesticides. In addition, the agricultural service of Vittel closely monitored agricultural work, for example, to avoid ploughing up an excessive number of pastures in the same year (Benoît et al., Reference Benoît, Deffontaines, Gras, Bienaime and Riela-Cosserat1997).
Finally, modelling work in 2010 examined a scenario of the systematic application of OA in farms located in the Seine, Somme and Escaut basins, with an additional restriction that livestock must be supplied with feed produced locally. This scenario led to increasing animal density in the Seine basin but reduced it in the Escaut basin. Thus, equilibrated nitrogen balances would be reached at the price of reduced overall agricultural production. According to the best-case hypothesis, nitrate levels would decrease in the majority of the hydrographic system to values below 10 mg NO3−/l, whereas more conventional scenarios (adopting good agricultural practices) would not enable water quality to be restored (Billen et al., Reference Billen, Thieu, Garnier and Silvestre2009).
Pilot project to deal with algal blooms
The Lieue de Grève bay (Côtes d’Armor Department) has seen green algae washing up on shore since 1970. The catchment area is dominated by dairy and meat bovine production systems but there are relatively few cereal farms and only a small number of industrial livestock farming systems. In the framework of ‘Pro-Littoral’ action programmes currently in effect, farmers of the catchment area have improved their agricultural practices to the extent that the nitrate content of watercourses supplying the bay has been reduced to about 25 to 30 mg NO3−/l. This concentration is much lower than the upper standard for drinking water but is still too high to reduce the quantity of algae washed up. The goal of the pilot project (included in the ANR Systerra-Acassya programme) is to descend to below 15 mg NO3−/l at the basin outlet. The initial diagnosis and work by the multi-partner group of researchers, chambers of agriculture and regional government have led to the following bullet points: maximum density of 1.4 LLU/ha of grass, a ceiling for total nitrogen inputs of 100 kg N/ha of UAS, winter covering of ground, <5% of grassy surfaces ploughed per year, and the absence of ‘parking’ plots. The first simulations conducted on a test case, the Trégor farm, showed the environmental effectiveness of these contract conditions with no negative effect on revenues in spite of lower production.
Pollution abatement by ecological design or landscape management
Outside the scope of agriculture, the use of ‘buffer areas’ is a widely documented and tested solution to capture, diffuse or occasional nitrogen emissions. It involves different aspects depending on whether it considers emissions into the atmosphere or into the hydrosphere and whether they are occasional (spot) of diffuse emissions (Dragosits et al., Reference Dragosits, Theobald, Place, ApSimon and Sutton2006).
Spot pollutions
In the case of spot, or occasional pollutions, the goal is to capture emissions close to the source, thus by definition concentrated. In the case of ammonia released by livestock farming systems, these systems may consist of perimeters planted with trees that can intercept significant quantities of ammonia and thus reduce levels of exposure of downstream ecosystems. Once taken up, nitrogen is partly used by leaves and is partly leached and infiltrates the soil. On a spot basis, this results in a substantial nitrogen supply to the soil that can cause secondary nitrate emissions to water and N2O to air. This system, nevertheless, has the advantage of rendering other services like heat regulation, windbreak, aesthetic and olfactory improvement of the immediate vicinity of livestock farming systems (Loubet et al., Reference Loubet, Asman, Theobald, Hertel, Tang, Daemmgen, Cellier and Sutton2009).
Industrial or domestic installations, in the form of ‘constructed wetlands’ are related to lagooning. Their purpose is to improve nitrogen capture by productive hydrophilic vegetation, that is, to nitrify then denitrify nitrogen received. These systems are reputed to be effective for improving water quality, although some questions are sometimes raised concerning emissions of N2O, even of dissolved organic matter. Experimental systems often exhibit few undesirable losses, but doubts remain on long-term performance in real conditions. Finally, these are costly systems.
Ecological engineering approach for diffuse emissions in water
This principle involves the use of the natural phenomenon of accumulation of water at low points of the landscape to favour recapture of nitrate by vegetation and above all its denitrification, possibly presupposing a change in land use. The conditions and limits of this measure arise directly from this principle. It requires that a significant proportion of the water flow feeding watercourses transits laterally through soils in the low part of the catchment area. This implies a geology that is relatively permeable on the surface and relatively impermeable in depth. In addition, there is a contradiction between the necessity of having large flows so that the ‘treatment’ is effective, and the necessity of sufficient transit times to enable water to be purified during its transit. In coastal regions in particular, maximum water flows occur in the winter, when biological activity is minimal. This results in a substantial variability of purifying efficacy by wetlands at the scale of the landscape and as a consequence great difficulty in quantifying and predicting. Efficiencies higher than 80% of input flows can be seen locally. At the scale of the landscape, estimations vary from 10% to >50% of the surplus of denitrified nitrogen. The use of valley floors for this purpose presents the advantage that because of the renewal of water, these actions are more effective than when distributed over the entire region. Here again, indirect emissions of N2O and dissolved organic matter are unknown. Furthermore, the use of wetlands for the purposes of purification could be in contradiction with other ecosystemic aspects such as maintaining biodiversity (zones receiving high supplies of nutrients with a usual flora and fauna) or the storage of carbon (the supply of nitrate can contribute to stimulating humus mineralisation). Finally, this strategy targets surface waters and thus has no effect on the quality of underground water (Deuffic and Candau, Reference Deuffic and Candau2006).
Conclusion
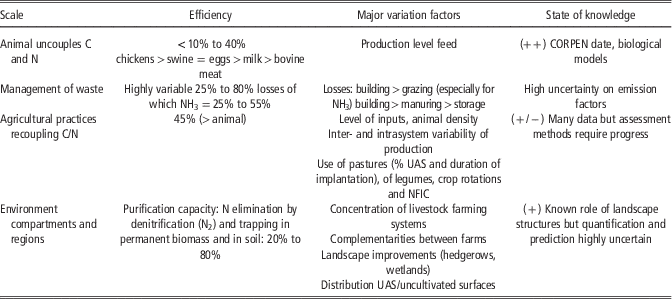
Table 6 shows that efficiency at the scale of the animal is not representative of that of the production system where animal density has a determining role on nitrogen losses. The animal uncouples a large part of carbon and nitrogen cycles as urine is very rich in non-protein and labile forms of nitrogen, while plant production tends to recouple these cycles. Nitrogen efficiency is generally higher at the level of the farm than at that of the animal as a result of possible recycling between the different parts of the system (animal, waste, cropping and fodder systems), in particular, in the case of ruminants. Feeding animals, management of waste, fertilisation and crop rotation management are the principal means for better managing nitrogen at the level of the farm. The management of waste is where the most progress is to be made, especially for ammonia. Considerable nitrogen recycling by pastures makes grazing an effective alternative for the management of nitrogen on herbivore livestock farms. At a scale larger than the local region, it is better to speak of the purification capacity of the environment rather than efficiency per se. The presence of hedgerows and suitable management of valley floors and wetlands enable the recapture of ammonia emitted by farms and to denitrify nitrogen into N2. This is the level at which new freedom can occur by exchanges between farms but this level is also weighed down by industrial logic, in particular, as a result of their concentration.
Summary of understanding of the control of nitrogen flows in animal production systems

In summary, the interconnection of different spatial and temporal scales is conducive to consolidating consistency of the management of nitrogen between scales, both at the interior of the farm and in relation to land upstream and downstream. Although the body of knowledge on animals is considerable at the present time, there remain gaps at the level of the farm and above all concerning the management of waste, which explains the persistence of substantial uncertainties. There is even less understanding at the scale of regions.
Appendix
Average nitrogen flows (kg N/ha UAA per year) and balances for typical dairy farms and pig farms in France (the graphs are adapted from Jarvis et al., Reference Jarvis, Hutchings, Brentrup, Olesen and van de Hoek2011). The calculation for balances and efficicency consider all input flows (what is not done systematically in legal countabilities in France).