


Impact Statement
Worldwide, there are 55–57 million people living with Alzheimer’s disease (AD) and other dementias, and approximately 10 million new cases are diagnosed every year. The ability to identify individuals at high risk of developing or at early stages of AD is critical for the care and treatment of AD patients. In the area of cancer, although with the advancements of new screening tests, many cancer types can now be detected and diagnosed early, it remains a significant challenge to determine how aggressive the newly diagnosed cancer may be. In this study, we identified a new opportunity for risk assessment and early detection of AD and aggressive cancers by analyzing biological nanoparticles present in human blood. Using a simple extraction protocol and a nanoparticle sizing analysis technique called dynamic light scattering, we found that patients diagnosed with aggressive cancers tend to have larger nanoparticles called extracellular vesicles enriched in their blood, while AD patients have more protein oligomers present in the blood. The method and protocol developed in our study are simple, rapid, and cost-effective. Once validated in clinical settings, our research can bring new diagnostic tools for the two most debilitating and costly diseases that the world is facing.
1. Introduction
Human blood is a complex fluid that contains both molecular and cellular components that are essential to the biological function of the body. Traditionally, the search for disease-specific biomarkers in blood has been focused on individual molecular targets (proteins, DNA, and RNA) and cellular targets such as red and white blood cells. In recent years, biogenic nanoparticles including extracellular nanoparticles [Reference Kalluri and LeBleu1, Reference Jeppesen, Zhang, Franklin and Coffey2, Reference Kumar, Baba and Sadida3] and protein oligomers/aggregates [Reference Ross and Poirier4, Reference Vaquer-Alicea and Diamond5, Reference Chapleau, Iaccarino, Soleimani-Meigooni and Rabinovici6] have caught much attention as potential disease biomarkers. With a typical dimension larger than individual proteins but smaller than biological cells, the physical characteristics, including size, shape, and morphology, along with the molecular composition and cargo load of these nanoparticles, provide a new and powerful platform for disease-specific biomarker discovery.
Extracellular nanoparticles, including extracellular vesicles (EVs), exomeres, and supermeres, are nanoparticular structures released from biological cells. EVs, including populations commonly referred to as exosomes, have a lipid bilayer membrane structure [Reference Skotland, Hessvik, Sandvig and Llorente7, Reference Skotland, Sandvig and Llorente8] and a dimension above 50 nm but generally smaller than 200 nm [Reference Dilsiz9, Reference Doyle and Wang10], while exomeres and supermeres are non-vesicular nanoparticles with a diameter smaller than 50 nm [Reference Zhang, Jeppesen and Higginbotham11, Reference Anand, Samuel, Mathivanan, Mathivanan, Fonseka, Nedeva and Atukorala12, Reference Yu, Shi and Gao13]. While extensive research has been reported on the biogenesis, detection, and characterization of EVs [Reference Kalluri and LeBleu1, Reference Jeppesen, Zhang, Franklin and Coffey2, Reference Kumar, Baba and Sadida3], the discovery of exomeres and supermeres has only been made recently [Reference Zhang, Jeppesen and Higginbotham11, Reference Anand, Samuel, Mathivanan, Mathivanan, Fonseka, Nedeva and Atukorala12, Reference Yu, Shi and Gao13], with much of their composition and biological functions remaining to be discovered. EVs are differentiated in their function and composition depending on the cell they are originally secreted from [Reference Li, Li and Du14]. Within the body, EVs’ main function is to transport molecules such as proteins, nucleic acids, and lipids from one cell to other cells [Reference De Toro, Herschlik, Waldner and Mongini15, Reference Bischoff, Schulz and Morrison16]. In cancer, EVs have been found to promote tumor metastasis given their ability to rapidly transfer molecules that promote disease proliferation and invasion from one cell to another [Reference Paskeh, Entezari and Mirzaei17, Reference Wen, Lima and Lobb18, Reference Dai, Su and Zhong19]. In Alzheimer’s disease (AD), EVs have been found to spread, aggregate, and deposit tau and amyloid proteins within the brain as well as lead to neuronal death [Reference Daksh, Mathew and Bosco20, Reference Sardar Sinha, Ansell-Schultz and Civitelli21, Reference Perez-Gonzalez, Gauthier, Kumar and Levy22]. EVs contain disease-specific protein and nucleic acid cargo that may be used for early detection and diagnosis of diseases such as cancer [Reference Wang, Tian, Lu and Ng23, Reference Yu, Li and Wang24, Reference Ghosh, Rajendran and Mahajan25] and AD [Reference Chen, Liu and Lin26, Reference Liang, Wu and Li27]. Exomeres, with an average size around 35 nm, are enriched with proteins implicated in regulating metabolic pathways [Reference Anand, Samuel, Mathivanan, Mathivanan, Fonseka, Nedeva and Atukorala12]. Supermeres, with a size smaller than exomeres, are enriched with proteins and RNA associated with multiple cancer types, AD, and cardiovascular disease [Reference Zhang, Jeppesen and Higginbotham11, Reference Yu, Shi and Gao13]. It is found that majority of the extracellular RNA are associated with supermeres rather than small EVs and exomeres [Reference Zhang, Jeppesen and Higginbotham11, Reference Yu, Shi and Gao13].
Pathological protein oligomers and aggregates such as amyloid fibrils and tau protein aggregates are central to neurodegenerative disorders, including Alzheimer’s, Parkinson’s, and Huntington’s diseases [Reference Ross and Poirier4, Reference Vaquer-Alicea and Diamond5, Reference Chapleau, Iaccarino, Soleimani-Meigooni and Rabinovici6]. There has been a strong interest in developing new bioassays and imaging techniques to detect early formation of protein oligomers and aggregates in brain and biofluids [Reference Pedersen and Heegaard28, Reference Shea, Colasurdo and Smith29, Reference Nirmalraj, Schneider and Felbecker30]. Protein aggregates are frequently co-isolated during extracellular nanoparticle extraction from biological samples due to their similar sizes [Reference Brennan, Martin and FitzGerald31]. While this co-isolation may cause problems for some applications, from a diagnostic point of view, co-isolated protein aggregates can provide complementary biological insights that reflect physiological or pathological processes occurring alongside vesicle release, hence opening new opportunities for multi-nanoparticle-target–based analysis.
The physical characteristics such as size, morphology, and shape of these nanoscale particles can often reveal disease-specific features that may be used as novel biomarkers for disease detection and diagnosis. For example, it was reported that plasma-derived exosomes from Glioblastoma Multiforme (GBM) had a larger diameter of 148 ± 79 nm, showing an upward shift of the typical exosome size range [Reference Kucharzewska, Christianson and Welch32]. Physical biomarkers of protein aggregates have also been used to detect Alzheimer’s-related pathology given that in AD, amyloid-β (Aβ) aggregates of approximately 10–20 nm have been reported, whereas in healthy individuals Aβ is predominantly non-aggregated [Reference Esparza, Wildburger and Jiang33]. However, many of the methods currently used to extract or isolate bio-nanoparticles can lead to disruption of the nanoparticle structure or irreversible aggregate formation [Reference Liu, Ma and Kang34, Reference Sidhom, Obi and Saleem35]. For example, ultracentrifugation uses high forces that can lead to irreversible damage to EVs, including lipid bilayer collapse, deformation, and aggregation. EV aggregation and protein contamination are common problems in the PEG precipitation process [Reference Rider, Hurwitz and Meckes36, Reference Deregibus, Figliolini and D’antico37]. Following these disruptive isolation processes, the structures and molecular compositions of the EVs are altered, and the measured physical and biochemical characteristics are no longer a true representation of the bio-nanoparticles in their native biological state. The disruptive process is also the root cause behind the large analytical variability often encountered in bio-nanoparticle research.
Our laboratory has recently developed a rapid and simple protocol for non-disruptive isolation of EVs from cell culture media [Reference Ambrosius, Vaidya and Joshua38]. Through a simple syringe filtration and spin-concentration process using a benchtop mini centrifuge, EVs are extracted and isolated from cell culture media with high yield and excellent reproducibility in less than 40 minutes. In the current study, we set out to use this newly developed protocol for human blood plasma analysis. Human blood plasma samples from 49 healthy controls, 6 patients with colorectal cancer, 13 patients with prostate cancer, and 7 patients with AD were processed and characterized. Using dynamic light scattering (DLS) and supported by transmission electron microscopy (TEM) analysis, four size populations of bio-nanoparticles were observed from the blood plasma extracts: one particle size centered around 100–200 nm that is consistent with EVs widely reported in literature; one particle size around 20–50 nm that may include exomeres, supermeres, and lipoproteins; the appearance of protein oligomers/aggregates or other nanoparticle complexes around 10 nm and above; and free protein peak around 6 nm. Compared to healthy controls, larger EVs with diameters in the range of 100–200 nm are found to be enriched in the blood plasma of patients with advanced-stage colorectal or prostate cancer. Patients with advanced AD exhibit a distinct nanoparticle population increase around 10 nm that we hypothesize is associated with protein oligomer/aggregate formation or other neurodegeneration-related nanoparticle complexes. These results indicate that by combining non-disruptive extraction protocols with DLS technique, the size and size distribution pattern of the extracted bio-nanoparticles can reveal disease-specific or relevant information that may be used as physical biomarkers for clinical applications.
2. Materials and Methods
2.1. Human Blood Plasma Samples
Biobanked frozen human blood samples tested in this study were obtained from two commercial vendors. Healthy control samples and cancer patient samples were obtained from Discovery Life Sciences (Huntsville, AL, USA). Alzheimer’s disease patient samples were obtained from iSpecimen (Woburn, MA, USA). All blood samples were K2/EDTA plasma. The samples were immediately frozen and stored at −80°C until received and ready for testing. Samples obtained for this study include: 49 samples from healthy donors that had not been diagnosed with cancer, autoimmune diseases, or metabolic diseases prior to and at the time of blood collection; 13 samples from patients with prostate cancer; 6 samples from patients with colorectal cancer; and 7 samples from patients with AD. All the cancer patient samples were pre-treatment samples. Since all frozen samples were obtained from commercial vendors as de-identified samples, according to NIH policy, the study of these samples is not human subject research. In addition to these samples, two blood samples (K2/EDTA plasma) collected from two healthy control donors through a study approved by the Institutional Review Board at the University of Central Florida (IRB protocol number 00007827) were used for the study. The blood samples were collected through finger prick into a Microvette 200 μL capillary blood collection tube (K2/EDTA plasma) (Sarstedt, Germany). Following a brief centrifugation using an Eppendorf MiniSpin at 10,000 g for 5 minutes, the separated plasma layer was analyzed following the same protocol used for all other samples.
2.2. Bio-Nanoparticle Extraction
100 μL of blood plasma were diluted with 1 mL deionized (DI) water and syringe filtered using a 0.22 μm Choice PVDF syringe filter (Fisher Scientific, cat. 03-253-899) into a microcentrifuge tube. Prior to sample dilution, the DI water was first pre-filtered using a 0.22 μm Choice PVDF syringe filter. The purity of the DI water was tested using DLS with scattering light intensity below the noise level. A Corning Spin-X UF spin concentrator with a 100,000 Da molecular weight cut-off (Sigma-Aldrich, cat. CLS431481-25EA) was used to remove free proteins and concentrate the nanoparticle extract. Five hundred microliters of the syringe filtered sample solution was added per concentrator and centrifuged at 10,000 g for 10 minutes using an Eppendorf mini-Spin centrifuge. From each concentrator, approximately 100 μL enriched nanoparticle solution was obtained. The concentrated extract following centrifugation was transferred to a glass vial for storage and further analysis.
2.3. Dynamic Light Scattering Analysis
DLS analyses were carried out using a ZetaSizer Nano ZS90 DLS system equipped with a green laser (532 nm, 4 mW) and an avalanche photodiode detector (APD) (quantum efficiency >50% at 532 nm) (Malvern Panalytical Ltd.). The attenuation number was set at 11, corresponding to a laser beam power of 4 mW. The scattering angle was set at 90°. Malvern DTS 5.10 software was used to process and analyze the data. To perform the measurement, 30 μL of the extract solution was pipetted into an ultramicro quartz cell (Malvern Panalytical Ltd., cat. ZEN2112). After the ultramicro cell was placed into the cuvette holder, the sample was equilibrated at 25°C for 5 min before starting the measurement. For each sample, three measurements were obtained, and each measurement was conducted based on 10 runs at 10 s per run. It is to be noted here that intensity-averaged size distribution data are used for comparative analysis between different samples. Such data do not provide absolute quantity information of different particle size populations.
2.4. Transmission Electron Microscopy Analysis
Transmission electron microscope images of the samples were obtained using a JEOL TEM-1011 equipped with a tungsten filament operating at 100 kV accelerating voltage. To prepare the sample for TEM analysis, 10 μL of poly-L-lysine (0.1% w/v solution in H2O, CAS 25988-63-0) was diluted with 100 μL DI water, making a 1:10 dilution. Prior to sample dilution, the DI water was first pre-filtered using a 0.22 μm Choice PVDF syringe filter. Two microliters of diluted poly-L-lysine solution was added to gold TEM grids (FF400-Au Formvar Film on 400 Square Mesh, Gold Grids; Lot #080724 – Electron Microscopy Sciences). After air-drying for 1 hour, 2 μL of the nanoparticle extracts were added to the respective grids and air-dried for another hour.
2.5. Data Analysis
Microsoft Office Excel software version 2602 was used for all data analysis conducted and presented in this study, including Pearson correlation coefficients, Student’s t-test, or one-way ANOVA analysis. A p value of ≤0.05 from Student’s t-test or one-way ANOVA analysis is considered as statistically significant.
3. Results
3.1. Size and Distribution Analysis of Nanoparticle Extracts from Healthy Controls
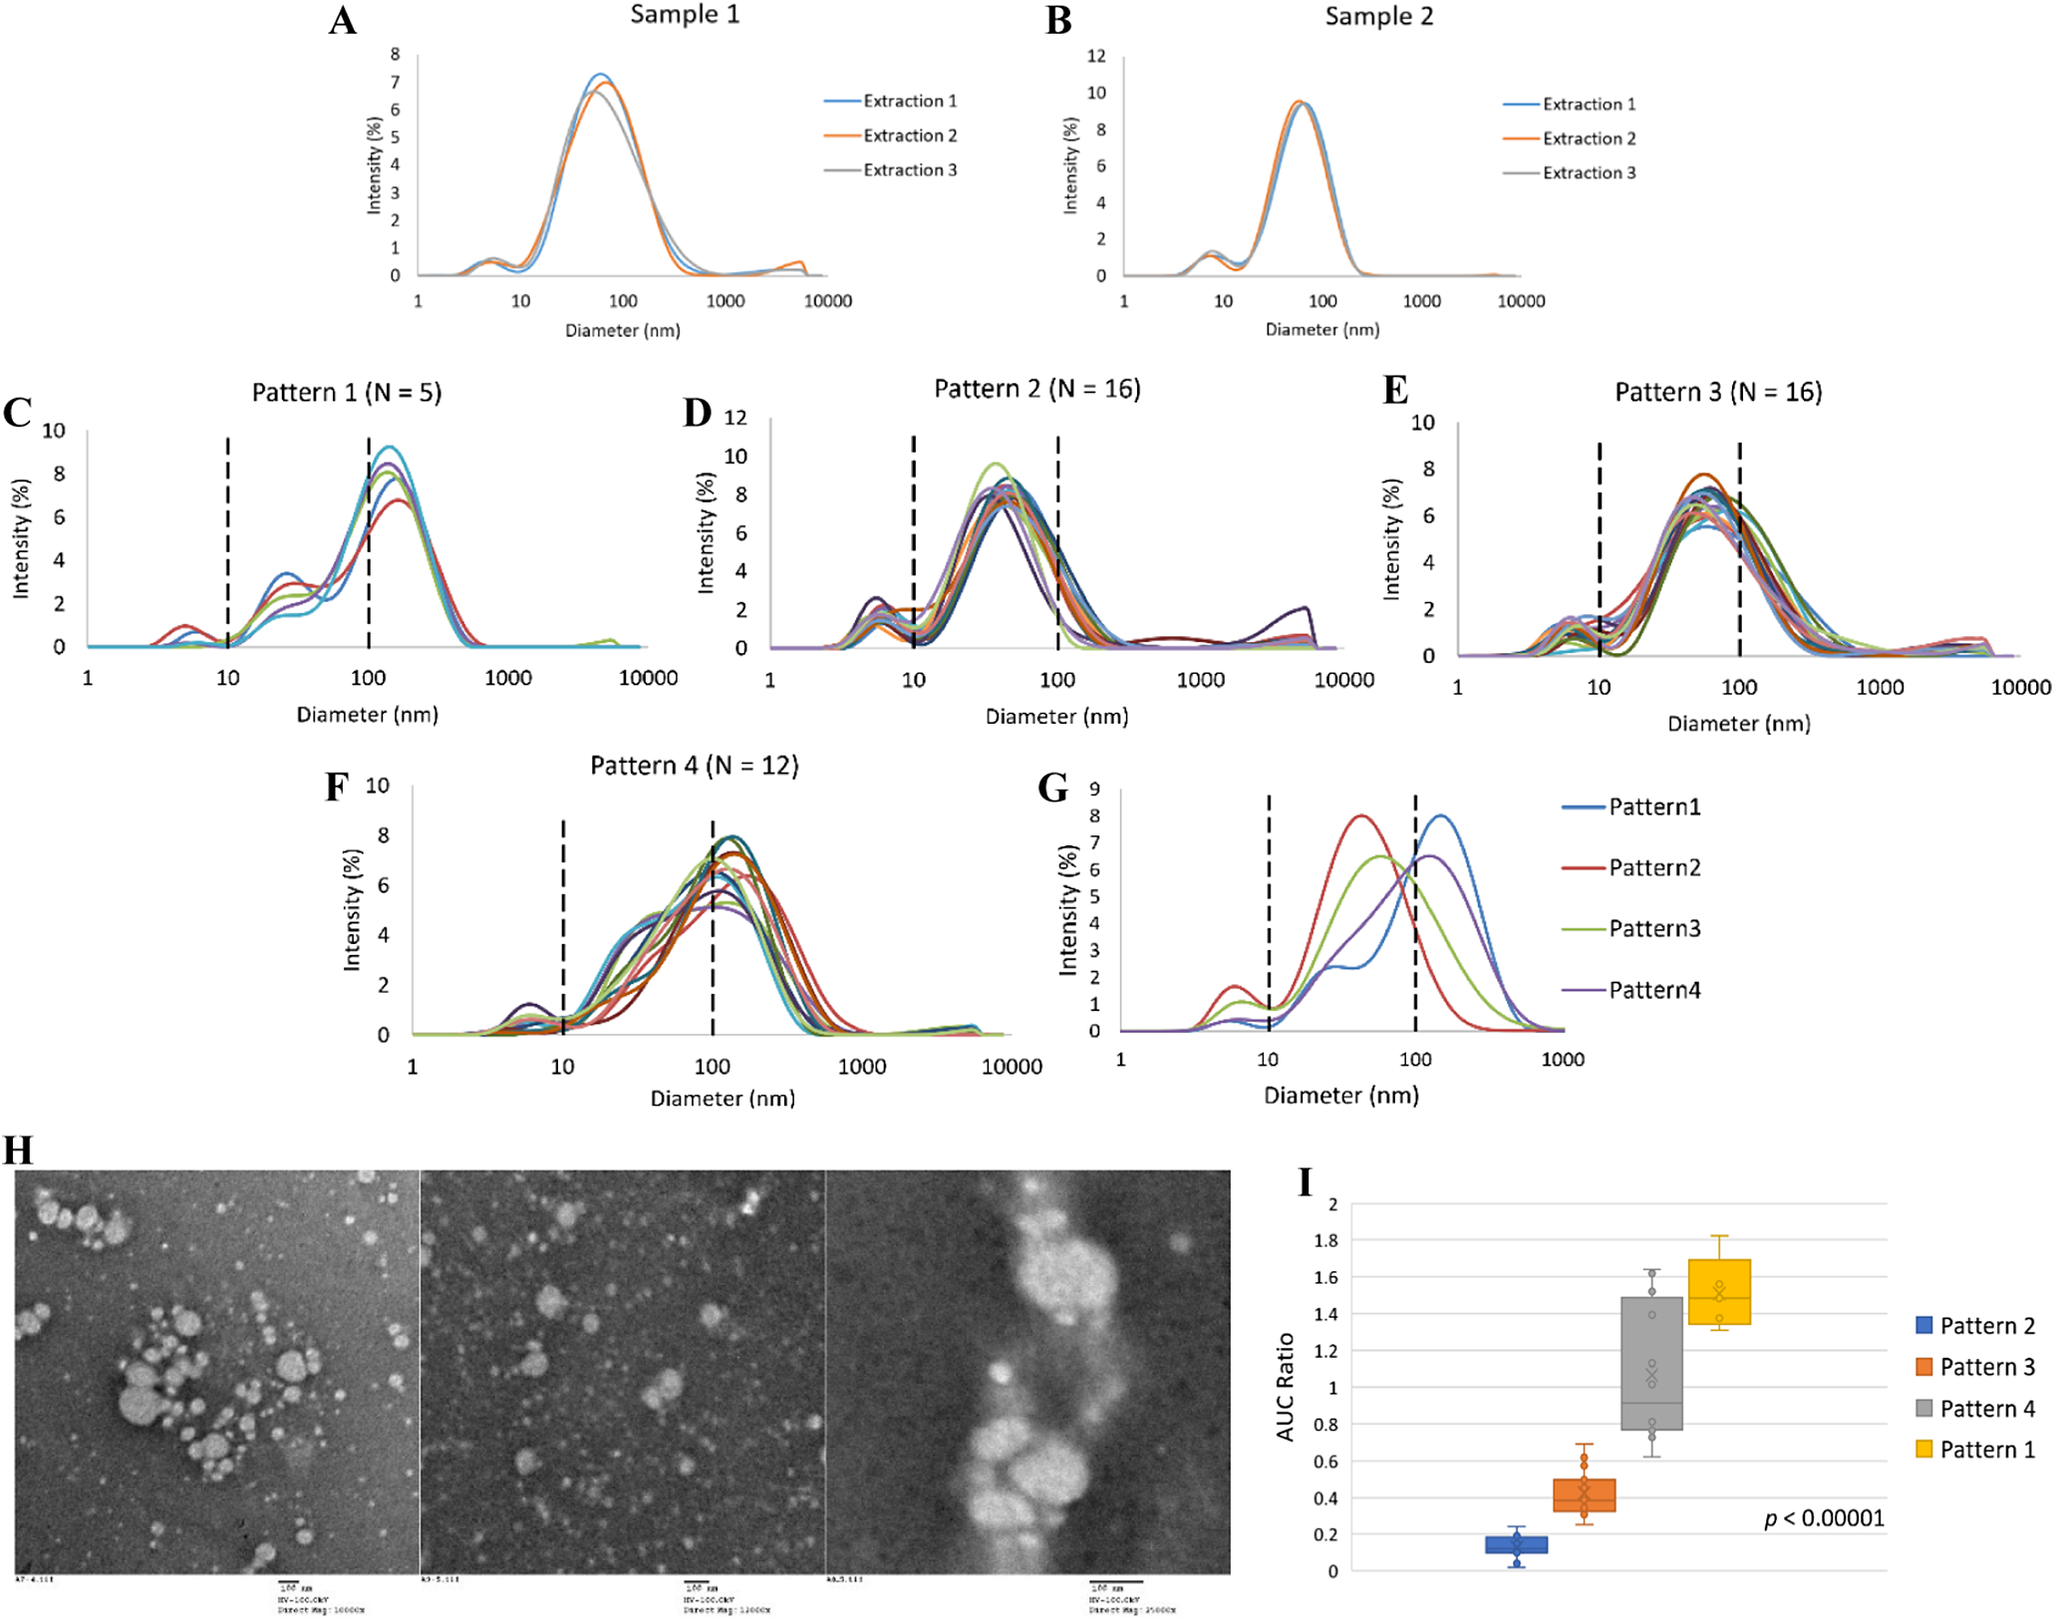
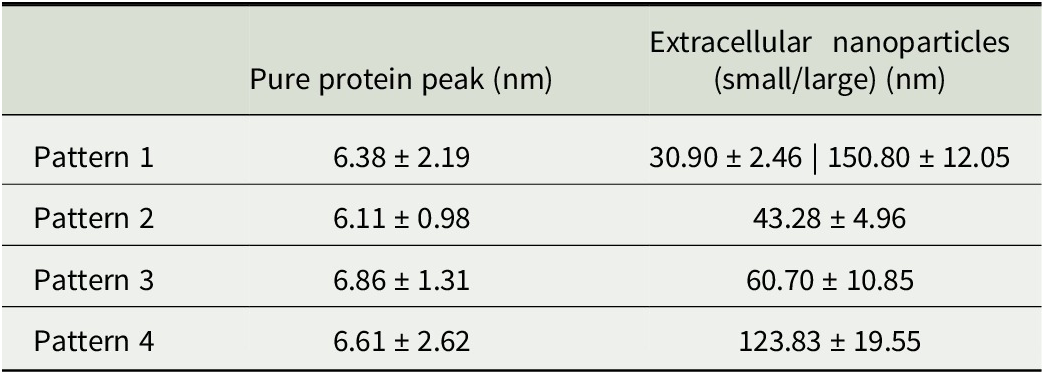
The intensity-averaged size and size distribution of nanoparticle extracts of all healthy control samples are presented in Figure 1. Figure 1a, b shows reproducibility study of two blood samples collected from two healthy control donors. Each sample was extracted three times, and the size distribution curves of both samples from different extractions show excellent reproducibility. Figure 1c–f shows the intensity-averaged size and size distribution of 49 healthy control samples. These 49 healthy controls have ages expanding from 20 years to 80 years. One of our study objectives was to determine if age affects the size and size distribution of EVs and other bio-nanoparticles. From these 49 samples, we found that the particle size distribution curves as determined by DLS can be grouped into one of four patterns (Figure 1c–f) according to the number and average size of the peaks. For Pattern 1 as seen in Figure 1c (N = 5), three particle size peaks are present: a peak at 6.38 ± 2.19 nm that are consistent with the size of most abundant blood serum or plasma proteins including serum albumin and immunoglobulin G [Reference Dąbkowska, Stukan and Kosiorowska39, Reference Luik, Naboka, Mogilevich, Hushcha and Mischenko40, Reference Conner, McAndrew, Menegatti and Velev41]; a second peak around 10–100 nm with an average diameter of 30.90 ± 2.46 nm that may include exomeres, supermeres [Reference Yu, Shi and Gao13], and lipoproteins [Reference German, Smilowitz and Zivkovic42, Reference Kong, Penaloza and Agreda43]; and a third peak between 100 and 1000 nm with an average diameter of 150.80 ± 12.05 nm which is consistent with the reported size of EVs [Reference Dilsiz9, Reference Doyle and Wang10]. For Pattern 2 (Figure 1d) (N = 16), the pure protein peak remains at around 6 nm. A second peak appeared between 20 and 50 nm with an average of 43.28 ± 4.96 nm. Pattern 3 (Figure 1e) (N = 16) is similar to Pattern 2, with only two size peaks present. The pure protein peak remains around 6 nm and the second peak, also the peak with the highest scattering intensity in the distribution curve, appeared between 50 and 100 nm with an average of 60.70 ± 10.85 nm. We chose a threshold of 50 nm to separate patterns 2 and 3, because most studies report that EVs are typically larger than 50 nm, while the sizes of exomeres and supermeres are smaller than 50 nm [Reference Zhang, Jeppesen and Higginbotham11, Reference Anand, Samuel, Mathivanan, Mathivanan, Fonseka, Nedeva and Atukorala12, Reference Yu, Shi and Gao13]. Pattern 4 (Figure 1f) (N = 12) includes size distributions that have the highest intensity peak at a size around or above 100 nm with an average of 123.83 ± 19.55 nm. The size distribution between 20 and 200 nm in pattern 4 is much more broadened than the other three patterns. In some cases, the broad peak is split into two peaks, similar to the two nanoparticle peaks observed in pattern 1. Among 49 samples, the pure protein peak was consistently present around 6 nm in 46 samples, while for the remaining 3 samples, this pure protein peak disappeared from the distribution curves. Figure 1g is the average size distribution of all samples in each of the four patterns. Table 1 is a summary of the key characteristics of these four size distribution patterns.
(a and b) Intensity-averaged particle size distribution curves of two healthy control samples from three different extractions; (c–f) intensity-averaged particle size distribution curves of healthy controls grouped into four patterns; (g) averaged size distribution curves of healthy control samples in four patterns; (h) representative TEM images of three samples from patterns 1, 3 and 4; and (i) area-under-the-curve (AUC) ratio of size region 100–1000 nm vs size region 10–100 nm of the four distribution patterns.

Figure 1. Long description
The figure consists of nine panels labeled A through I.
Panels A and B: Line graphs for Sample 1 and Sample 2 showing Intensity percentage on the Y-axis (0 to 12) versus Diameter in nanometers on a logarithmic X-axis (1 to 10000). Each graph shows three overlapping curves for Extraction 1, 2, and 3, with primary peaks between 50 and 100 nanometers.
Panels C, D, E, and F: Line graphs showing multiple individual curves for Pattern 1 (N equals 5), Pattern 2 (N equals 16), Pattern 3 (N equals 16), and Pattern 4 (N equals 12). Vertical dashed lines at 10 and 100 nanometers mark size regions. Pattern 1 and 4 show peaks shifted toward 100 to 200 nanometers, while Pattern 2 and 3 peak between 10 and 100 nanometers.
Panel G: A summary line graph comparing the averaged curves of the four patterns. Pattern 2 (red) peaks earliest near 50 nanometers, while Pattern 1 (blue) peaks latest near 150 nanometers.
Panel H: Three T E M micrographs showing spherical particles of varying sizes. The left image shows a cluster of larger vesicles, the middle shows smaller dispersed particles, and the right shows a dense vertical chain of vesicles. Scale bars indicate 100 nanometers.
Panel I: A box plot showing the A U C Ratio of the 100 to 1000 nanometer region versus the 10 to 100 nanometer region. From left to right, Pattern 2 has the lowest ratio (approximately 0.15), followed by Pattern 3 (approximately 0.4), Pattern 4 (approximately 1.1), and Pattern 1 (approximately 1.5). A p-value less than 0.00001 is noted.
Summary of average size in diameter of bio-nanoparticle extracts from human plasma samples.

Table 1. Long description
The table consists of three columns: Pattern type, Pure protein peak in n m, and Extracellular nanoparticles (small/large) in n m.
* Pattern 1: Pure protein peak is 6.38 plus or minus 2.19. Extracellular nanoparticles are 30.90 plus or minus 2.46 | 150.80 plus or minus 12.05.
* Pattern 2: Pure protein peak is 6.11 plus or minus 0.98. Extracellular nanoparticles are 43.28 plus or minus 4.96.
* Pattern 3: Pure protein peak is 6.86 plus or minus 1.31. Extracellular nanoparticles are 60.70 plus or minus 10.85.
* Pattern 4: Pure protein peak is 6.61 plus or minus 2.62. Extracellular nanoparticles are 123.83 plus or minus 19.55.
The nature of the broad peak observed in patterns 2, 3, and 4 in the size region between 20 and 200 nm is further elaborated. One limitation of DLS is not being able to clearly separate particles with sizes within 3–5 times of each other into distinct size peaks [Reference Stetefeld, McKenna and Patel44, Reference Varenne, Makky, Gaucher-Delmas, Violleau and Vauthier45, Reference Bhattacharjee46]. This leads us to hypothesize that the broader peak in the particle size region between 20 and 200 nm as observed in pattern 2, 3, and 4 may actually be the merging of two nanoparticle peaks as observed clearly in pattern 1, i.e., larger EVs above 100 nm and smaller nanoparticles between 20 and 50 nm, with the relative quantity of larger sized EVs in the nanoparticle population increasing in the order of pattern 2 < pattern 3 < pattern 4 < pattern 1. In pattern 1, the EV peak around 150 nm is fully resolved from the size peak around 20–50 nm due to the sufficiently large difference between the two nanoparticle populations. TEM analysis (Figure 1h) provided additional support to this hypothesis. Two major groups of nanoparticles were observed from TEM images: one in larger sizes with diameters between 100 and 200 nm and one in significantly smaller sizes with diameters between 20 and 50 nm.
To evaluate the relative quantity of larger-sized EVs versus smaller-sized remaining nanoparticles, we here introduce a simple method by calculating the scattering light intensity ratio represented by area-under-the-curve (AUC) between 100 and 1000 nm versus 10 and 100 nm peak region of the intensity-averaged distribution curves. As shown in Figure 1i, this ratio reflects the qualitative observation that the relative amount of larger-sized EVs versus other smaller-sized nanoparticles increases in the order of pattern 2 < pattern 3 < pattern 4 < pattern 1. One-way ANOVA analysis revealed statistically significant differences between these four distribution patterns (p < 0.00001).
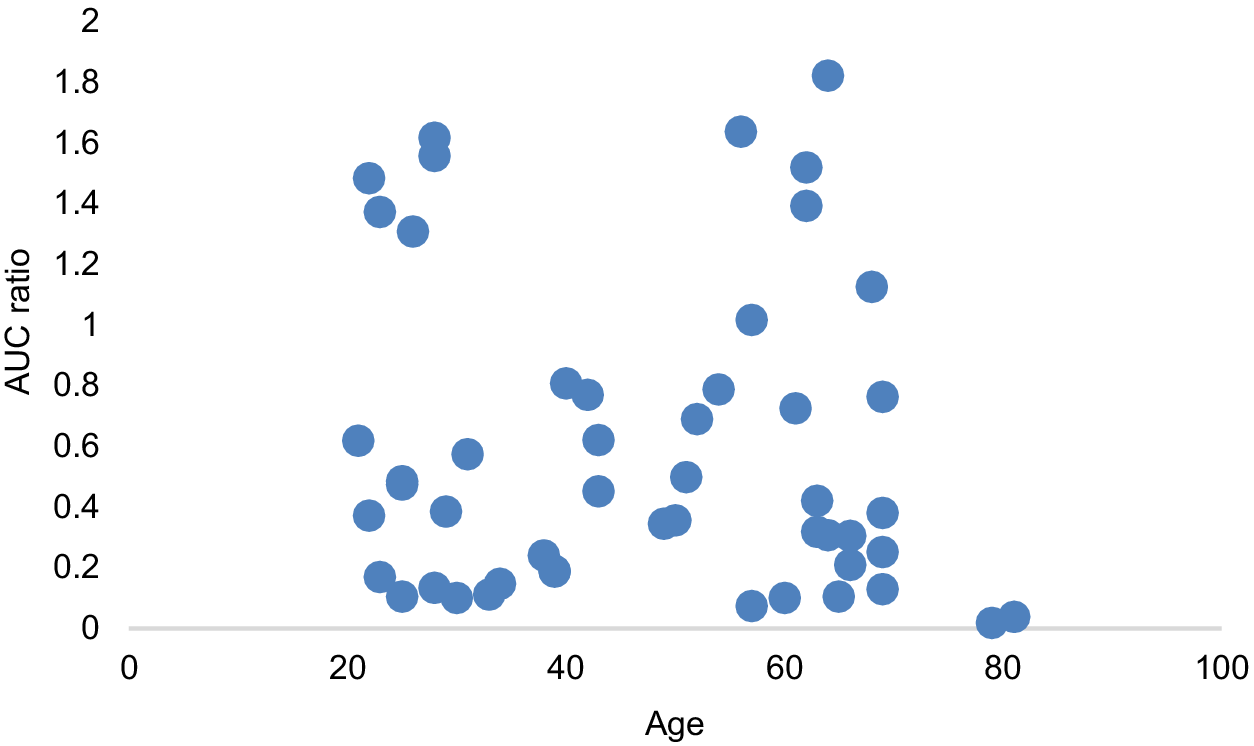
We used this AUC ratio to evaluate the potential relation between age and the relative quantity of larger versus smaller nanoparticles. As shown in Figure 2, while this ratio varies significantly between individuals, there is no significant correlation between age and relative quantity of larger EVs versus smaller-sized nanoparticle (Pearson’s correlation coefficient −0.11).
Area-under-the-curve (AUC) ratio of size region 100–1000 nm vs size region 10–100 nm over age for healthy controls.

Figure 2. Long description
The x-axis is labeled Age and ranges from 0 to 100 in increments of 20. The y-axis is labeled A U C ratio and ranges from 0 to 2 in increments of 0.2. The data is represented by blue circular markers scattered across the plot.
* Between ages 20 and 40, there is a cluster of points with A U C ratios ranging from approximately 0.1 to 1.6.
* Between ages 40 and 60, the points are more concentrated in the lower range between 0.2 and 0.8, with one outlier near 1.6.
* Between ages 60 and 70, there is a high density of points with a wide vertical spread from 0.1 to 1.8.
* Beyond age 80, there are only two data points, both located very close to the 0 value on the y-axis.
Overall, the distribution does not show a clear linear correlation, with significant variability in the A U C ratio across the middle age groups.
3.2. Size and Distribution Analysis of Nanoparticle Extracts from Patients with Colorectal Cancer
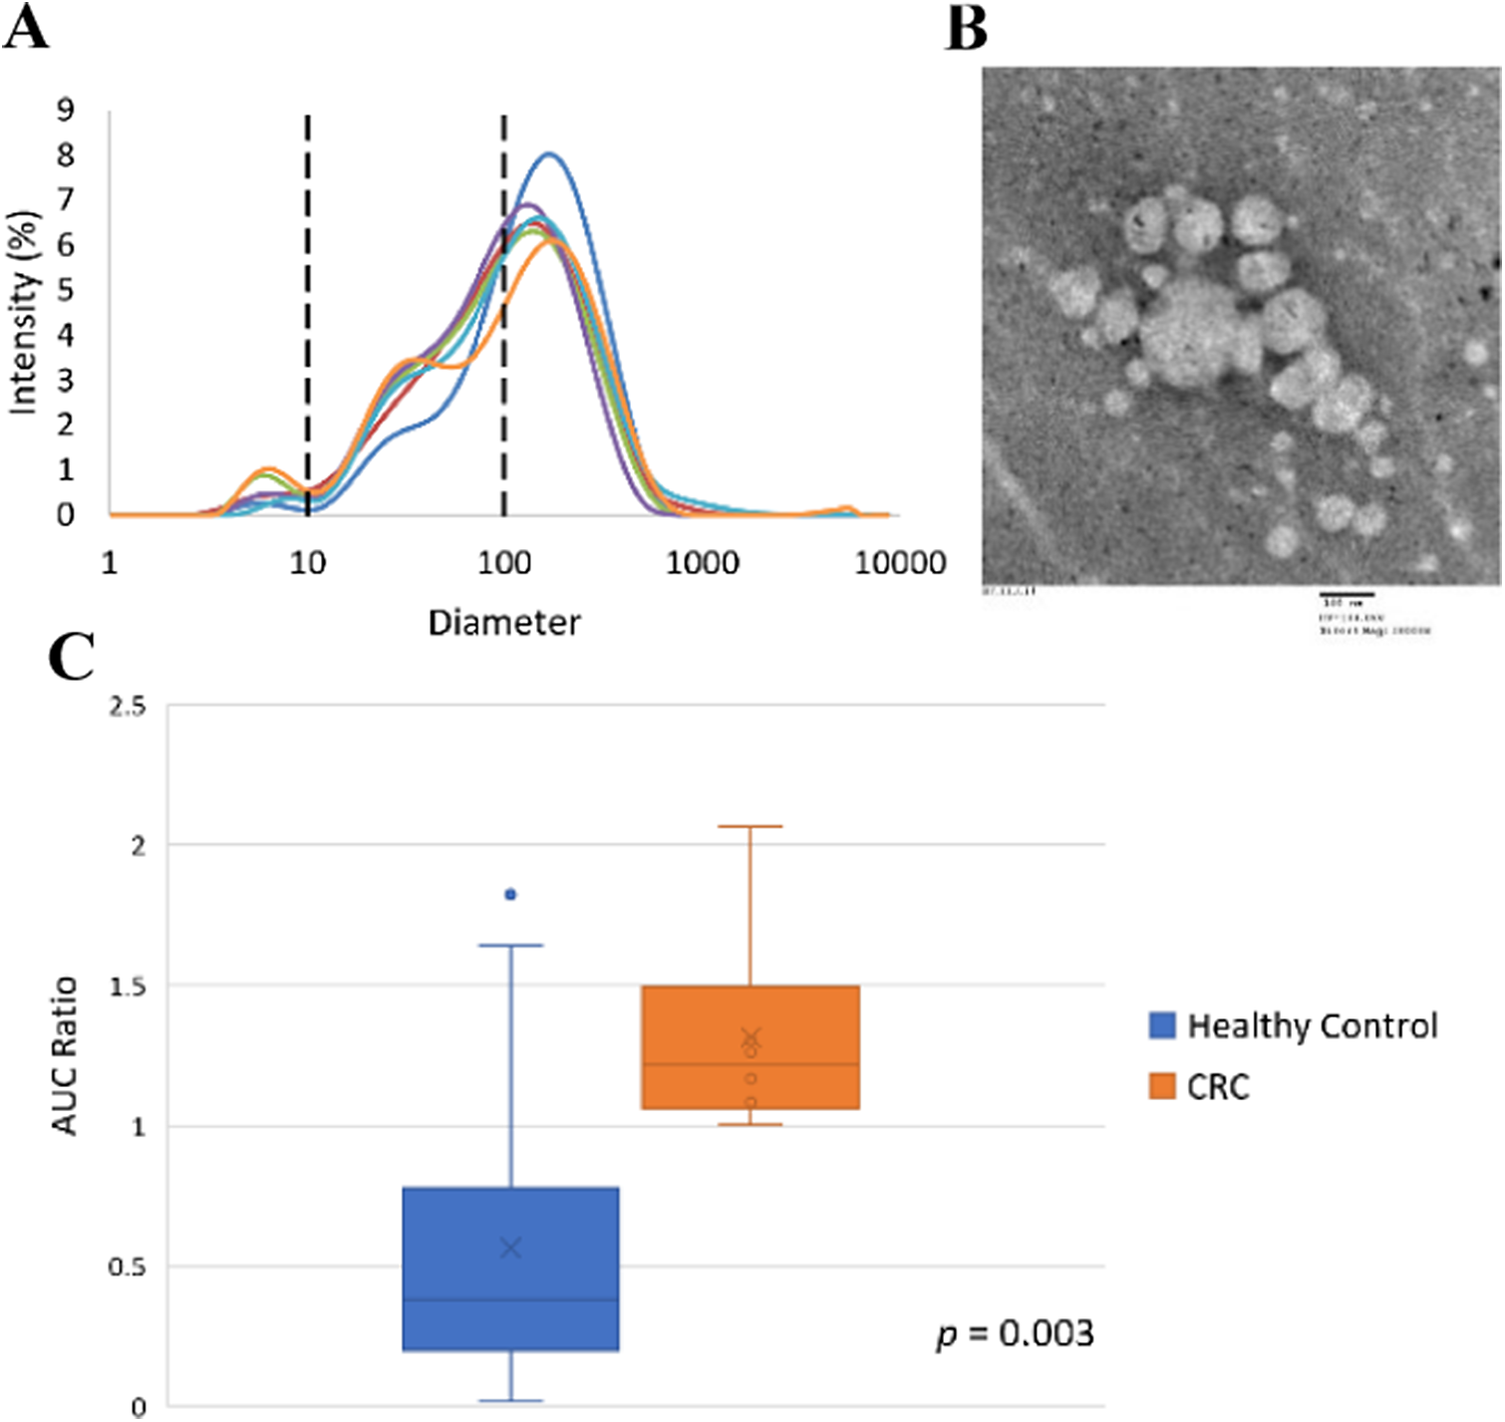
Figure 3a is the size distribution of colorectal cancer patient samples. The six patients with colorectal cancer all have advanced stage (III and IV) cancer. The size distribution patterns of all six colorectal cancer patients appear to fall into the category of pattern 4 with relatively higher numbers of larger-sized EVs when compared to healthy control samples. The calculated AUC ratio between size 100–1000 nm over size 10–100 nm (Figure 3b) of the colorectal cancer group is significantly higher than that of the age-matched healthy control group (age >38 years and older). A t-test revealed a statistically significant difference between the means of healthy control samples (mean = 0.56 ± 0.23) and patients with colorectal cancer (mean = 1.31 ± 0.23), with p = 0.003. The TEM image (Figure 3c) further verifies the size distribution patterns as revealed by DLS. It is noted here during TEM analysis that it was much easier to find larger-sized EVs on TEM grids from colorectal cancer patient samples than from healthy controls.
(a) Size distributions of CRC patient samples (N = 6); (b) a representative TEM image of a stage IVB CRC patient sample; and (c) area-under-the-curve ratio of size region 100–1000 nm vs size region 10–100 nm of healthy control samples with age above 38 years (N = 33) and patients with CRC (N = 6).

Figure 3. Long description
Panel A is a line graph showing Intensity in percent on the y-axis from 0 to 9 and Diameter on a logarithmic x-axis from 1 to 10000. Six colored lines represent different C R C patient samples. Two vertical dashed lines mark the 10 and 100 nanometer thresholds. Most curves peak between 100 and 200 nanometers with a secondary smaller peak around 30 to 50 nanometers. Panel B is a grayscale T E M micrograph showing a cluster of spherical extracellular vesicles of varying sizes against a mottled background. A scale bar at the bottom right indicates 100 nanometers. Panel C is a box and whisker plot comparing the A U C Ratio on the y-axis from 0 to 2.5. The blue box represents Healthy Control with a median near 0.4 and an outlier near 1.8. The orange box represents C R C with a higher median near 1.2 and a range from 1.0 to 2.1. A p-value of 0.003 is noted at the bottom right of the plot.
3.3. Size and Distribution Analysis of Nanoparticle Extracts from Patients with Prostate Cancer
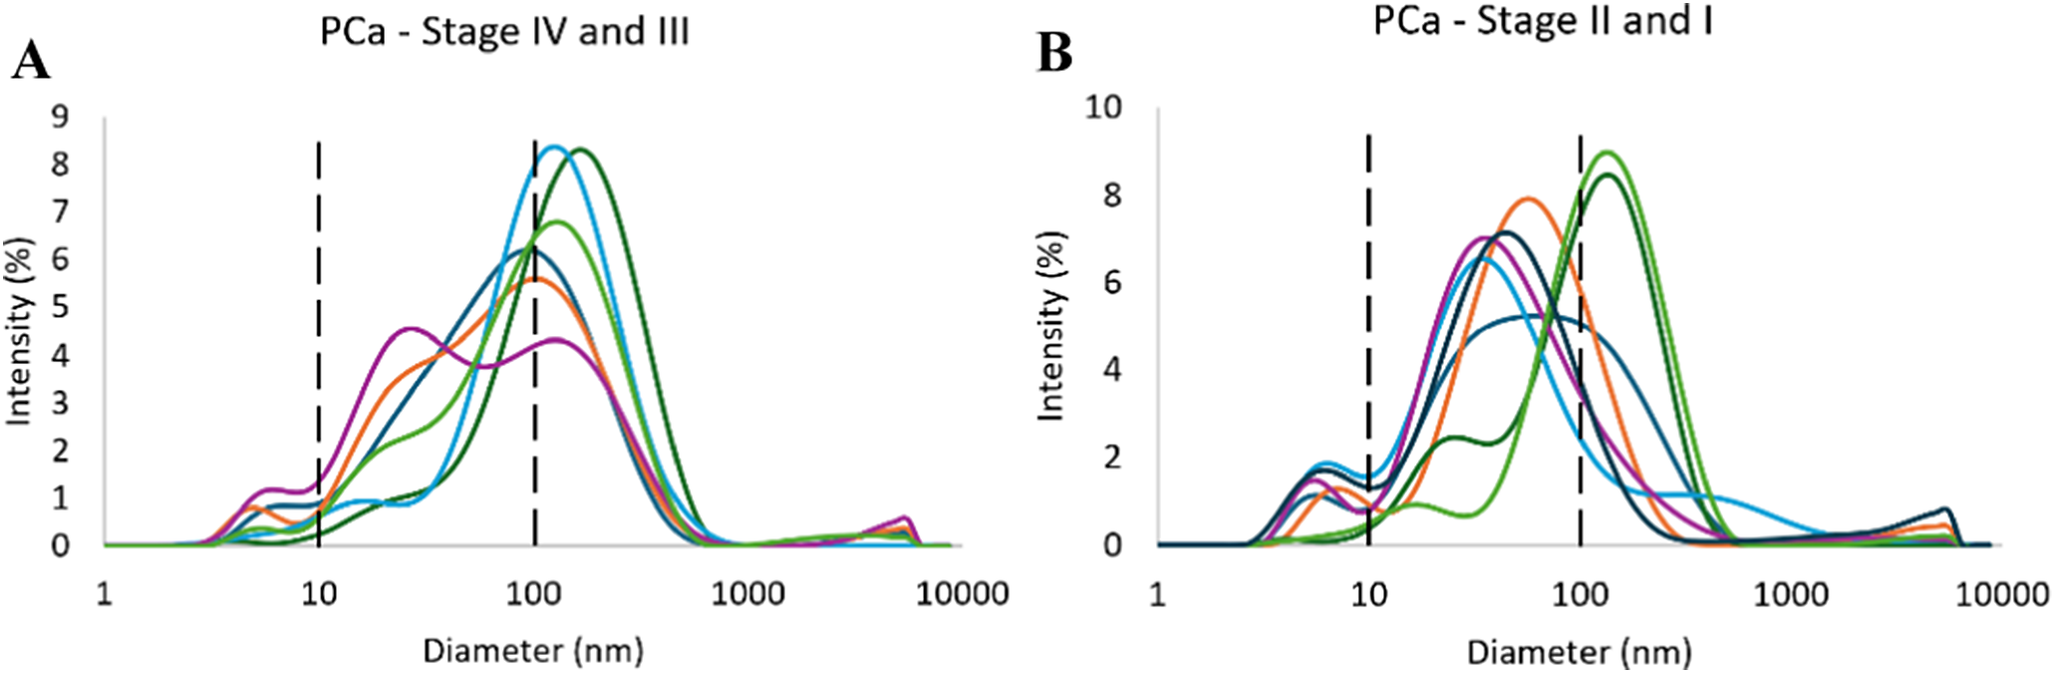
The size distribution curves of all six patients with advanced-stage prostate cancer (III and IV) fall into pattern category 4 (Figure 4a), with larger-sized EV peak (>100 nm) as the dominant peak. The size distribution curves of these six advanced-stage prostate cancer samples are very similar to those of advanced colorectal cancer samples. For patients with early-stage prostate cancer (I and II), five out of seven samples present a size distribution curve that falls into pattern 2, while two samples show a pattern 4 distribution, like the advanced-stage prostate cancer and advanced stage colorectal cancer samples (Figure 4b).
Size distributions of PCa patient samples with (a) stage IV and III cancer (N = 6) and (b) stage II and I cancer (N = 7).

Figure 4. Long description
A two-panel set of line graphs labeled A and B. Both graphs share the same axes: the x-axis represents Diameter in n m on a logarithmic scale from 1 to 10000, and the y-axis represents Intensity in percent from 0 to 10. Vertical dashed black lines are positioned at 10 n m and 100 n m in both panels.
* Panel A, titled P Ca - Stage I V and I I I: Contains six overlapping colored curves. The curves show a minor peak between 1 and 10 n m, a moderate peak between 10 and 100 n m, and a primary dominant peak between 100 and 1000 n m. The highest intensity reaches approximately 8.5 percent at a diameter of roughly 150 n m.
* Panel B, titled P Ca - Stage I I and I: Contains seven overlapping colored curves. Similar to panel A, there is a small peak below 10 n m. However, the distribution between 10 and 1000 n m is more varied. Several curves show a prominent peak between 30 and 80 n m, while others peak more sharply between 100 and 200 n m. The maximum intensity reaches approximately 9 percent at roughly 130 n m.
3.4. Size and Distribution Analysis of Nanoparticle Extracts from Patients with Alzheimer’s Disease
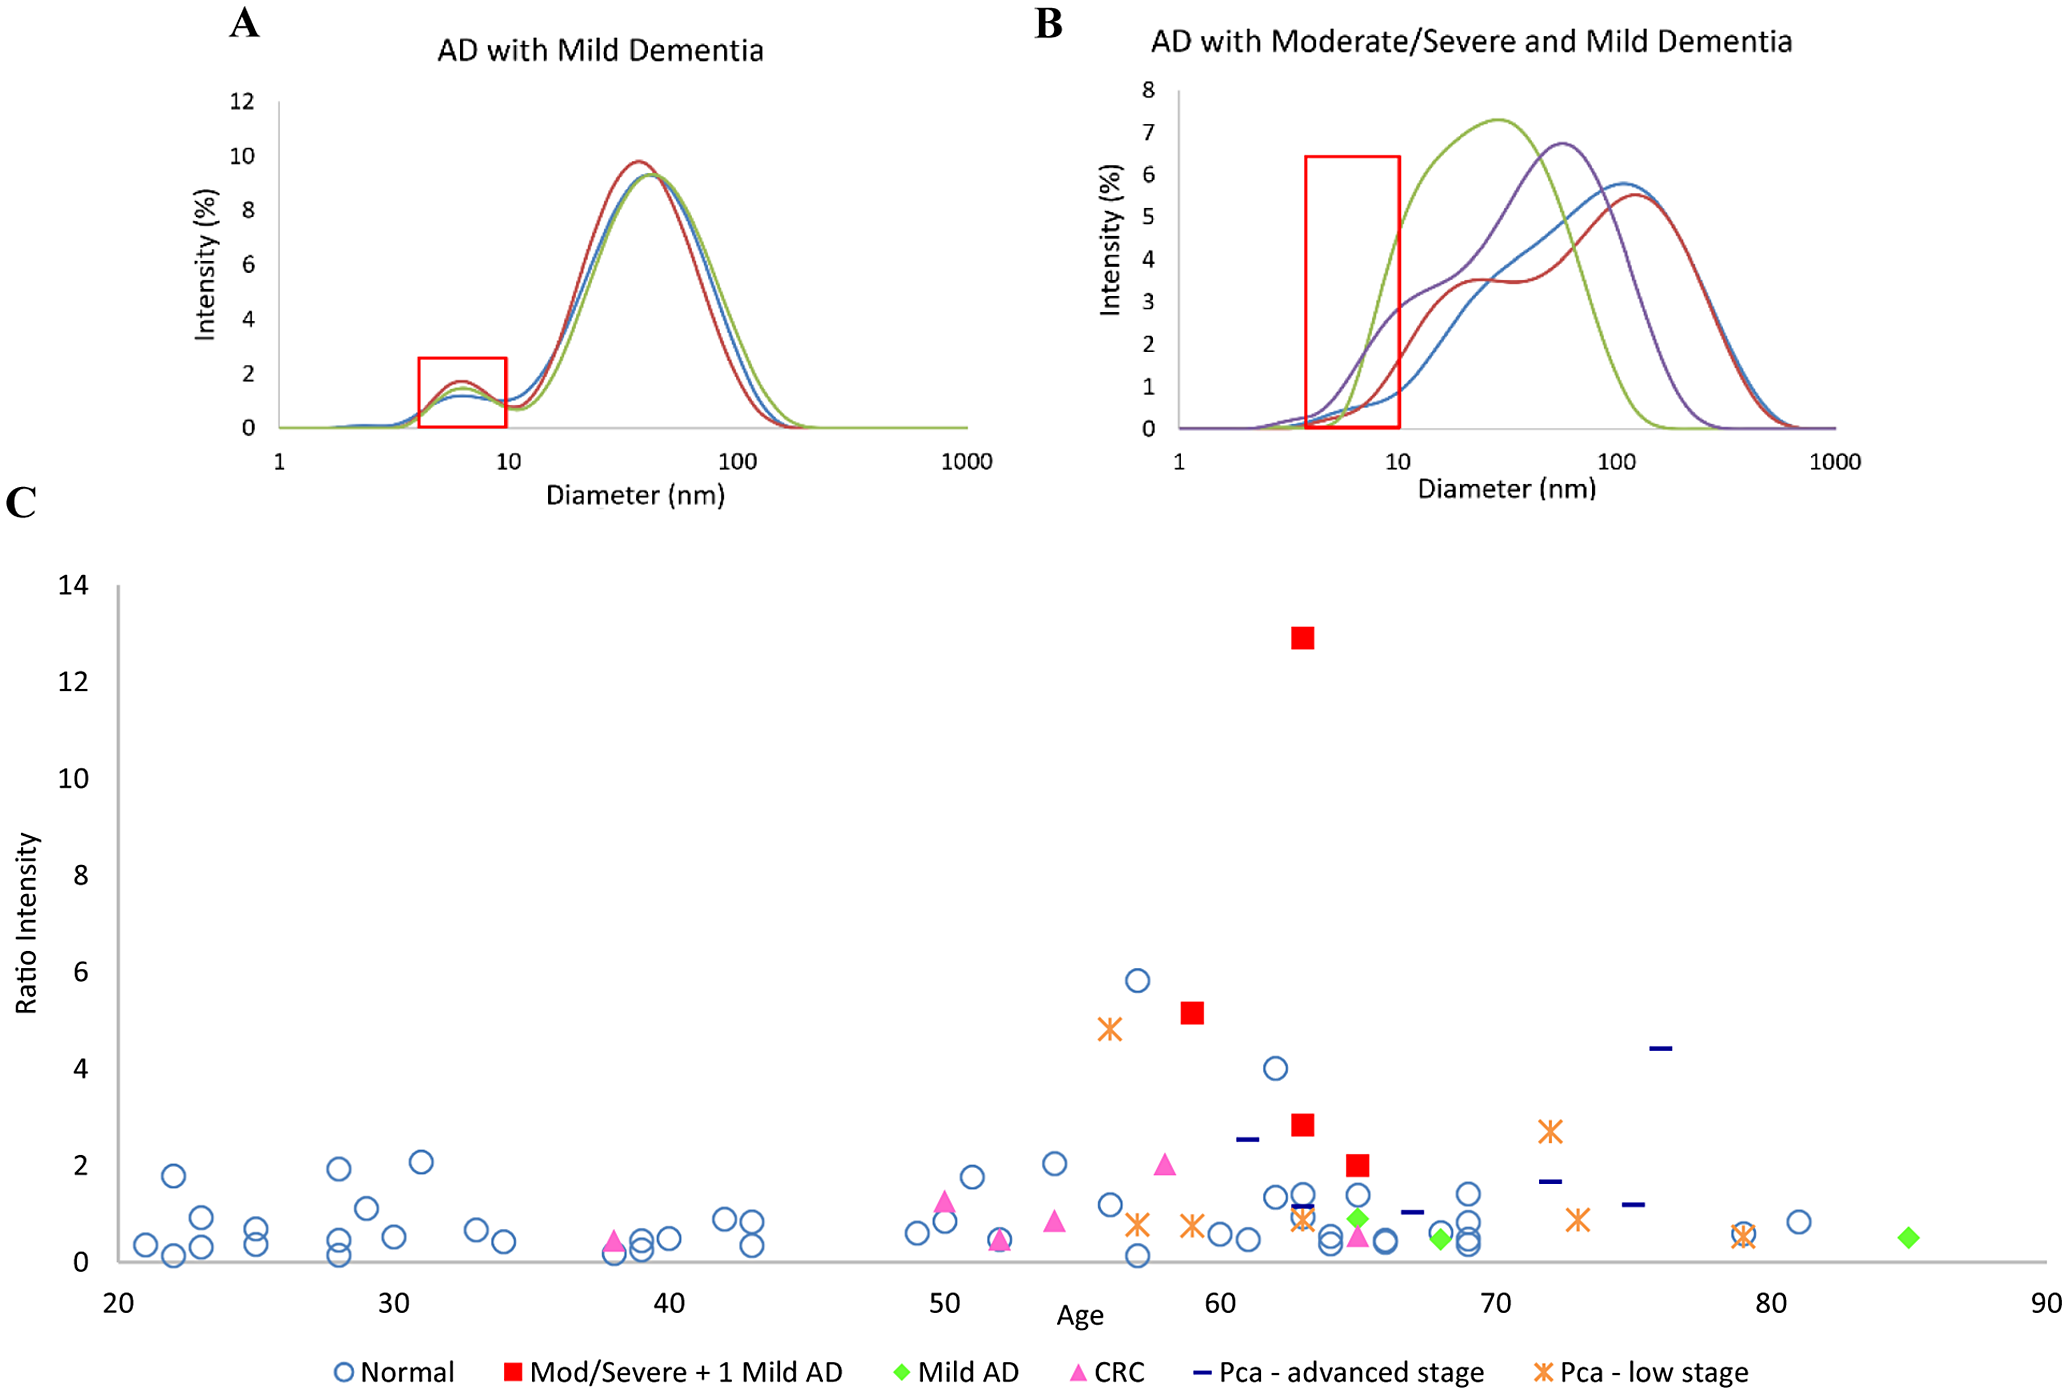
For the seven AD patients, there are two patterns of nanoparticle size distributions (Figure 5a, b). Three out of four AD patients with mild dementia had predominantly smaller-sized nanoparticles in the size region between 20 and 50 nm, with an average diameter of 43.8 nm (Figure 5a). This size distribution pattern falls into pattern 2 category. The pure protein peak also appeared clearly around 6 nm from the 3 AD patients with mild dementia. However, the size distribution curves of samples from all three AD patients with moderate and severe dementia and one AD patient with mild dementia exhibit very distinct patterns from healthy controls and cancer patient samples (Figure 5b). The distribution curves are much broader, extending from about 5 to 1000 nm. The pure protein peak appeared to have shifted beyond 6 nm and merged with other nanoparticle peaks into one large, broad peak (refer to red box highlight in Figure 5a, b). Broad size distribution curves are typical of samples that contain protein, polymer, and nanoparticle aggregates [Reference Rodriguez-Loya, Lerma and Gardea-Torresdey47, Reference Zheng, Bott and Huo48, 49]. Because protein oligomers and aggregates are hallmarks of AD, we hypothesize that the unique size distribution pattern observed from these four AD patients may indicate the presence of protein oligomers/aggregates or other neurodegenerative disease-related nanoparticles, such as β-amyloid peptide oligomers, fibrils, or plaques in the blood. In the study by Esparza et al, soluble amyloid-beta aggregates in the size range of 10–20 nm were detected from AD patients’ brain [Reference Esparza, Wildburger and Jiang33]. A report by Ono et al reveals that amyloid β-protein trimer and tetramer have a diameter of 7 and 11 nm, respectively [Reference Ono, Condron and Teplow50]. Overall, most studies found that β-amyloid protein oligomers have an average size around 5–15 nm and protofibrils are in the size range of 100 s nm [Reference Sakono and Zako51].
Size distributions of AD patient samples with (a) mild dementia (N = 3); (b) moderate/severe (N = 3) or mild dementia (N = 1); and the (c) Ratio of light scattering intensity at 10.1 nm vs 5.61 nm of healthy samples (N = 49), patients with cancer (N = 19), and patients with dementia (N = 7).

Figure 5. Long description
Panel A, titled A D with Moderate/Severe and Mild Dementia, is a line graph with Intensity percentage on the y-axis (0 to 8) and Diameter in n m on a logarithmic x-axis (1 to 1000). Four curves (green, blue, purple, red) show peaks between 10 and 200 n m. A red rectangular box highlights a low-intensity region between 4 and 10 n m.
Panel B, titled A D with Mild Dementia, shows three curves (red, blue, green) with a primary peak around 40 n m reaching 10 percent intensity. A red rectangular box highlights a secondary, smaller peak between 4 and 10 n m.
Panel C is a scatter plot showing Ratio Intensity on the y-axis (0 to 14) versus Age on the x-axis (20 to 90). The legend includes: Normal (blue circles), Mod/Severe plus 1 Mild A D (red squares), Mild A D (green diamonds), C R C (pink triangles), Pca - advanced stage (dark blue dashes), and Pca - low stage (orange asterisks). Most data points cluster below a ratio of 2 across all ages. However, the red squares (Mod/Severe A D) show significant outliers with ratio intensities reaching approximately 13, 5, and 3 between ages 60 and 65.
For most non-AD patient samples (here referring to healthy controls and cancer patient samples analyzed in this study), the scattering light intensity around 10.1 nm is low and this size diameter divides the pure protein peak around 6 nm clearly from the next nanoparticle peak between 20 and 50 nm, while for the four AD patients, the scattering light intensity at 10.1 nm increased significantly. At a more quantitative level, we calculated the ratio of light scattering intensity at 10.1 nm versus 5.6 nm. This ratio from all healthy samples, patients with cancer, and patients with dementia was calculated and plotted as seen in Figure 5c. It is interesting to note that, beyond age 50, a significant number of samples including a few from healthy controls, cancer patients and four AD patients, show a substantially higher ratio than the samples from those that are below age 50. It is well known that AD is an ageing-related disease and pathological changes in the brain occur 15–20 years before clinical symptoms appear in AD patients [Reference Betthauser, Bilgel and Koscik52]. While we do not have the AD status information on the healthy control and cancer patient samples, there is a possibility that some ageing adults in the healthy control and cancer group have an increased level of certain protein oligomers/aggregates or other neurodegeneration-related nanoparticles and complexes in their blood than younger adults. Additional studies need to be conducted to confirm the identity and structure of this specific nanoparticle population around 10 nm associated with advanced AD and ageing.
4. Discussion
The development of highly reproducible protocols for bio-nanoparticle extraction from complex biological fluid and sample matrix is the first and most important pre-analytical step towards successful development of clinical application. By using a simple syringe filtration combined with a relatively low g force centrifugation, we demonstrate that bio-originated nanoparticles including large and small extracellular nanoparticles and protein aggregates can be extracted with high efficiency and reproducibility. Due to the relatively low cost of the instrumentation and its simplicity, this extraction protocol can be readily adopted for clinical laboratory settings for potential diagnostic applications.
Our study demonstrated some unique capabilities and advantages of DLS for bio-nanoparticle extract analysis. Since its first commercialization in the 1970–80s, DLS has been a mainstream laboratory tool for nanoparticle sizing analysis. Most commercial DLS instruments have a specified particle size analysis range from 0.3 nm to 10 μm, with a typical working range between 1–3 nm and 3–6 μm. Most free proteins in blood including the two most abundant proteins, serum albumin and immunoglobulin G (IgG), have a hydrodynamic diameter between 5 and 10 nm [Reference Dąbkowska, Stukan and Kosiorowska39, Reference Luik, Naboka, Mogilevich, Hushcha and Mischenko40, Reference Conner, McAndrew, Menegatti and Velev41]. With its lower size detection limit of 1–3 nm, DLS is one of the most widely used tools for protein size analysis and protein aggregation studies [49]. In recent years, another nanoparticle sizing technique called nano tracking analysis (NTA) has gained increased popularity as a nanoparticle analysis tool, especially in the extracellular nanoparticle research field. NTA has certain advantages over the DLS technique, for example, the capability of measuring particle concentration directly from raw data. However, the particle size limit of NTA for biological particles is around 30–50 nm for the lower size limit and 1–2 μm for the upper size limit [Reference Kowkabany and Bao53]. With these limitations, bio-nanoparticles smaller than ~30–50 nm are not detected in NTA analysis. This limitation was demonstrated in our previously reported side-by-side comparison study on exosome extracts from cell culture media [Reference Ambrosius, Vaidya and Joshua38]. The capability of DLS to measure particle sizes from a few nm to a few microns allows the detection and analysis of a wide range of nanoparticles in complex biological fluid samples following some simple pre-analytical extraction steps. By comparing the relative distribution of multiple nanoparticle populations simultaneously in one extract, more disease-specific or relevant characteristics may be revealed compared to the detection and analysis of a single nanoparticle population alone.
This potential application is illustrated by the preliminary data observed from our current study. Despite limited sample size, consistent results were observed from patients with advanced-stage cancer. All six patients with advanced-stage colorectal cancer presented a size distribution pattern (pattern 1 or 4) with larger-sized EV peak as the dominant peak. All six patients with stage III and IV prostate cancer also showed larger-sized EVs above 100 nm as the dominant nanoparticle peak, similar to the advanced-stage colorectal cancer. Among the seven early-stage prostate cancer patient samples, two showed similar trends as the advanced-stage prostate cancer and colorectal cancer samples, and the remaining five samples had smaller-sized extracellular nanoparticles as the dominant peak. These findings coincide with previously published studies that found cancer-derived extracellular nanoparticles to be much larger than healthy control-derived extracellular nanoparticles, and the increased nanoparticle size may be more commonly associated with advanced-stage cancer [Reference Minciacchi, Freeman and Di Vizio54, Reference Ciardiello, Migliorino, Leone and Budillon55].
In this study, we demonstrate a simple method to evaluate the relative quantity of larger EVs versus smaller extracellular nanoparticles by calculating the AUC ratio of the size distribution curve between 100 and 1000 nm over a size range between 10 and 100 nm. The 100 nm cutoff value is an empirical value, roughly based on the difference between normal versus cancer samples. We chose this value for demonstration purposes only. Clinical performance parameters, including optimized cutoff values, sensitivity, specificity, and positive and negative predictive values of new clinical tests, will need to be established through more extensive clinical studies with a significantly larger sample size. A receiver operating characteristic (ROC) curve will be established from the study, and a particle size cutoff value along with optimal sensitivity and specificity can be determined from the ROC curve [Reference Nahm56].
In addition to the larger particle size region, from the smaller nanoparticle size region, especially between the pure protein peak around a few nm and smaller sized nanoparticles between 10 and 50 nm region, unique distribution patterns signaling the potential presence of protein oligomers and aggregates or other nanoparticles more specific to neurodegeneration or ageing were observed from AD patients, as suggested by the disappearance of pure protein peak and increased light scattering intensity around and above 10 nm. The data and observations made from cancer patient and AD patient samples in our study imply that if an unknown sample is presented for analysis using our reported protocol, it is possible to obtain multiple disease-related clinical information from one sample and one analysis. While such data may not be used as independent diagnostic biomarkers, it may still provide valuable clinical information on the status and progress of diseases such as cancer and neurodegenerative diseases.
5. Conclusions
In this study, we demonstrated a rapid and simple pre-analytical protocol for extracting bio-originated nanoparticles from human blood samples. This protocol, involving a simple syringe filtration and centrifugation process using a bench-top centrifuge, is suitable for clinical workflows. Using DLS, multiple bio-nanoparticle targets ranging from pure proteins and protein aggregates to small and large extracellular nanoparticles can be detected from a single extraction. The size and size distribution patterns of the extracted biological nanoparticles may reveal disease-specific or relevant information with diagnostic and prognostic value. Based on these preliminary data, further extensive clinical studies are merited to validate the method developed and findings made from this study.
Author Contributions
H.A. collected and analyzed data, prepared and revised the manuscript; D.H.T. collected data; P.H.T. collected data; Q.H. conceived the study, secured funding, designed the experiments, revised and edited the manuscript; K.S. conceived the study, secured funding, and edited the manuscript.
Acknowledgments
This study was supported by the Florida Cancer Innovation Fund, Florida Department of Health, under the project “Innovative Cancer Diagnosis Using Saliva-Derived Exosomes” (#MOABC).
Competing Interests
The authors declare that they have no competing interests.
Data Availability Statement
All data reported in this study can be made available upon request to corresponding authors.
Open peer review
To view the open peer review materials for this article, please visit http://doi.org/10.1017/S2978170126000014.
Abbreviations
PEG, polyethylene glycol; SEC, size exclusion chromatography; NTA, nanoparticle tracking analysis; DLS, dynamic light scattering; CRC, colorectal cancer; PCa, prostate cancer; AD, Alzheimer’s disease; Aβ, amyloid-β; GBM, Glioblastoma Multiforme

 Open access


Comments
Dear Dr. Rotello:
We are submitting a manuscript entitled “Non-Disruptive Extraction and Accurate Particle Sizing Analysis of Bio-Originated Nanoparticles in Human Blood Plasma with Potential Diagnostic Applications” for your consideration to be published by Cambridge Materials: Health as a research article. In this manuscript, we report a rapid and non-disruptive protocol to extract multi-type bio-nanoparticles in human blood plasma samples with high efficiency and reproducibility. Using dynamic light scattering as the particle sizing technique, we were able to detect four different types of bio-nanoparticles in human blood samples, including extracellular vesicles, exomeres/supermeres, protein aggregates and pure proteins. By examining the size distribution patterns of the extracted bio-nanoparticles, we observed differences between samples from cancer patients, patients with Alzheimer’s disease versus healthy controls. While our study is still limited in terms of sample size, the results obtained from our study point out a promising direction that the physical characteristics such as size and size distribution pattern of bio-originated nanoparticles may serve as potential disease biomarkers. Our new protocol and methods can be easily adapted by other researchers working in similar fields. We believe our work will attract a broad audience from research community with emphasis on biomedical application development of nanomaterials.
Thank you in advance for your kind consideration and we look forward to further discussion with you about our work and manuscript!
Sincerely,
Qun Huo (Ph.D)
Professor
Department of Chemistry and NanoScience Technology Center
University of Central Florida
Kiminobu Sugaya (Ph.D.)
Professor of Medicine
Head of Neuroscience
Chair of Multidisciplinary Neuroscience Alliance
Chair of Institutional Review Board
Burnett School of Biomedical Sciences
College of Medicine
University of Central Florida