1. Introduction
During early Mesozoic time, the united proto-SE Asia continent was formed by the amalgamation of the North Indochina, Central Indochina, West Indochina, South China, Sibumasu, North Qiangtang, South Qiangtang and Simao blocks (Metcalfe Reference Metcalfe2006, Reference Metcalfe2011; Dong et al. Reference Dong, Zhang, Long, Yang, Ji, Wang, Hu and Chen2008; Shu et al. Reference Shu, Zhou, Deng, Wang, Jiang, Yu and Zhao2009; Arboit et al. Reference Arboit, Collins, King, Morley and Hansberry2014, Reference Arboit, Collins, Morley, Jourdan, King, Foden and Amrouch2016; Faure et al. Reference Faure, Lin, Chu and Lepvrier2016 a, b; Dew et al. Reference Dew, Collins, Glorie, Morley, Blades, Nachtergaele, King, Foden, De Grave, Kanjanapayont, Evans, Alessio and Charusiri2018; Rossignol et al. Reference Rossignol, Bourquin, Hallot, Poujol, Dabard, Martini, Villeneuve, Cornée, Brayard and Roger2018; Wang et al. Reference Wang, Qian, Cawood, Liu, Feng, Zhao, Zhang, He and Zhang2018). Controlled by the amalgamation of the above blocks, the South China Block (SCB) experienced significant changes in the tectonic structures during early Mesozoic time as an important component of SE Asia. Multidisciplinary research in petrology, structural geology, geochemistry and isotope dating has refined our understanding of the tectonic evolution of the SCB ( Zhang et al. Reference Zhang, Xu, Jia and Shu2009, Reference Zhang, Dong, Li, Cui, Shi, Su and Li2012; Faure et al. Reference Faure, Lin, Chu and Lepvrier2016 a, b; Xu et al. Reference Xu, Lan, Kong, Cheng and Wang2018 a, Reference Xu, Kong, Cheng, Lan and Wang2020; Kong et al. Reference Kong, Xu, Cheng and Wang2021 a, b). The latest studies suggest that the subduction and collision of the Palaeo-Tethys Ocean and the SCB below the Qiangtang–Indochina Block during the Triassic Period controlled the development of southern peripheral belts and intra-continental subduction (Faure et al. Reference Faure, Lin, Chu and Lepvrier2016 b). Middle Jurassic–Cretaceous NE–NNE-trending fold-and-thrust structures, as well as 180–152, 130–120 and 108–87 Ma I-, S- and A-type granites and volcanic rocks parallel to the South China coast show the dominance of the Palaeo-Pacific Ocean subduction in the tectonic evolution of the SCB (Li & Li, Reference Li and Li2007; Wang et al. Reference Wang, Zhang, Fan, Zhang and Zhang2013; Yang & He, Reference Yang and He2013). However, the tectonic evolution during Late Triassic – Early Jurassic time remains controversial. Some researchers propose that the collision between the South China and Indochina blocks controlled the tectonic evolution of the SCB (Shu et al. Reference Shu, Zhou, Deng and Yu2006; Faure et al. Reference Faure, Lin, Chu and Lepvrier2016 b; Xu et al. Reference Xu, Kong, Cheng, Lan and Wang2020), while others believe that the subduction of the Palaeo-Pacific Ocean played a more important role (Zhao et al. Reference Zhao, Xu, Zhang, Yang, Zhang and Hu2004; Xu et al. Reference Xu, Cheng, Wang, Zhang, Shen and Yu2013 c; Hu et al. Reference Hu, Cawood, Du, Yang and Jiao2015 b). Undoubtedly, determining the Late Triassic – Early Jurassic tectonic setting in the SCB can provide further clues about the Mesozoic tectonic evolution of the SCB, Palaeo-Pacific Block subduction history and even the formation process of the continent of SE Asia.
As a common accessory mineral in igneous and metamorphic rocks, zircon can be enriched in clastic sediments widely because of its remarkable resistance against physical abrasion and chemical alteration. The distribution of the zircon age population in sediments has therefore become a powerful and popular tool for provenance analysis (Fryer et al. Reference Fryer, Jackson and Longerich1993; Horn et al. Reference Horn, Rudnick and McDonough2000; Kosler et al. Reference Kosler, Tubrett and Sylvester2001) and increasingly applied to solve more diverse geological problems (Gehrels, Reference Gehrels2014).
The southeastern margin of the South China Block (SESCB) is the intersection between the Palaeo-Tethys and Palaeo-Pacific tectonic domains, providing insight into the collision between the South China and Indochina blocks and the subduction of Palaeo-Pacific Ocean below the SCB, and includes exposed intact Upper Triassic – Lower Jurassic strata. In this study, we carried out a comprehensive analysis of detrital zircon U–Pb geochronology, whole-rock geochemistry and sandstone petrography of Upper Triassic – Lower Jurassic clastic sedimentary rocks in the SESCB. We also compared our new detrital zircons U–Pb ages to previously published detrital zircons geochronology data from the Upper Triassic and Lower Jurassic sandstones in the SESCB, in an attempt to reconstruct the sediment dispersal paths of these sediments. Additionally, this contribution also constrains the Late Triassic – Early Jurassic tectonic setting in the SESCB and improves our understanding of the tectonic evolution of the SE Asia continent.
2. Geological setting and lithology
The Neoproterozoic assembly of the Cathaysia and Yangtze blocks formed the composite SCB (Li et al. Reference Li, Li, Li, Liu, Yuan, Wei and Qi2007; Wang et al. Reference Wang, Zhou, Griffin, Wang, Qiu, O’Reilly, Xu, Liu and Zhang2007), which is separated from the North China Block by the Qinling–Dabie orogen (Okay & Sengör, Reference Okay and Sengör1992; Ames et al. Reference Ames, Tilton and Zhou1993; Faure et al. Reference Faure, Lin, Shu, Sun and Schärer1999; Lin et al. Reference Lin, Faure, Sun, Shu and Wang2001). Widespread carbonate deposits developed in the SCB, including most regions of the SESCB, during Pennsylvanian–Cisuralian time (Bureau of Geology and Mineral Resources of Guangdong Province (BGMRGP), 1988). During Lopingian time, the initiation and expansion of a rift system between the South China and Indochina blocks caused S-directed subduction of an eastern branch of the Palaeo-Tethys Ocean below the Indochina Block (Cai & Zhang, Reference Cai and Zhang2009; Faure et al. Reference Faure, Lin, Chu and Lepvrier2016 a, b). The collision between the Indochina and South China blocks during the Early Triassic Epoch then formed the Triassic belts that wrap around the southern margin of the SCB (Faure et al. Reference Faure, Lin, Chu and Lepvrier2016 a, b). During the Late Triassic Epoch, numerous geological structures formed in the SCB as a result of the collisions between the Indochina Block and the SCB and between the SCB and the North China Block (Jiang et al. Reference Jiang, Jin, Liao, Zhou and Zhao2010; Arboit et al. Reference Arboit, Collins, Morley, Jourdan, King, Foden and Amrouch2016). For example, the large-scale N–S-trending thrust faults and E–W-trending folds developed in the SCB, and Upper Triassic – Lower Jurassic clastic rocks directly overlie upper Palaeozoic carbonate rocks as a result of an angular unconformity (Shu et al. Reference Shu, Zhou, Deng, Wang, Jiang, Yu and Zhao2009; Xu et al. Reference Xu, Shu and Yu2009). This Permian–Triassic tectonic event, generally known as the ‘Indosinian Orogeny’ (Huang, Reference Huang1945; Shu et al. Reference Shu, Zhou, Deng, Wang, Jiang, Yu and Zhao2009), played a crucial role in the tectonic evolution of the SCB.
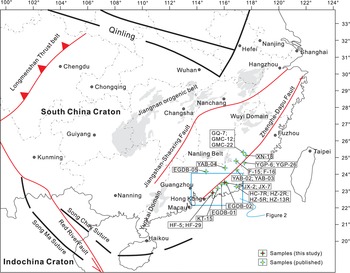
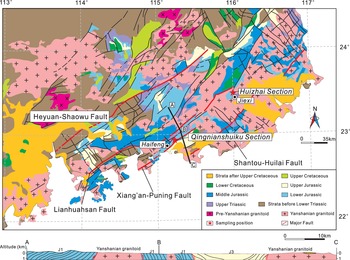
A total of 43 Upper Triassic – Lower Jurassic samples were collected from a continental to marine section (Huizhai section) and a marine section (Shuiku section) of the SESCB, respectively. These two sections are SE of the Wuyishan Domain, to the east of the Yunkai Domain and to the west of the Mesozoic coastal volcanic rocks belt (Fig. 1). The Lianhuashan (extension of the NE-trending Zhenghe–Dapu fault), Heyuan, Xiang’an-Puning and Shantou–Huilai faults run through the SESCB (Fig. 2) (Zuo, Reference Zuo2008). The sampling sites are located in Figure 2.
Sketch geological map of the South China Block and locations of new and published Upper Triassic and Lower Jurassic samples.

Geological sketch map and a simple cross-section of the sampling area (based on geological map of Guangdong province).

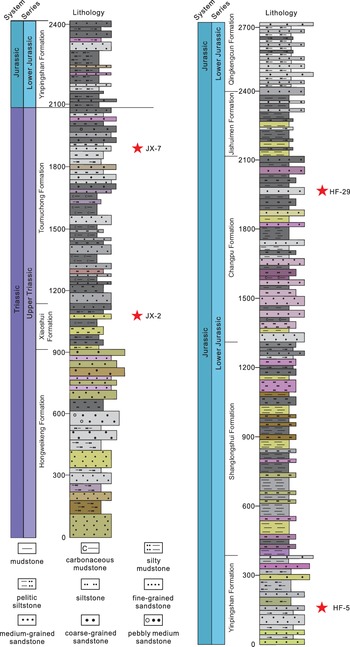
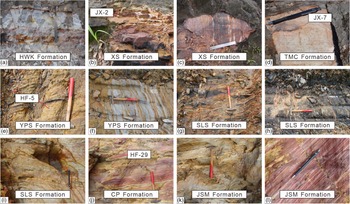
The Upper Triassic Genkou Group is exposed in the Huizhai section and comprises the Hongweikeng, Xiaoshui and Toumuchong formations (Fig. 3). The Hongweikeng Formation in this section has a thickness of c. 900 m and is primarily composed of brown, grey and violet fine-grained sandstone, grey and green medium-grained sandstone, and grey pebbly sandstone with brown, violet and grey argillaceous siltstone and grey silty mudstone (Fig. 4a). Additionally, medium- to fine-grained sandstones are interbedded with argillaceous siltstones, forming a coarsening-upwards sequence. The Xiaoshui Formation in this section is c. 235 m thick and mainly composed of black-grey and green siltstone, and green and grey fine-grained sandstone with black-grey silty mudstone and carbonaceous mudstone (Fig. 4b). Argillaceous siltstone is sandwiched between lenticular fine-grained sandstone in some parts (Fig. 4c). The JX-2 sample was collected from the upper part of the Xiaoshui Formation (Fig. 4b). The Toumuchong Formation in this section has a thickness of c. 950 m and consists of black-grey and grey fine-grained sandstone (Fig. 4d), grey and black-grey medium-grained sandstone, and black-grey pebbly sandstone with grey and black-grey siltstone, black carbonaceous mudstone and grey argillaceous siltstone. Overall, this shows a coarsening-upwards deposition sequence. The JX-7 sample was collected from the upper sandstone layers of the Toumuchong Formation (Fig. 4d). Previous studies suggest that the sedimentary environment of the Genkou Group changes from delta to shallow sea and to littoral, indicating a cycle of transgression and regression during the Late Triassic Epoch (BGMRGP, 1988; Zhou et al. Reference Zhou, Sun, Chen and Qiu2005; Xu et al. Reference Xu, Cheng, Wang, Zhang, Shen and Yu2013 c).
Stratigraphic columns of the Upper Triassic Genkou and Lower Jurassic Lantang groups.

(a–l) Representative field photographs of samples from the Upper Triassic Genkou and Lower Jurassic Lantang groups. HWK – Hongweikeng; XS – Xiaoshui; TMC – Toumuchong; YPS – Yinpingshan; SLS – Shanglongshui; CP – Changpu; JSM – Jishuimen.

Lower Jurassic Lantang Group exposed in the Shuiku section is in conformable contact with the overlying Qingcunkeng Formation and consists of the Yinpingshan, Shanglongshui, Changpu and Jishuimen formations (Fig. 3). The Yinpingshan Formation in this section has a thickness of c. 380 m and is mainly composed of grey, black-grey and green fine-grained sandstone, and black-grey and green medium-grained sandstone with grey and black-grey argillaceous siltstone and grey and black-grey silty mudstone (Fig. 4e). Additionally, the wavy lamination was developed in the fine-grained sandstone layer (Fig. 4f), and the HF-5 sample was collected from the upper fine-grained sandstone layer of the Yinpingshan Formation (Fig. 4e). The Shanglongshui Formation in this section is c. 760 m thick and consists of variable-thickness beds of grey, black-grey and green mudstone, and brown, green, and black-grey siltstone (Fig. 4g); the thickness ratio of mudstone to sandstone is 3:1 or 2:1. Horizontal lamination (Fig. 4h) and trough cross-lamination (Fig. 4i) can be observed in the mudstone and siltstone layers, respectively. The Changpu Formation in this section has a thickness of c. 740 m and is composed of violet, grey and black-grey fine-grained sandstone, and violet and black-grey siltstone with black mudstone. Wavy lamination was developed in sandstone layers (Fig. 4j). The HF-29 sample was collected from the upper part of the Changpu Formation (Fig. 4j). The Jishuimen Formation in this section has a thickness of c. 419 m and consists of green and black-grey mudstone with grey argillaceous siltstone and grey fine-grained stone. Additionally, trough cross-lamination can be observed in the sandstone layer (Fig. 4k) and two sets of mutually perpendicular cracks filled with bitumen are developed in the sandstone layers (Fig. 4l).
3. Methodology
3.a. Sedimentary petrography
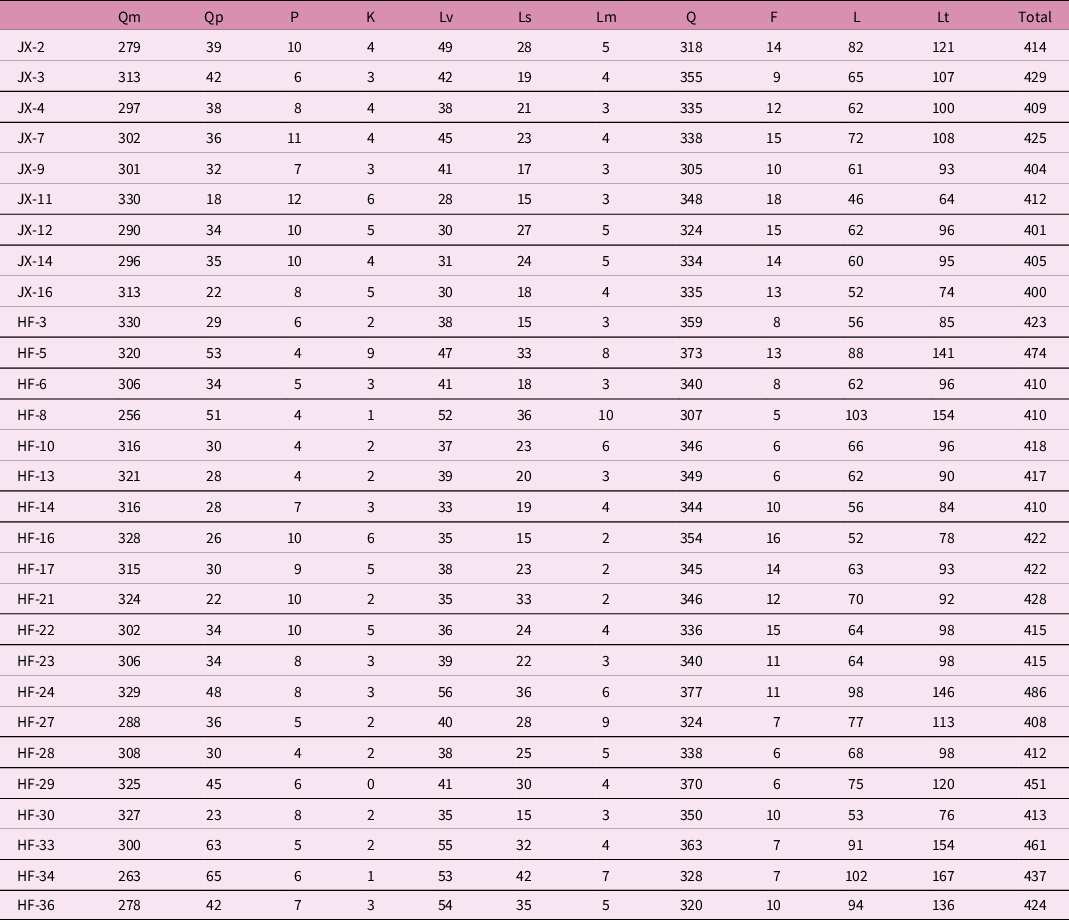
Researchers began to make use of sandstone petrography in studies of sedimentary provenance in the late 1940s and the 1950s (Krynine, Reference Krynine1948; Thomas, Reference Thomas1959). This method was gradually perfected during the following decades, and ternary diagrams of sandstone components (QFL, QmFLt, QpLvLs and QmPK) were finally summarized to distinguish the tectonic setting of sediment source (Dickinson & Suczek, Reference Dickinson and Suczek1979; Dickinson et al. Reference Dickinson, Beard, Brakenridge, Erjavec, Ferguson, Inman, Knepp, Lindberg and Ryberg1983; Dickinson, Reference Dickinson and Zuffa1985). In this study, 28 thin-sections were point-counted to obtain sandstone petrological results using the Gazzi–Dickinson method. The maximum possible grid spacing was chosen to cover the entire slide and allow 500 points to be counted on each slide, matrix and cements were ignored, and individual grains ranging over 0.0625–2.0 mm were only counted once (Ingersoll et al. Reference Ingersoll, Bullard, Ford, Grimm, Pickle and Sares1984). A minimum of 400 points was counted for each thin-section, which can yield statistically reliable values for all parameters (Ingersoll et al. Reference Ingersoll, Bullard, Ford, Grimm, Pickle and Sares1984). It should be noted that all crystals larger than 0.0625 mm are classified as mineral grains, regardless of whether they occur within lithic fragments or as separate grains (Dickinson, Reference Dickinson1970, Reference Dickinson and Zuffa1985; Ingersoll et al. Reference Ingersoll, Bullard, Ford, Grimm, Pickle and Sares1984). The parameters counted here include: total quartzose grains (Qt), comprising monocrystalline quartz (Qm) and polycrystalline quartz (Qp); total feldspar grains (F), consisting of plagioclase grains (P) and potassium feldspar (K); volcanic-hypabyssal lithics (Lv); metamorphic lithics (Lm); and sedimentary lithics (Ls) (Ingersoll et al. Reference Ingersoll, Bullard, Ford, Grimm, Pickle and Sares1984; Dickinson, Reference Dickinson and Zuffa1985). Plutonic lithic fragments grains are counted as their constituent crystals (Ingersoll et al. Reference Ingersoll, Bullard, Ford, Grimm, Pickle and Sares1984), and heavy minerals are ignored due to their different responses to hydrodynamic and geochemical influences (Dickinson, Reference Dickinson and Zuffa1985). Using the Gazzi–Dickinson method, only pure silica can be classified as Qp (e.g. chalcedony), a chert grain with the slightest number of impurities is classified as Ls, and a polycrystalline quartz with a single flake of mica is classified as Lm (Ingersoll et al. Reference Ingersoll, Bullard, Ford, Grimm, Pickle and Sares1984). For further information, please refer to Graham et al. (Reference Graham, Ingersoll and Dickinson1976), Ingersoll et al. (Reference Ingersoll, Bullard, Ford, Grimm, Pickle and Sares1984) and Dickinson (Reference Dickinson and Zuffa1985). Statistical results are presented in Table 1.
Framework modes of Upper Triassic and Lower Jurassic sandstones in the SESCB.

3.b. Major- and trace-element analyses of mudstones
Eleven mudstones were prepared for whole-rock analysis at the Key Laboratory of Mineral Resources Evaluation in Northeast Asia of the Ministry of Natural Resources, Jilin University. Major elements for whole rocks were analysed using an Zsx Primus II wavelength-dispersive X-ray fluorescence spectrometer (XRF) produced by Rigaku, Japan. The X-ray tube is a 4.0 kW end-window Rh target. The voltage and current are 50 kV and 60 mA, respectively. Major-element analysis lines are kα, and the standard curve applies the Chinese national rock standard sample: GBW07101-14. Corrections are calculated by the theoretical α coefficient, and the relative standard deviation (RSD) is less than 2%. Trace elements and rare earth elements (REEs) were analysed using an Agilent 7900 inductively coupled plasma mass spectrometer (ICP-MS) by rock dissolution. Element concentrations were calibrated by concurrently treated standards. Most REEs were detected at a lower limit of 0.01 ppm, while some heavy metal elements were detected at a lower limit of 0.03 ppm. Results are presented in online Supplementary Table S1 (available at http://journals.cambridge.org/geo).
3.c. Detrital zircon U–Pb geochronology
Four samples were crushed, and zircons were separated using standard density separation techniques at Yuneng Co. Ltd., Langfang, China. Selected zircons were imaged by cathodoluminescence (CL) using a Gantan MiniCL imaging system attached to a JSM-IT100 tungsten filament scanning electron microscope at the Wuhan Sample Solution Analytical Technology Co. Ltd. The accelerating voltage and tungsten filament current were c. 10.0-13.0 kV and 80–85 µA, respectively.
Isotope ratios and U–Pb dating were acquired by laser ablation (LA) ICP-MS at the Key Laboratory of Mineral Resources Evaluation in Northeast Asia of the Ministry of Natural Resources, China. Laser sampling was performed using a GeolasPro laser ablation system, consisting of a COMPexPro 102 ArF excimer laser (wavelength of 193 nm and maximum energy of 200 mJ) and a MicroLas optical system. An Agilent 7900 ICP-MS instrument was used to acquire ion-signal intensities. The ICP-MS instrument was tuned using NIST610 standard glass to yield unified Th/U ratios of 0.99 and low oxide production ratios (ThO+/Th+ typically < 0.10%).
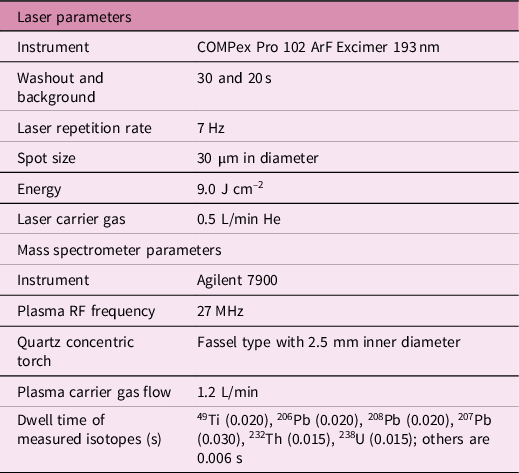
In order to enhance signal sensitivity, the argon and nitrogen were applied as the carrier gas (c. 1.2 L/min) and aux gas (c. 1 L/min) to mix the sample aerosol, respectively. A total of 26 isotopes were acquired using the fluence of c. 9.0 J cm–2 with a total duty cycle of 40 seconds, including 29Si, 49Ti, 89Y, 139La, 140Ce, 141Pr, 143Nd, 147Sm, 151Eu, 155Gd, 159Tb, 163Dy, 165Ho, 166Er, 169Tm, 173Yb, 175Lu, 178Hf, 181Ta, 204Pb, 206Pb, 207Pb, 208Pb, 232Th and 238U. All experiments employed a circular spot of 30 µm in diameter. The specific parameters are listed in Table 2.
Laser and mass spectrometer parameters

Zircon standard 91500 (Wiedenbeck et al. Reference Wiedenbeck, Alle, Corfu, Griffin, Meer, Oberli, Vonquadt, Roddick and Spegel1995) was run as the primary standard every five unknown analyses. The secondary zircon standard employed was zircon Plešovice (206Pb/238U isotope-dilution thermal ionization mass spectrometry age of 337.13 ± 0.37 Ma; Sláma et al. Reference Sláma, Kosler, Condon, Crowley, Gerdes, Hanchar, Horstwood, Morris, Nasdala, Norberg, Schaltegger, Schoene, Tubrett and Whitehouse2008). Across all analytical sessions, Plešovice analyses yielded a mean 206Pb/238U age of 334.1 ± 3.0 Ma (n = 15; MSWD = 0.69). Ages are reported based on 206Pb/238U for ages < 1200 Ma, and on the basis of 207Pb/206Pb for ages > 1200 Ma in the following discussions (Gehrels, Reference Gehrels2014).
Data were collected, corrected and filtered using Glitter v4.4 software (Griffin et al. Reference Griffin, Powell, Pearson, O’Reilly and Sylvester2008). Final age calculations were performed using Isoplot (Ludwig, Reference Ludwig2003). The entire dataset is provided in online Supplementary Table S2 (available at http://journals.cambridge.org/geo). To ensure the comparability between different samples, we plotted kernel density estimator (KDE) with a constant bandwidth of 20 using Density Plotter v8.4 (Vermeesch, Reference Vermeesch2012).
The degree of concordance was expressed as a percentage of the 206Pb/238U age divided by the 207Pb/206Pb age, and discordance was equal to 1 minus concordance (Gehrels, Reference Gehrels, Busby and Azor2012). It should be noted that some zircons were so small that the laser spot may have transversed multiple domains, which can yield discordant dates as a result of the impact of inheritance. We therefore set a discordance filter (10%) to exclude these zircons (Gehrels, Reference Gehrels2014). Zircon fertility can also cause bias in detrital zircon U–Pb dating distribution (Moecher & Samson, Reference Moecher and Samson2006; Dickinson, Reference Dickinson2008; Kong et al. Reference Kong, Xu, Cheng and Wang2021 a), and we needed to minimize its impact on provenance analysis. Dickinson (Reference Dickinson2008) proposed that measured zirconium content can be used as a proxy for the zircon content of granitoid rocks, which can help us to assess the propensity of yielding zircons from granitic rocks. Kong et al. (Reference Kong, Xu, Cheng and Wang2021 a) divided granitic rocks in the SCB into three groups based on zirconium content. Granitic rocks: of age 200–145 and 900–700 Ma and mean zirconium content 139 ppm are assigned a zircon fertility factor of 1.0; of age 280–210 and 490–390 Ma and mean zirconium content 182 ppm are assigned a zircon fertility factor of 1.4; and of age 2000–1700 and 2900–2500 and mean zirconium content 331 ppm are assigned a zircon fertility factor of 2.5. To enhance the reliability of provenance analysis, we applied these zircon fertility factors to correct the proportions of corresponding age groups.
4. Results
4.a. Petrology analysis
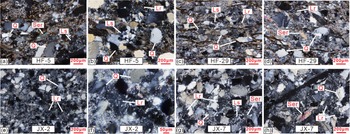
The HF-5 and HF-29 samples (from the lower and upper Lantang Group, respectively) are fine-grained lithic quartz sandstones. Their grains are of size 0.1–0.5 mm and are poorly sorted. Most grains are sub-angular to sub-rounded and are composed dominantly of 68–72% monocrystalline quartz, 10–11% polycrystalline quartz, 17–19% lithic fragments and c. 2% feldspar (Fig. 5a). Lithic fragments are composed dominantly of volcanic (9–10%) and sedimentary (c. 7%) fragments (Fig. 5b, c), with minor metamorphic fragments. The surfaces of most feldspar grains are altered to sericite (Fig. 5a, d).
(a–h) Photomicrographs of samples from the Upper Triassic Genkou and Lower Jurassic Lantang groups.

The JX-2 and JX-7 samples, which are collected from the middle and upper Genkou Group, respectively, are fine-grained lithic quartz sandstones. Their grains, of size ranging over 0.1–0.3 mm, consist of 77–80% quartz (including 67–71% monocrystalline quartz and 9–10% polycrystalline quartz), 17–20% lithic fragments and 3–4% feldspar (Fig. 5e, g). Volcanic fragments are dominant (Fig. 5e, f, h) with contents of 10–12%, and sedimentary fragments rank second (Fig. 5g) with contents of 5–7%. Most feldspar surfaces are altered to sericite (Fig. 5h).
4.b. Whole-rock geochemistry
In terms of major-element compositions (online Supplementary Table S1, available at http://journals.cambridge.org/geo), the Upper Triassic and Lower Jurassic mudstones are largely characterized by intermediate contents of SiO2 (48.66–73.46 wt%), Al2O3 (17.07–32.01 wt%) and K2O (3.32–8.35 wt%). Most samples have low CaO contents (0.04–0.22 wt%) and intermediate ratios of Al2O3/(Na2O + CaO), indicating a dearth of original carbonate minerals. The main minerals of the Upper Triassic and Lower Jurassic mudstones in the SESCB are quartz and feldspar minerals rich in silica and aluminium.
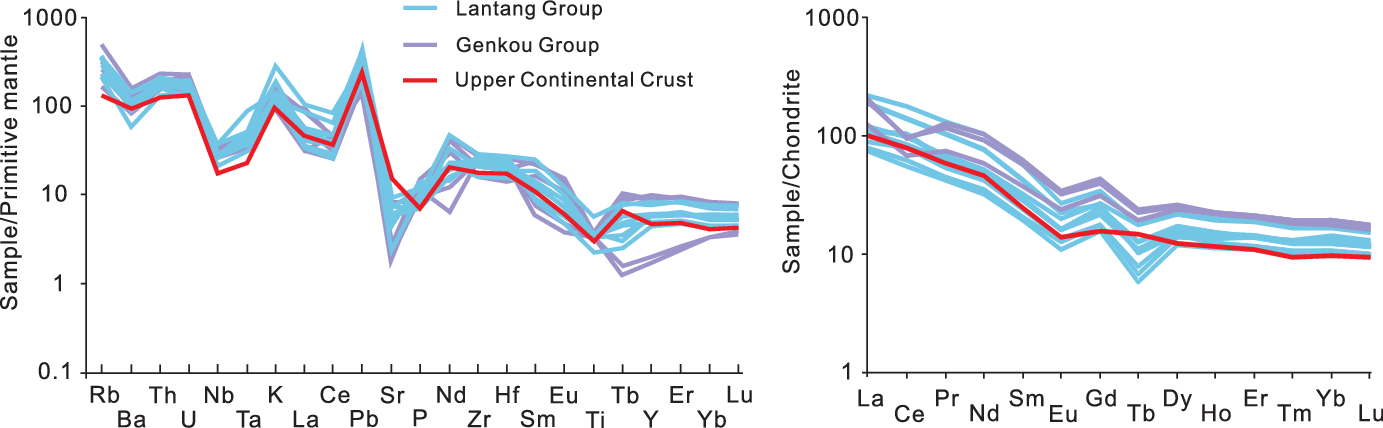
Numerous researchers have proved that the loss of ignition (LOI) and chemical index of alteration (CIA) (CIA = [(A12O3)/(A12O3+CaO*+Na2O+K2O)] × 100; Fedo et al. Reference Fedo, Wayne and Young1995; Young & Nesbitt, Reference Young and Nesbitt1999) is an important indicator for determining the degree of chemical weathering in the source area (Irfan, Reference Irfan1996, Reference Irfan1999; Arel & Tugrul, Reference Arel and Tugrul2001). The mean CIA values for the Genkou and Lantang groups are 81.6 and 80.8 and the mean percentages of LOI are 5.4% and 5.0%, respectively, significantly higher than the index of sixth weathering grade on granodiorite (2.9%; Arel & Tugrul, Reference Arel and Tugrul2001). The primitive-mantle-normalized incompatible trace-element variation diagram suggests that Upper Triassic and Lower Jurassic mudstones have similar patterns to the upper continental crust (Sun & McDonough, Reference Sun, McDonough, Saunders and Norry1989) (Fig. 6). However, Upper Triassic and Lower Jurassic mudstones show unusual depletion in large-ion lithophile element (LILE) Sr and high-field-strength element (HFSE) Tb (Fig. 6). The REE data show a similar chemical imprinting for Upper Triassic and Lower Jurassic mudstones (Fig. 6). All samples have an obvious differentiation between the heavy (HREEs) and light REEs (LREEs) ((La/Yb)N = 5.95–17.65) as well as significant negative Eu anomalies (Eu/Eu* = 0.64–0.76).
Primitive-mantle-normalized spider diagrams and chondrite-normalized rare earth element patterns of samples from the Upper Triassic Genkou and Lower Jurassic Lantang groups. Data for the primitive mantle, chondrite and Upper Continental Crust are from Sun & McDonough (Reference Sun, McDonough, Saunders and Norry1989) and Taylor & McLennan, (Reference Taylor and McLennan1985).

4.c. Zircon U–Pb geochronology
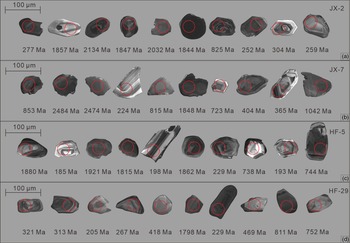
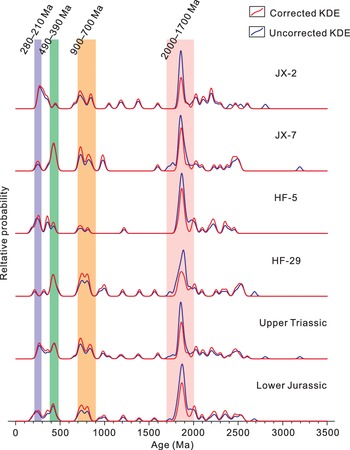
Detrital zircons from samples (JX-2, JX-7) of the Upper Triassic Genkou Group are angular to rounded and have different sizes ranging from 50 to 150 µm in length. The CL images suggest that most zircons are characterized by clear oscillatory zones and sector structures (Fig. 7). A total of 160 individual zircon grains were analysed for their isotopic compositions (80 each from JX-2 and JX-7), of which 124 analyses are concordant. After adjustment of detrital zircon age patterns using zircon fertility factor, there are 89 ages left. The two samples yield similar age distributions, with four main age populations of 2000–1700, 900–700, 490–390 and 280–210 Ma (Fig. 8). The weighted mean age of the youngest cluster of five-grain ages that are within error (i.e. YC2σ age) is 262 ± 4 Ma, indicating that the Genkou Group may have been deposited during the Guadalupian Epoch. This maximum depositional age is significantly older than the depositional age determined by fossils (BGMRGP, 1988). Dickinson & Gehrels (Reference Dickinson and Gehrels2009) have pointed out that the YC2σ (3+) age is the most conservative measure of youngest age, so the result is not surprising. By contrast, although the youngest single detrital zircon grain age might be misleading due to a lack of reproducibility, it is within 5 Ma of depositional age at the 95% confidence level (Dickinson & Gehrels, Reference Dickinson and Gehrels2009). We therefore take the youngest single detrital zircon grain age of 236 ± 3 (1σ) Ma as the maximum depositional age of the Upper Triassic Genkou Group.
Cathodoluminescence (CL) images of representative zircons. The red circles are corresponding sample analysis sites, and the values close to the zircons are the measured ages.

Kernel density estimates (KDE) of concordant detrital zircon ages of samples from the Upper Triassic Genkou and Lower Jurassic Lantang groups in the SESCB.

Detrital zircons from samples (HF-5, HF-29) of the Lower Jurassic Lantang Group have a length range of 50–100 µm, and exhibit evident oscillatory zones and weak zonal structures (Fig. 7). A total of 160 individual zircon grains were analysed for their U–Pb isotopic compositions and 114 analyses are age concordant within 90–110%. Through correction using the zircon fertility factor, the remaining 77 ages yield four prominent age populations: 2000–1700, 900–700, 490–390 and 280–210 Ma (Fig. 8). YC2σ (3 grains) age is 219 ± 6 Ma, and YSG is 183 ± 5 (1σ) Ma. The maximum depositional age of the Lower Jurassic Lantang Group is therefore tentatively set at 183 ± 5 (1σ) Ma.
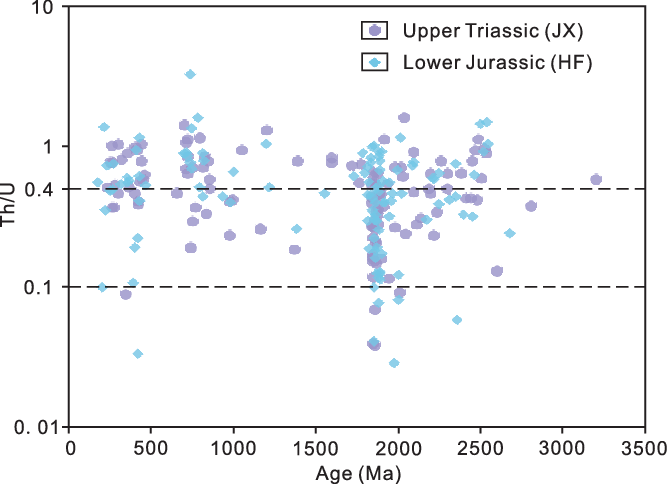
The Th/U ratio of zircon grains has been widely used to distinguish their origin (e.g. metamorphic versus magmatic origin; Rubatto, Reference Rubatto2002; Hoskin & Schaltegger, Reference Hoskin and Schaltegger2003; Kirkland et al. Reference Kirkland, Slagstad and Johnson2018). A lower Th/U ratio (< 0.1) is considered indicative of metamorphic zircon (Rubatto et al. Reference Rubatto2002), whereas a Th/U ratio of > 0.5 indicates magmatic zircon (Hoskin & Schaltegger, Reference Hoskin and Schaltegger2003). Recent studies suggest that this interpretation is too simple. Kirkland et al. (Reference Kirkland, Smithies, Taylor, Evans and Mcdonald2015 b) analysed 10 693 magmatic zircon grains and found that the Th/U ratios range from 0.00 to 19.83. Yakymchuk et al. (Reference Yakymchuk, Kirkland and Clark2019) proposed that the Th/U ratios of metamorphic zircon from Western Australia range from < 0.001 to > 10 and their median value is 0.44. In fact, the Th/U ratio is affected by several factors. For example, the Th/U ratios in zircon grains show a negative correlation with melt temperature under equilibrium conditions, while they are a positive correlation within a fractionating magma (Kirkland et al. Reference Kirkland, Smithies, Taylor, Evans and Mcdonald2015 b). Coeval growth of Th-rich accessory minerals, such as monazite and allanite, can result in a lower Th/U ratio in metamorphic zircon (Schaltegger & Davies, Reference Schaltegger and Davies2017; Rubatto, Reference Rubatto2017). On the other hand, the breakdown of minerals with high Th/U ratios in the crystallization system can lead to higher Th/U ratios in metamorphic zircon (Kirkland et al. Reference Kirkland, Smithies, Taylor, Evans and Mcdonald2015 b). In addition, bulk-rock concentrations of Th and U and open- versus closed-system behaviour are also important controls on the Th/U ratio (Yakymchuk et al. Reference Yakymchuk, Kirkland and Clark2019). Although the Th/U ratio has some disadvantages in separating metamorphic from magmatic zircon, it also can provide some helpful information. With the exception of a few zircon grains from tonalite, quartz monzogranite, granodiorite and granite (that exhibit Th/U ratios of < 0.1), the Th/U values of most magmatic zircon grains are > 0.1. Zircon with Th/U values of < 0.1 is therefore most probably of metamorphic origin, whereas the origin of zircon with Th/U value of > 0.1 needs to be determined by combining other tools, such as zircon inner structure. For example, magmatic zircon usually exhibits evident oscillatory zones and fan-type structure (Vavra et al. Reference Vavra, Gebauer and Schmid1996); metamorphic zircon can exhibit various structures, including fir-tree sector, homogeneous texture, uniform structure, core-rim textures and overgrown rims (Rubatto et al. Reference Rubatto, Gebauer and Fanning1998, Reference Rubatto, Gebauer and Compagnoni1999; Vavra et al. Reference Vavra, Schmid and Gebauer1999; Hermann et al. Reference Hermann, Rubatto and Korsakov2001). There are 12 detrital zircon grains with Th/U values of < 0.1, mainly belonging to age populations 1900–1800 and 490–390 Ma in Upper Triassic and Lower Jurassic samples (Fig. 9), indicating they are of metamorphic origin. The rest of the zircons have Th/U values of > 0.1 and evidently oscillatory zones, with the exception of some detrital zircons with an age of 900–700 Ma that exhibit fir-tree sector and uniform structure (Fig. 7). Although most zircon grains are of magmatic origin, some zircon grains with ages of 1900–1800, 900–700 and 490–390 Ma are of metamorphic origin.
Scatter plot of Th/U ratios versus U–Pb ages of the concordant detrital zircons of samples from the Upper Triassic Genkou and Lower Jurassic Lantang groups.

5. Discussion
5.a. Provenance of Upper Triassic and Lower Jurassic samples
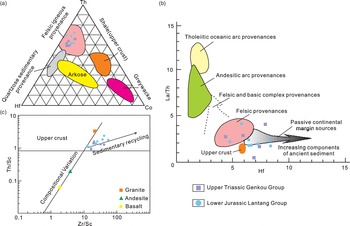
The REE patterns of Upper Triassic and Lower Jurassic mudstones are not significantly different from the pattern of the upper continental crust, indicating that their sources are similar. The high percentages of LOI and CIA values of the Upper Triassic and Lower Jurassic samples indicate an intense weathering history for samples. Serious erosion from weathering can cause the loss of major elements but have little impact on trace elements and REEs, which are relatively stable (Bhatia, Reference Bhatia1985; McLennan et al. Reference McLennan, Hemming, McDaniel and Hanson1993). To ensure reliability, we have only applied immobile element proxy diagrams to determine the characteristics of source rocks. In the Th–Hf–Co diagram, all samples fall in the felsic igneous provenance field except for one sample, which lies in the quartzose sedimentary provenance field (Fig. 10a) (Condie, Reference Condie1989). Additionally, samples have relatively high Th/Sc and Zr/Sc ratios, as for granites (Fig. 10b) (McLennan et al. Reference McLennan, Taylor and Kröner1983). The La/Th versus Hf diagram also shows a consistent result, suggesting that the source rocks of Upper Triassic and Lower Jurassic samples are mainly felsic igneous and sedimentary rocks (Fig. 10c) (Floyd et al. Reference Floyd, Shail, Leveridge, Franke, Morton, Todd and Haughton1991).
(a) Th-Hf-Co ternary diagram (after Condie, Reference Condie1989); (b) Th/Sc versus Zr/Sc diagram (based on McLennan et al. Reference McLennan, Taylor and Kröner1983); (c) La/Th versus Hf diagram (after Floyd et al. Reference Floyd, Shail, Leveridge, Franke, Morton, Todd and Haughton1991).

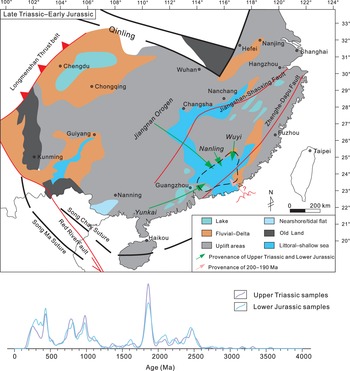
Overall, the trace elements and REEs provide the approximate framework for source tracing, but the specific source area still needs detailed detrital zircon age comparison. In order to enhance the reliability of provenance analysis, we have created a dataset including new and published age data from the Upper Triassic and Lower Jurassic samples of the SESCB. Detrital zircon spectra show that the age distribution patterns of Upper Triassic and Lower Jurassic samples are visually similar, all yielding prominent age populations of 2500–2400, 1900–1800, 1200–1000, 1000–900, 900–700, 480–400, 380–320 and 280–210 Ma. Lower Jurassic samples also contain a minor age population of 200–190 Ma. Given that large-scale facies distribution can serve as the principal guide to directions of potential sources and sediment dispersal (Thomas, Reference Thomas2011), this study combines detrital zircon U–Pb dating with sedimentary facies distribution to identify the possible provenance. Previous studies have found that basins in the SCB comprise continuous Upper Triassic – Lower Jurassic sedimentary records; the SCB consists mostly of uplift areas with occasional basins, including Sichuan intra-continental lake basin, southwestern Guizhou Sea basin, Hunan-Jiangxi-Guangdong littoral-shallow sea and scattered lakes basins (Fig. 11) (Ma et al. Reference Ma, Chen and Wang2009; Shao et al. Reference Shao, Li, Jin, Gao, Zhang, Liang, Li, Chen, Peng and Cheng2014). For example, during the Late Triassic Epoch the depositional environment of the SESCB was mainly delta, whereas neritic deposits developed in central Guangdong. The northern and southern regions on the SESCB underwent uplift and erosion, and provided abundant detritus for the SESCB. During the Early Jurassic Epoch, seawater encroached from the SE–SW, SW and NE, and the depositional area continued to expand in the marine environment. Littoral and neritic facies developed to the north and SW of the SESCB, and even bathyal facies developed in the east Guangdong (Xu et al. Reference Xu, Wang, Lan and Cheng2018 b). The northern and southern regions of the SESCB still belonged to denudation areas. Knowledge of the depositional environment can inform the study of provenance (Fig. 11).
Palaeogeographic schematic of the SCB during Late Triassic and Early Jurassic time, and the potential source areas of the Upper Triassic and Lower Jurassic clastic rocks (after Ma et al. Reference Ma, Chen and Wang2009; Shao et al. Reference Shao, Li, Jin, Gao, Zhang, Liang, Li, Chen, Peng and Cheng2014; Xu et al. Reference Xu, Wang, Lan and Cheng2018 b).

In the SCB, Palaeoproterozoic (2500–2400 Ma) and Mesoproterozoic (1200–1000 Ma) rocks are not or rarely reported, whereas the Palaeozoic strata in the South China and surrounding blocks, such as the Indochina and Sibumasu blocks, contain extensive 2500–2400 and 1200–1000 Ma detrital zircon grains (Xu Y.J. et al. Reference Xu, Que, Shi, Zhou and Ma2013; Hu et al. Reference Hu, Cawood, Du, Xu, Xu and Huang2015 a, b; Dew et al. Reference Dew, Collins, Morley, King, Evans and Glorie2021). Recently, many researchers conclude that 2500–2400 Ma and 1200–1000 Ma detrital zircons in the South China, Indochina and Sibumasu blocks are mainly derived from the Gondwana based on Lu-Hf isotopes, fossils and palaeomagnetic data. For example, Xu et al. (Reference Xu, Cawood, Du, Hu, Yu, Zhu and Li2013 b) found that the Hf isotopic compositions of the 1200–900 Ma detrital zircons in the SCB are similar to the contemporaneous Hf isotopic compositions of zircons from northwestern Australia. Dew et al. (Reference Dew, Morley, Myint and Collins2019, Reference Dew, Collins, Morley, King, Evans and Glorie2021) used U–Pb and Hf signatures from Cambro-Ordovician detrital sequences in the Sibumasu Terrane to demonstrate Proterozoic Gondwanan provenance, which is also seen in the SCB. Additionally, the South China, Tarim, North China, Indochina and Sibumasu blocks all have Gondwanan Sino-Australian province faunas in the lower Palaeozoic strata, indicating these blocks were located on northeastern Gondwana adjacent to Australia (Metcalfe, Reference Metcalfe2011). In central South China, Xian et al. (Reference Xian, Zhang, Li, Xiao, Chang, Yang and Wu2019) reported a new palaeopole (33.6° N, 236.4° E; α 95 = 3°) from the Givetian red beds and upgraded apparent polar wander paths (APWP) between the SCB and Gondwana. The new APWP suggests that the SCB was connected to East Gondwana during 540–400 Ma. The above evidence all shows that the 2500–2400 and 1200–1000 Ma detrital zircons in the SCB might be derived from Gondwana.
The c. 2500–2400 Ma magmatism and orogenesis are widely distributed in eastern Gondwana, for example, in the c. 2550–2450 Ma Halfway Gneiss in the Capricorn Orogen (Sheppard et al. Reference Sheppard, Occhipinti and Tyler2004), c. 2500–2400 Ma magmatic rocks in the North Australian craton (Nordsvan et al. Reference Nordsvan, Collins, Li, Spencer, Pourteau, Withnall, Betts and Volante2018), c. 2538–2473 Ma charnockite and charnockite-hosted leucosome in Salem Block of North India (Clark et al. Reference Clark, Collins, Timms, Kinny, Chetty and Santosh2009) and c. 2500–2400 Ma rocks in Northern Madagascar of the East African Orogen (Tucker et al. Reference Tucker, Morrissey, Payne and Szpunar2018; Archibald et al. Reference Archibald, Collins, Foden, Payne, Holden, Razakamanana, De Waele, Thomas and Pitfield2016). However, the c. 2500–2400 Ma zircons in northern Madagascar have positive ϵ Hf(t) values (0−15) (Archibald et al. Reference Archibald, Collins, Foden, Payne, Holden, Razakamanana, De Waele, Thomas and Pitfield2016), which is significantly different from the range of ϵ Hf(t) values of c. 2500–2400 Ma detrital zircons in the SCB (−15 to +10) (Xu et al. Reference Xu, Cawood, Du, Zhong and Hughes2014). In contrast, 2500−2400 Ma zircon grains from North India and Western Australia show ϵ Hf(t) values of −10 to +10 and −15 to +10, respectively (Veevers et al. Reference Veevers, Saeed, Belousova and Griffin2005; Kirkland et al. Reference Kirkland, Smithies and Spaggiari2015 a; Lan et al. Reference Lan, Pandey, Zhang, Sharma, Gao and Wu2021), compatible with similar ϵ Hf(t) values of 2500–2400 Ma detrital zircons in the SCB. The 2500–2400 Ma detrital zircons in the SCB are therefore mainly sourced from North India and Western Australia.
The c. 1200–1000 Ma zircon grains are commonly found in Silurian–Ordovician sequences (Cawood & Nemchin, Reference Cawood and Nemchin2000; Markwitz et al. Reference Markwitz, Kirkland and Evans2017; Olierook et al. Reference Olierook, Barham, Fitzsimons, Timms, Jiang, Evans and Mcdonald2019). These zircon grains are mainly derived from the Albany–Fraser–Wilkes Orogen (1300–1100 Ma) and northern parts of the Pinjarra Orogen (1100–1000 Ma) in Western Australia (Cawood & Nemchin, Reference Cawood and Nemchin2000; Veevers et al. Reference Veevers, Saeed, Belousova and Griffin2005; Olierook et al. Reference Olierook, Barham, Fitzsimons, Timms, Jiang, Evans and Mcdonald2019). Zircon grains of age 1200–1000 Ma in the SCB may therefore correspond to the Albany–Fraser–Wilkes Orogen and northern parts of the Pinjarra Orogen in Western Australia, or be recycled from the lower Palaeozoic detrital sequences.
Age populations of 1000–900, 480–400 and 280–210 Ma have no specific significance for source tracing. The 1000–900, 480–400 and 280–210 Ma magmatism is widely distributed in the Nanling Belt and Wuyi and Yunkai domains (Sun et al. Reference Sun, Zhou, Chen, Li, Zhou, Wang and Shen2005; Li et al. Reference Li, Li, Li, Liu, Yuan, Wei and Qi2007, Reference Li, Li, Wartho, Clark, Li, Zhang and Bao2010; Chen et al. Reference Chen, Lee, Hsieh, Zeng and Zhou2008; Kong et al. Reference Kong, Xu, Cheng and Wang2021 a). For example, in Yunkai Domain, there are 950–900 Ma Tiantangshan granite and dacite-porphyry (Zhang et al. Reference Zhang, Yuan and Nan1998; Qin et al. Reference Qin, Pan, Li, Li, Zhou, Hu and Zhong2006), 450–400 Ma Guangping and Taishan granites (Wang et al. Reference Wang, Zhang, Fan, Zhao, Zhang, Zhang, Zhang and Li2011; Huang et al. Reference Huang, Yu, Li, Tong and Chen2013 b; Yu et al. Reference Yu, Huang, Sun and He2018) and 270–220 Ma Nali, Jiuzhou and Nameng grainites (Jiao et al. Reference Jiao, Li, Huang and Deng2015; Li et al. Reference Li, Wei, Santosh, Tan, Fu and Zhao2016). The Wuyi Domain contains c. 980–950 Ma Nb-enriched amphibolite and 1000–900 Ma Masha granite (Wang et al. Reference Wang, Zhang, Fan, Zhang and Zhang2013), and 250–220 Ma and 470–400 Ma granitic rocks (Xiang et al. Reference Xiang, Sun, Chen and Wang2013; Zhao et al. Reference Zhao, Jiang, Chen, Chen and Ling2013). There are 990–970 Ma Hezi granite and Jingnan rhyolite (Liu et al. Reference Liu, Liu and Qiu2001; Shu et al. Reference Shu, Yu, Jia, Wang, Shen and Zhang2008), and 460–400 Ma Zhuguangshan and Penggongmiao granites in the Nanling Belt (Xu & Xu, Reference Xu and Xu2015; Zhu et al. Reference Zhu, Li, Xu, Wilde and Chen2016). During Late Triassic – Early Jurassic time, these regions continued to undergo uplift and erosion, and could supply sediment for the SESCB. All these regions are therefore potential source areas of 1000–900, 480–400 and 280–210 Ma detrital zircons. Another prominent age population of 900–700 Ma can be sourced from Neoproterozoic magmatism seen in the Jiangnan orogenic belt and Wuyi Domain (Peng et al. Reference Peng, Jin, Fu, He, Cai and Liu2006; Wan et al. Reference Wan, Liu, Xu, Zhuang, Song, Shi and Du2007; Li et al. Reference Li, Li, Li and Lou2008 a, b). In addition, c. 360–320 Ma magmatism is not reported in the SCB up to now, whereas there are plenty of c. 360–320 Ma zircons in Middle Permian – Middle Triassic strata (Li et al. Reference Li, Li, He, Li, Li, Gao and Wang2012; Hu et al. Reference Hu, Cawood, Du, Yang and Jiao2015 b). This subordinate population in samples may therefore be derived from the pre-Jurassic strata.
Detrital zircons with ages of 1900–1800 Ma account for the largest proportion of all populations in Upper Triassic and Lower Jurassic samples. Most zircons have relatively high Th/U ratio (> 0.4) and exhibit well-preserved oscillatory zoning, denoting magmatic origin; however, several zircons have Th/U < 0.1, as well as uniform and homogeneous textures, indicating metamorphic origin. This population may be sourced from the 1900–1800 Ma igneous and metamorphic rocks in the Wuyi Domain for two reasons (Xiang et al. Reference Xiang, Zhang, Zhou, Zhong, Zeng, Liu and Jin2008; Liu et al. Reference Liu, Zhou, Zhang, Zhong, Zeng, Xiang, Jin, Lu and Li2009; Yu et al. Reference Yu, Wang, O’Reilly, Griffin, Zhang, Li and Shu2009; Xia et al. Reference Xia, Xu and Zhu2012). Firstly, there exist plenty of c. 1900–1800 Ma detrital zircons in upper Palaeozoic and lower Mesozoic strata near the Wuiyi Domain, such as the Middle–Upper Triassic strata of the Hengyang Basin, Upper Triassic strata of the Pingle and Yong’an basins, and Permian strata of Jiangle and Shaoguan basins (Yan et al. Reference Yan, Hu, Lin, Santosh and Chan2011; Hu et al. Reference Hu, Cawood, Du, Yang and Jiao2015 b; Xu et al. Reference Xu, Tang and Lin2016), whereas coeval strata in the southwestern SCB, which is far from the Wuyi Domain (e.g. Penglaitan, Nanpanjiang and Shiwandashan basins), lack this age population (Yang et al. Reference Yang, Cawood, Du, Huang, Huang and Tao2012 a; Zhong et al. Reference Zhong, He and Xu2013; Hu et al. Reference Hu, Cawood, Du, Xu, Xu and Huang2015 a). Second, the palaeocurrent directions in western Zhejiang and western Fujian, near the Wuyi Domain, were 208° and 215° during Late Triassic – Early Jurassic time (Shu et al. Reference Shu, Zhou, Deng, Wang, Jiang, Yu and Zhao2009), also indicating that the Wuyi Domain is the potential source area of 1900–1800 Ma zircon grains in the SESCB.
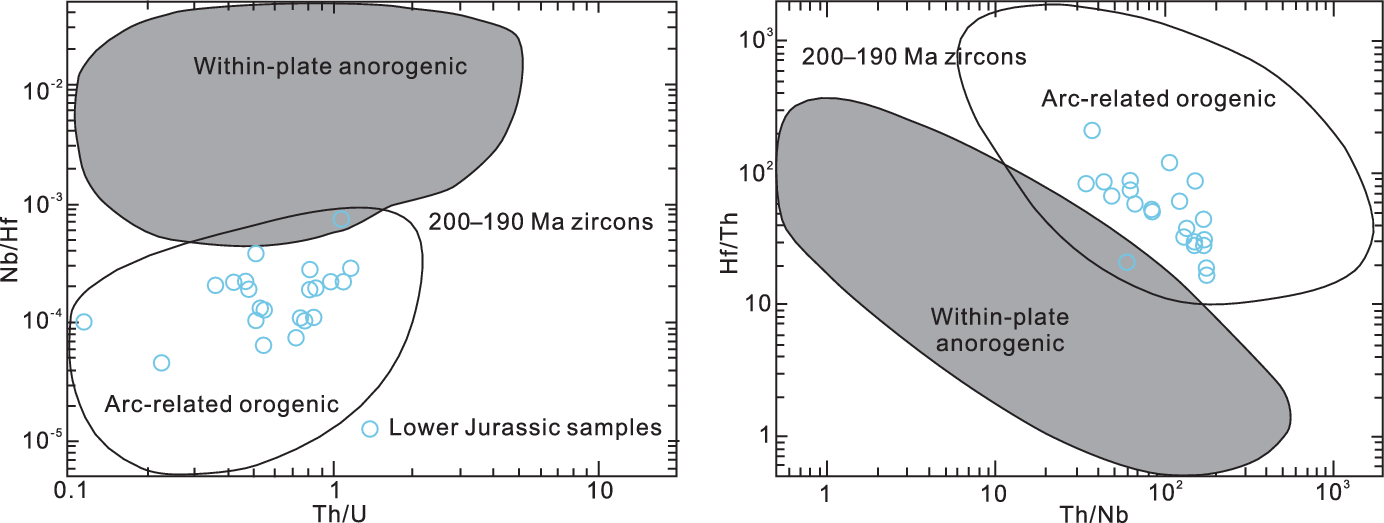
Early Jurassic detrital zircons (200–190 Ma) constitute a major age group in Lower Jurassic sandstones. The oscillatory zoning and high Th/U ratios (> 0.4) indicate that they are of magmatic origin. To determine the source area of these zircons, we conducted an analysis using zircon trace elements. Elements such as Th, U, Hf, Nb and Ta in zircons are available to provide a reference for determining the tectonic setting of host rocks (Yang et al. Reference Yang, Cawood, Du, Huang, Huang and Tao2012 b). Zircons crystallized in an arc-related orogenic environment have significant negative Nb anomalies compared with zircons crystallized in an intra-plate anorogenic environment (Pearce & Peat, Reference Pearce and Peat1995; Pettke et al. Reference Pettke, Audetat and Schaltegger2005). With similar magmatic differentiation, zircons from arc-related orogenic environments therefore have low Nb/Hf ratios and high Th/Nb ratios (Hu et al. Reference Hu, Cawood, Du, Yang and Jiao2015 b). The data describing 200–190 Ma detrital zircons are plotted in Th/U versus Nb/Hf and Th/Nb versus Hf/Th diagrams (Fig. 12), and these zircons lie in the arc-related/orogenic field, indicating that sources are dominated by igneous rocks formed under convergent setting. During Mesozoic time, a continental magmatic arc parallel to the subduction zone of the Palaeo-Pacific developed near the SESCB (Isozaki, Reference Isozaki1997; Isozaki et al. Reference Isozaki, Aoki, Nakama and Yanai2010; Mao et al. Reference Mao, Xing and Ye2013; Zhang et al. Reference Zhang, Wu, Zhu, Zhang, Xing, Chen, Chen and Zhang2018). During the Early Jurassic transgression, seawater encroached on the SESCB from the SE and carried detritus eroded from this magmatic arc, and these sediments were finally deposited in the SESCB. Detrital zircons with ages of 200–190 Ma in the Lower Jurassic samples are therefore likely derived from the continental magmatic arc near the SESCB.
Nb/Hf versus Th/U and Hf/Th versus Th/Nb diagrams of the 200–190 Ma zircons of samples from the Lower Jurassic Lantang Group (after Yang et al. Reference Yang, Cawood, Du, Huang, Huang and Tao2012).

5.b. Implications for Late Triassic – Early Jurassic tectonic setting
Cawood et al. (Reference Cawood, Hawkesworth and Dhuime2012) proposed that detrital zircon spectra can reflect the tectonic setting and that summarized detrital zircon age patterns correspond to convergent, collisional and extensional settings. Recently, several studies have confirmed the usefulness of this theory (Yang & He, Reference Yang and He2013; Hu et al. Reference Hu, Cawood, Du, Xu, Xu and Huang2015 a, b; Xu et al. Reference Xu, Lan, Kong, Cheng and Wang2018 a, Reference Xu, Kong, Cheng, Lan and Wang2020). That means that similar detrital zircon spectra have analogous age distribution patterns, reflecting a consistent tectonic setting. Although detrital zircon spectra of Upper Triassic and Lower Jurassic sandstones in the SESCB are visually similar, sample similarity still needs to be evaluated by quantitative methods.
Five quantitative indexes are commonly used today to describe sample similarity in detrital geochronology, including the Kuiper and Kolmogorov–Smirnov (K-S) statistics, cross-correlation, and similarity and likeness coefficients. However, Saylor & Sundell (Reference Saylor and Sundell2016) assessed these five metrics and reported that the cross-correlation and likeness coefficients are more useful with a small sample size. When the sample size is somewhere between 400 and 600 (Upper Triassic and Lower Jurassic sandstones in SESCB generate 454 and 602 ages, respectively), cross-correlation and likeness coefficients of kernel density estimates (KDE) are > 0.5 and > 0.8 for samples of identical populations, respectively (Saylor & Sundell, Reference Saylor and Sundell2016). The cross-correlation and likeness coefficients of KDE between Upper Triassic and Lower Jurassic sandstones in the SESCB are 0.8608 and 0.8403 (detailed age data are provided in online Supplementary Tables S2 and S3, available at http://journals.cambridge.org/geo), which meets the above criteria. Detrital zircon age patterns of Upper Triassic and Lower Jurassic sandstones in SESCB are therefore highly similar, indicating the tectonic setting does not significantly change from the Late Triassic to the Early Jurassic epochs.
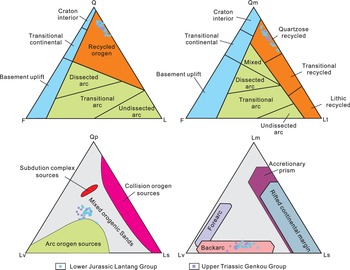
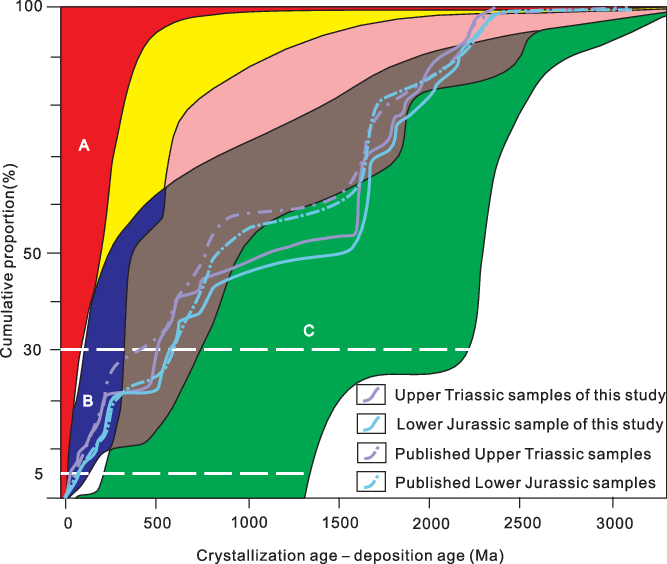
Although the tectonic setting in the SESCB does not change significantly during Late Triassic – Early Jurassic time, it will have a profound impact on the follow-up work if this study can determine the tectonic setting of the SESCB during that period. In the tectonic setting summary plot presented by Cawood et al. (Reference Cawood, Hawkesworth and Dhuime2012) (Fig. 13), detrital zircon records of Upper Triassic and Lower Jurassic samples in the SESCB clearly indicate collisional settings (crystallization age – depositional age < 150 Ma at 5% of the zircon population and > 100 Ma at 30%). Additionally, sandstone compositions of Upper Triassic and Lower Jurassic samples in the SESCB are plotted in triangular QFL, QmFL, QpLvLs and LmLvLs diagrams (Fig. 14). In the QFL and QmFL diagrams, all samples plot in the recycled orogen provenances dominated by the collisional setting. In the QpLvLs diagram, samples plot in the field between arc-orogen sources and collision-orogen sources. In the LmLvLs diagram, all samples plot in the back-arc field. Overall, sandstone petrography indicates that the tectonic evolution of SESCB was dominated by a collisional setting and slightly affected by a convergent setting.
Ternary diagrams of sandstone composition (Dickinson & Suczek, Reference Dickinson and Suczek1979). Qm – monocrystalline quartz; P – plagioclase; K – K-feldspar; Lt – total lithic fragments, including Lv (volcanic fragments), Ls (sedimentary fragments), Lm (metamorphic fragments), Qp (polycrystalline quartz, including chert); Qt – total quartz; L – total lithic fragments except for polycrystalline quartz (Qp).

Cumulative proportion curves versus the difference between the measured crystallization age for a detrital zircon grain and the depositional age of the Upper Triassic – Lower Jurassic succession in the SESCB (modified from Cawood et al. Reference Cawood, Hawkesworth and Dhuime2012): convergent setting (A, red); collisional setting (B, blue); extensional setting (C, green); the transition between convergent and collisional (yellow); the transition between convergent and extensional setting (pink); and the transition between collisional and extensional setting (brown and pink).

Trace elements of the detrital zircons with ages of 200–190 Ma in the Lower Jurassic samples suggest that there existed an arc near the SESCB during the Early Jurassic Epoch, which is consistent with other published research. Mao et al. (Reference Mao, Xing and Ye2013) found a continental magmatic arc parallel to the subduction zone of the Palaeo-Pacific in the SESCB by studying the Jurassic magmatic belt in the SCB. Zhang et al. (Reference Zhang, Wu, Zhu, Zhang, Xing, Chen, Chen and Zhang2018) proposed an ‘Andean-type’ margin arc related to the Palaeo-Pacific subduction, which probably developed in the eastern margin of the SCB from early Early Jurassic time.
Unfortunately, the lack of arc-related igneous rocks in the SESCB cannot provide direct proof for this conclusion. In this study, we assumed that the lack of arc-related igneous rocks might be caused by the following events. Based on the pre-Eocene structure, which corresponds to stacked thrust sheets formed by syn-metamorphic thrusting of oceanic series, Faure et al. (Reference Faure, Marchadier and Ranin1989) proposed that the basement of Mindoro–Romblon–Palawan, known as the West Philippines Block, showed sub-meridian convergence oblique to the SCB, resulting in left-lateral shearing and syn-kinematic magmatism in the SESCB. This tectonic event might have destroyed the Early Jurassic magmatic arc. In addition, the formation of the South China Sea could be another important reason for the disappearance of this arc. Xu et al. (2013) reported zircon U–Pb ages from five Palaeogene volcanic rocks sampled from the northern South China Sea; these authors found that there were numerous pre-Palaeogene grains and that their ages were a good match for the tectonic evolution history of the SCB, indicating that the northern South China Sea was part of the S-wards extension of the SCB. The igneous rocks related to the Early Jurassic magmatic arc may therefore have been buried by Cenozoic sediments of the South China Sea, with the formation of the latter.
During the Late Triassic period of 220–210 Ma, the SE Asian continental fragments, including South China, Simao, Indochina and East Malaya blocks, consolidated with the Sibumasu and South Qiangtang blocks to form a united continent (Arboit et al. Reference Arboit, Collins, Morley, Jourdan, King, Foden and Amrouch2016; Wang et al. Reference Wang, Qian, Cawood, Liu, Feng, Zhao, Zhang, He and Zhang2018; Dew et al. Reference Dew, Collins, Morley, King, Evans and Glorie2021). During 210–200 Ma, the Indosinian Orogeny developed into post-collision stages and the orogenic belt began to collapse (Arboit et al. Reference Arboit, Collins, Morley, Jourdan, King, Foden and Amrouch2016; Wang et al. Reference Wang, Qian, Cawood, Liu, Feng, Zhao, Zhang, He and Zhang2018), indicating the termination of Indosinian Orogeny. During the Early Jurassic Epoch, A-type granite and gabbro–syenite–dacite rocks were widely developed in the SCB (Zhang et al. Reference Zhang, Xu, Jia and Shu2009; Xiang & Wu, Reference Xiang and Wu2012; Wang et al. Reference Wang, Ma, Xin, Marks, Zhang and Zhong2015; Gan et al. Reference Gan, Wang, Qian, Bi and He2017 a, b; Zhou et al. Reference Zhou, Ma, Wang, Chen, Xie, Li and Liu2018), most of them are the product of asthenosphere–lithosphere–crust interactions, recording the primary role of asthenospheric mantle upwelling in magma generation both in the mantle and in the crust (He et al. Reference He, Xu and Niu2010). However, their mechanism of origin is controversial. Some scholars propose that the Lower Jurassic igneous rocks are related to the back-arc extension as a tectonic response to the W-wards subduction of the Palaeo-Pacific plate beneath the SESCB, or related to the slab foundering of the Palaeo-Pacific plate (Li & Li, Reference Li and Li2007; He et al. Reference He, Xu and Niu2010; Huang et al. Reference Huang, Li, Li and Li2013 a; Quelhas et al. Reference Quelhas, Dias, Mata, Davis and Ribeiro2020). Whereas recent studies indicate that the Lower Jurassic igneous rocks in the Nanling region are intruded along the E–W-trending fault systems, mafic dykes are spreading in a W–E direction, indicating that the SCB existed in the form of N–S-trending extensional stress in response to the post-collision stages of the Indosinian Orogeny (Zhao et al. Reference Zhao, Zhao, Yuan and Mao2019). In this study, the Lower Jurassic sandstones also reflect the complexity of the Early Jurassic tectonic evolution of the SCB. Although the zircon grains in the c. 200–190 Ma age group have demonstrated that the Palaeo-Pacific was subducting below the SCB during the Early Jurassic Epoch, the detrital zircon age patterns indicate that the Early Jurassic tectonic setting is similar to that of the Late Triassic (Fig. 14). Ma et al. (Reference Ma, Chen and Wang2009) proposed that the Early Jurassic Epoch probably represented a tectonic pause between the Indosinian and Yanshanian tectonic movements, given the steady development of basins in the SCB during Late Triassic – Early Jurassic time. We therefore believe that the Palaeo-Pacific subduction did not control the tectonic evolution of the SCB until after the Early Jurassic Epoch, although the Palaeo-Pacific subduction started during this time.
6. Conclusions
Based on new zircon U–Pb ages and sedimentary geochemical signatures, in conjunction with previously published detrital zircon U–Pb geochronology of the Upper Triassic and Lower Jurassic sedimentary rocks from the SESCB, we assessed the provenance and investigated the tectonic setting of the SESCB, and obtained the following results.
1. Detrital zircon U–Pb ages of the Upper Triassic and Lower Jurassic sandstones can be divided into four main age groups of 2000–1700, 900–700, 490–390 and 280–210 Ma, as well as three minor age populations of 2500–2400, 1200–1000 and 360–320 Ma, suggesting derivation from the Jiangnan orogenic belt, Nanling Belt, Wuyi and Yunkai domains, and recycling of older strata. The Lower Jurassic samples also contain 200–190 Ma detrital zircon grains, which indicate an arc-related or orogenic origin; these detrital zircons are therefore likely derived from the continental magmatic arc near the SESCB.
2. The cross-correlation and likeness coefficients of KDEs of Upper Triassic and Lower Jurassic sandstones in SESCB are 0.8608 and 0.8403, which suggest that the populations of Upper Triassic and Lower Jurassic sandstones are similar. This indicates that the tectonic setting does not significantly change from the Late Triassic Epoch to the Early Jurassic Epoch. Sandstones petrography and the detrital zircon age patterns show that the South China Block was under the collisional setting during Late Triassic – Early Jurassic time. Although the presence of 200–190 Ma detrital zircon grains in the Lower Jurassic sample indicates that the subduction of the Palaeo-Pacific began to affect the SCB, it was not until after the Early Jurassic Epoch that the Palaeo-Pacific subduction controlled the tectonic evolution of the South China Block.
Supplementary material
To view supplementary material for this article, please visit https://doi.org/10.1017/S0016756821001394
Acknowledgements
This work was supported by the National Natural Science Foundation of China (grant no. 41872101), the Self-determined Foundation of Key Laboratory of Mineral Resources Evaluation in Northeast Asia, the Ministry of Natural and Resources (grant no. DBY-ZZ-18-13) and the National Science Foundation for Young Scientists of China (grant no. 41402087).
Declaration of interest
None.