I. INTRODUCTION
Microdiffraction is offered at a number of synchrotron X-ray fluorescence microscopy (XFM) beamlines around the world (e.g., NSLS: X26-A, X27-A; APS: GSECARS; CLS: Vespers; ALS: 10.3.2) as an ancillary technique to micro X-ray fluorescence (μXRF) imaging (mapping) and micro X-ray absorption fine structure (μXAFS) spectroscopy. Synchrotron μXRD can significantly enhance μXRF and μXAFS measurements by providing direct information on the presence of minerals, their crystallinity, and potential impurities in crystal structures. This information is highly useful to understand the sequestration of metals in mineral deposits, mineral processing residues, soils or sediments, and therefore benefits environmental as well as geological studies. Through the use of synchrotron-generated, microfocused X-rays, mineral properties of key host phases of metals and metalloids of interest can be ascertained, which usually remain undetected when investigated with a conventional laboratory powder diffractometer because of flux and therefore sensitivity limits (~2 wt%).
A particular advantage of synchrotron X-ray microdiffraction (μXRD) is its sensitivity and ability to provide information about long-range order, structural properties of concentrated metals (e.g., through a precipitate or mineral phase) on samples where μXAFS spectroscopy would suffer from self-absorption. As μXAFS analysis is particularly useful to characterize short-range/poorly ordered, amorphous, and/or other non-X-ray-diffracting states, the two techniques become highly complementary in characterizing soil microsites or microreaction systems that control the solubility of potentially harmful metals or the solubility of a mineral of economic value.
An advantage of μXRD over μXAFS is the faster acquisition rate of raw data. On a bend-magnet beamline, utilizing a charge-coupled device (CCD) camera in transmission geometry, 30–60 s are sufficient for thin sections of 50–30 μm thickness, respectively. Beamline 13 ID-e (GSE-CARS, Advanced Photon Source, Argonne National Laboratory) simultaneously images XRF signal and collects μXRD patterns at ~30 ms per pixel resulting in the possibility of generating μXRD-derived mineral maps. Acquisition of μXAFS data in comparison will take anywhere between 15 and 45 min depending on elemental concentration, available beamline detector equipment and the required energy range for experimental purposes. The fast acquisition rate allows experimenters to collect several tens up to thousands of microdiffraction patterns within assigned beamtime (usually ~2–4 days). The classification and interpretation of such a large number of patterns creates statistical opportunities to derive the full suite of crystalline minerals present over the number of points investigated or, as mentioned above, to produce mineral maps.
There are two considerations for the XFM-based μXRD patterns compared with bulk powder XRD. Firstly, the diffraction peaks present are usually representative of a specific orientation of the mineral being investigated and single-crystal effects are often apparent. Highly oriented samples and single-crystal effects can make unambiguous interpretation of the patterns difficult if not impossible. The relative ratio of beam size to mineral particle size usually determines if the observed μXRD pattern is likely to be distorted; i.e., as beamsize decreases the likelihood of recording single-crystal diffraction patterns increases. In studies of soils or soil-like materials (e.g., mineral-processing waste), it is not uncommon to encounter poorly crystalline materials with crystallite sizes below the beam size. In this case, the resulting μXRD patterns will usually yield a suite of diffraction peaks that come close to a powder pattern. Even poorly ordered, 20–50 nm-sized mineral domains can still be identified by their low intensity and broad diffraction patterns. Gräfe et al. (Reference Gräfe, Landers, Tappero, Austin, Gan, Grabsch and Klauber2011), for example, were able to characterize poorly ordered goethite and gibbsite domains in bauxite residue from Western Australia in this manner using a combination of synchrotron μXRD and quantitative evaluation of mineralogy by scanning electron microscopy (QEMSCAN®). The observable orientation effects are often the result of sample preparation (i.e., resin-embedding and thin-sectioning), but may also be augmented by planar particle morphology such as in the case for phyllosilicate and serpentine minerals, talcites, etc. The sample, unless a thin powder layer on X-ray transparent tape such as Kapton or Mylar, is usually not a randomized powder sample as would be prepared for conventional laboratory diffraction experiments and therefore only a limited number of diffraction peaks will be observable. This is further complicated by a lack of movable stages that allow scanning through a range of 2θ, rather, the sample, X-ray source and detector are all fixed in transmission (Laue) geometry at most XFM beamlines. The second issue is the limit of camera geometry and the accuracy of a 2θ determination compared with a conventional powder system.
In this examination of a complex uranium (U) bearing ore, we demonstrate the level of crystal structure information that can be obtained with μXRD on the main, U-bearing host phase, carnotite, and the highly complementary nature of μXRD and μXANES–μXRF spectroscopies.
II. EXPERIMENTAL
The U ore sample originated from the Wiluna area in Western Australia. The ore is classified as a surficial, calcrete-hosted U deposit, with a primary U mineralization of carnotite [K2(UO2)2V2O8·nH2O, n = 0, 1, 2, or 3]. The subsamples were resin-embedded and mounted on a glass slide and then thin-sectioned and polished to a thickness of 30 μm for analysis using laboratory-based electron probe microanalysis, QEMSCAN®, and synchrotron X-ray fluorescence microprobes (XFMs incl. μXRF, μXANES, and μXRD) analyses. This study focuses on the combination of XFM techniques only.
All μXRD experiments were undertaken at the XFM beamline, X27A (NSLS, Brookhaven National Laboratory) in the transmission mode with the sample remaining on the glass slide. The sample faces the incident X-rays and the fluorescence detector. The details of the beamline can be found in Ablett et al. (Reference Ablett, Kao, Reeder, Tang and Lanzirotti2006). The storage ring was operated at 2.8 GeV with a monotonically declining current from 300 mA after fill (every 12 h) of the electron storage ring. The monochromator [channel-cut Si (311) crystal] was calibrated at the Zr K-edge (17.999 keV) using a metallic Zr reference foil. μXANES data were acquired in 0.5 eV steps.
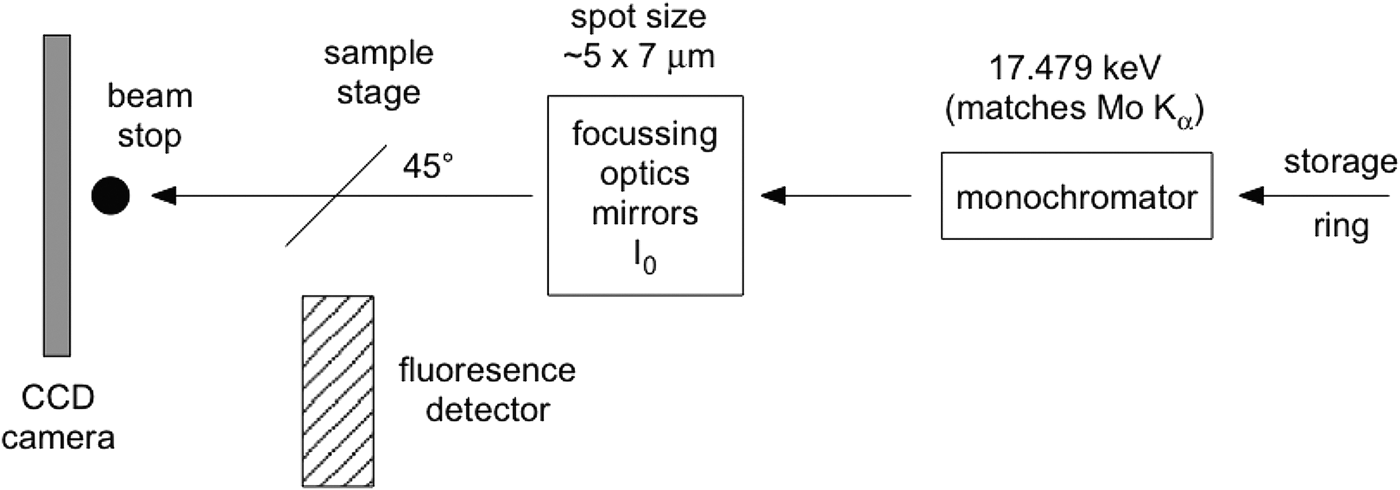
Although the glass slide adds to the challenges of data interpretation, it proves essential if μXRD and μXANES analyses are to be undertaken at exactly the same sample points. Although 50 µm thin sections can be lifted off the glass slide successfully for μXRD and μXANES experiments (Brinza et al., Reference Brinza, Schofield, Hodson, Weller, Ignatyev, Geraki, Quinn and Mosselmans2014), 30 μm thin sections are not self-supporting. The present investigations were part of a micron-scale characterization of the aforementioned U ore requiring thinner sections (to avoid self-absorption in μXANES spectra on carnotite grains). Previous work (Gräfe et al., Reference Gräfe, Landers, Tappero, Austin, Gan, Grabsch and Klauber2011) determined that high-quality μXRD data cannot be obtained from polished sections thinner than 30 μm. Figure 1 shows a schematic of the μXRD–XFM setup.
Simplified schematic of the μXRD arrangement at beamline X27A (NSLS, Brookhaven National Laboratory). The sample faces the incident X-rays and the fluorescence detector at 45o.

The camera used was a 1024 × 1024 pixel Bruker SMART 1500 CCD fibre-optic area detector with the camera plane set at approximately 230 mm from the sample. At that distance a single pixel on the axis subtends 0.024°2θ. A beamstop protected the camera from the direct X-ray beam. The camera–sample distance was calibrated using two standards, one for low 2θ (Ag-behenate, Kodak) and one for high 2θ (Al2O3, NIST 676); beryl-quartz can also be used to simultaneously cover both 2θ ranges. FIT2D (Hammersley, Reference Hammersley1987–2005) was used for the standards' analysis and for axially integrating the two-dimensional (2D) diffraction images to produce patterns of intensity versus 2θ. Such a 2D data reduction can also be undertaken through the program Nika (Ilavsky, Reference Ilavsky2012). A correction equation is fitted to a scatter plot of the observed peaks of the NIST676 Al2O3 standard and their true (reported) positions, in order to correct patterns as a function of 2θ. The origin of this error is unclear: it may occur because of an unwarping error specific to this camera [The Bruker SMART 1500 fibre-optic detector utilizes an X-ray sensitive phosphor screen, roughly the diameter of the front surface of the detector. A fibre-optic bundle is bonded to the rear of this phosphor screen that then tapers to the CCD chip which is significantly smaller than the phosphor, transmitting the visible light to the CCD chip for readout. The fibre-optic taper and the natural differences in orthogonality between chip and phosphor impart a spatial distortion which needs to be corrected for accurate diffraction measurement. This correction is detector specific and measured by collecting the image from a precisely milled brass plate that can be placed in front of the detector and then a spatial distortion array file created that the detector uses to “unwarp” the image. Without this the powder rings would not be circular (personal communication, Anthony Lanzirotti)] or an inaccurate evaluation of the synchrotron beam evaluation. Ignoring this correction, however, may lead to erroneous phase assignments.
An XRF image of part of the U ore sample was collected in the fly-scan mode at 17.479 keV with 100 ms dwell time per pixel and pixel size of 5 × 5 μm (beam size ~5 × 10 μm). “Fly-scan” here denotes the continuous movement of the sample and continuous acquisition of the X-ray fluorescence signal as opposed to a “step-scan” mode where the sample is raster-stepped through the incident X-ray beam and the data are recorded at each step. Fifty-seven locations were examined by μXRD (E = 17.479 keV, λ = 0.7093 Å) and 16 locations were further investigated using μXANES (U LIII edge, 17.166 keV) spectroscopy. The energy chosen for synchrotron μXRD usually lies between 17 and 18 keV in order to collect approximately 2–18 Å of d-space. 17.479 keV compares with the wavelength of X-rays produced by a Mo source on a conventional X-ray diffractometer and therefore offers comparability to published data using this wavelength and at times facilitates phase identification in commercial software products (e.g., Match and CrystalDiffract). The intensity of ULα 1 and VKα counts were used as the primary consideration for selection of points for μXRD and μXANES analyses. Fluorescence from TiKα/Kβ and Rb and SrKα/Kβ was checked as potential interferences in the VKα and ULα 1 signals, respectively. However, these were either not of concern (Ti–V) or not strong enough to significantly alter the true intensity of the fluorescence signal (U–Rb, Sr).
For 30 μm thin sections, camera acquisition times for the μXRD were 60 s per point of interest. A 2D diffraction pattern acquired under typical conditions is shown in Figure 2. Note the large ring from the glass slide and the series of sample-related diffraction spots. In this particular case, a number of crystallites were present in the diffraction volume. The nature of the glass slide's contribution varied between points of interest, so rather than attempting to subtract an “average” background to correct the camera ring images, a short routine was written within Igor Pro™ to emulate a background. The software uses a band pass filter to establish a first approximation of the amorphous quartz component and that is followed by an iterative wavelet transform method (Galloway et al., Reference Galloway, Le Ru and Etchegoin2009) to refine the background's intensity and tilt. A large number of patterns can be efficiently and consistently corrected taking into account the variability of how the background contributes to the raw data. The GUI-based background correction on the actual pattern in IGOR Pro™ (as opposed to the background correction routine on the ring images in FIT2D) permits immediate visual confirmation of a corrected pattern (Figure 3) and significantly lowered the variability of background-subtracted patterns.
(Color online) (a) Typical diffraction pattern from a 60 s acquisition at a point of interest. Note the intense (green) ring from the glass slide because of the sample mount and transmission acquisition arrangement. (b) Comparison of corrected μXRD pattern with simulated anhydrous carnotite.
(Color online) Amorphous background removal from a μXRD pattern via a simple bandpass and iterative wavelet routine in IGOR Pro™. A raw target diffraction pattern (“wave”) is chosen (right-hand panel) from which amorphous background and crystalline component candidates are generated. Then, by three simple panel sliders (right-hand panel) controlling amorphous background intensity, ordered background intensity, and an overall background linear tilt, a background corrected pattern can then be produced. The individual components are followed (lower left-hand panel) simultaneously with the quality of the corrected pattern (upper left-hand panel).
III. RESULTS AND DISCUSSION
The μXRF image of a U- and V-rich cementing phase is shown in Figure 4(a). The yellow-greenish color indicates good spatial correlation between U and V with an apparent enrichment of U and V on the left-hand side of the image [Figures 4(b) and 4(c)]. Figure 5 shows a selection of some of the μXRD patterns. In this study, we refer to S# or X# when addressing μXRD or μXANES data, respectively. Spots 1–14 and 21 revealed that the grains encapsulated by the U- and V-rich phases consisted mainly of quartz (SiO2), goethite (α-FeOOH) and minor traces of kaolinite [Al2Si2O5(OH)4]. In the case of goethite, multiple peaks could be identified making for a confident phase assignment. In certain locations, it was evident that the X-ray beam also interacted with the U- and V-rich parts (e.g., S13) resulting in prominent diffraction peaks that best matched anhydrous carnotite.
(Color online) (a) Red–Green–Blue (RGB) μXRF image of a U- and V-rich cementing phase binding mainly quartz (Qtz), goethite (Gt, see blue, Fe-rich phases) and kaolinite grains together. The μXRF image was collected in the fly-scan mode with a pixel spacing of 5 × 5 μm and a scanning rate of 100 ms per pixel at a fixed energy of 17.479 keV. At locations S1–S57 μXRD patterns were collected. (b) U Lα 1 and (c) V Kα μXRF image showing that the right-hand side of the image contains less U than the left-hand side. At locations S1–S14 and S21, μXRD patterns were taken on areas without apparent U signal to determine mineral composition of cemented grains.
(Color online) μXRD analysis of the selected grains cemented by the U- and V-rich phase(s). Peak analysis showed that the grains encapsulated by the U- and V-rich phase-contained quartz, goethite, and minor amounts of kaolinite. In some case, for example S6 and S13, the U- and V-rich phase can be assigned to the presence of anhydrous carnotite. The patterns of S7 and S8 show multiple peaks corresponding to goethite making this phase assignment highly confident. Quartz can be assigned with equally high confidence.
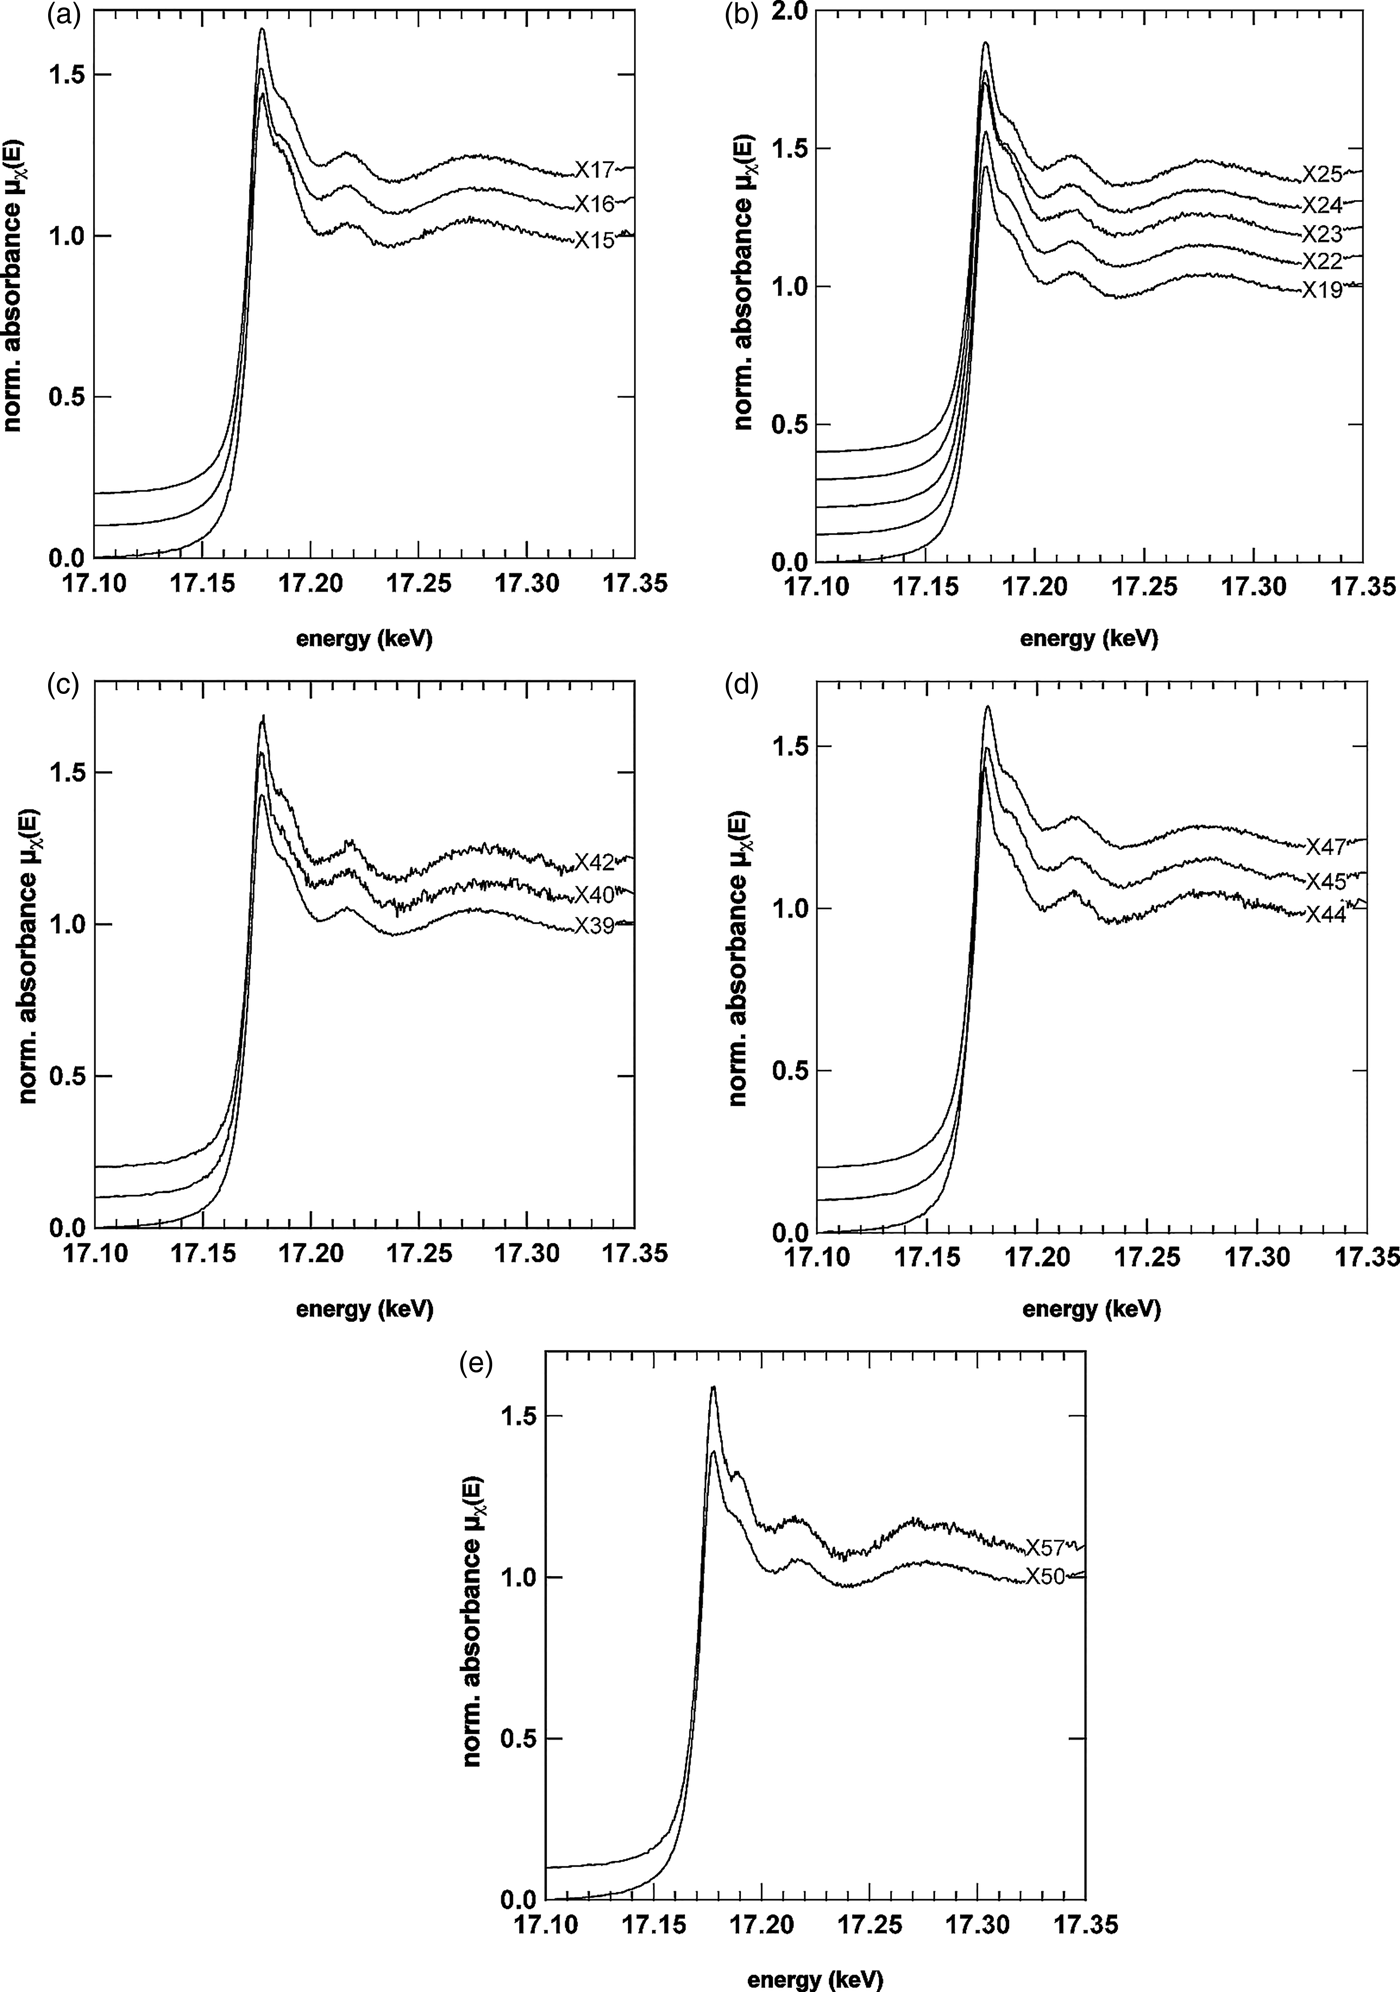
In order to confirm the identities of the U- and V-mineral phase, μXRD and μXANES spectra were both collected at selected locations, some of which are shown in Figures 6 and 7. The U LIIIμXANES spectra are governed by a short core–hole lifetime that broadens the spectra in relation to others (e.g., As K-edge); however, multiple scattering in the linear di-oxo moiety of uranyl (O = U = O, UO22+) can be clearly identified in most spectra by the shoulder on the high-energy side of the whiteline. The whiteline occurred for nearly all spectra near 17.177 keV with a binding energy near 17.171–17.172 keV confirming the presence of U in the 6+ oxidation state (Den Auwer et al., Reference Den Auwer, Simoni, Conradson and Madic2003). Prominent exceptions to the general shape taken by the spectra were observed for spectra X40, X44, and X57. In the case of X40, the multiple scattering feature stemming from the di-oxo uranyl moiety is significantly reduced. One explanation may be orientation of the U bearing phase at this location (Templeton and Templeton, Reference Templeton and Templeton1982). In the case of X44, a shift of the whiteline to lower energy is observed, whereas the spectrum for X57 looks significantly different from all other spectra. There are other minor differences between the spectra, which can be better observed by directly overlapping two or three spectra. For example in the spectrum for X15, the oscillation between 17.210 and 17.220 keV is broader, flatter and less rounded than the same feature in X16 or X25. The oscillation in this energy region and the general shape of the broader oscillation between 17.250 and 17.330 keV represents EXAFS of the photoelectron scattering between the first ligand shell and central U atoms. Differences here suggest that the speciation of uranyl across the U- and V-rich cementing phase is not uniform.
U LIIIμXANES spectra from selected areas across the U- and V-rich phase. μXANES spectra from the right side of the image are shown in (a) and (b), from the centre in (c) and from the U- and V-richer regions in panels (d) and (e). The general shape of the U L III spectra suggest the presence of uranyl (UO22+) by the prominent shoulder feature on the high-energy side of the whiteline, which reflects the linear di-oxo moiety of uranyl (Templeton and Templeton, Reference Templeton and Templeton1982; Den Auwer et al ., Reference Den Auwer, Simoni, Conradson and Madic2003). Prominent exceptions to the general shape taken by most μXANES spectra can be seen in X40, X44, and X57suggesting that uranyl is not the only U species present.
(Color online) μXRD patterns from the same locations of the μXANES spectra shown in Figure 6.
The μXRD patterns (Figure 7) corresponding to μXANES locations show that the predominant U mineral phase is indeed carnotite. The patterns in Figures 7(a)–7(e) show the prominent (100) peak of carnotite-like material (monoclinic, space group P21/a) at ~6.3°2θ suggesting an interlayer spacing of ~6.4 Å because of anhydrous K+ ions. As noted above, the reduced multiple scattering feature for spot S40 [Figure 7(c)] is also reflected in a differing diffraction pattern. Based purely on the d-spacing of the three peaks observed, the U mineral ulrichite [CaCu2+(UO2)(PO4)2.4(H2O)] (Kolitsch and Giester, Reference Kolitsch and Giester2001) is a slightly better μXRD match than carnotite. However, μXRF analysis for this spot does not support the presence of Cu. The peaks (from low to high 2θ) match the (110), (021), (22 ), and (330) peaks of carnotite (P21/a) as well; however, the intensities suggest that the carnotite crystallites are aligned along the b- and c-axes with the X-rays passing along rather than across the interlayer (a-axis). Such an alignment would also explain why the μXANES spectrum for this location (X40) has a weaker, multiple-scattering shoulder feature on the high-energy side of the whiteline as the (O = U = O)2+ uranyl rod would be largely out of phase with the incident X-ray beam (i.e., an orientation effect). In locations S44 and S57, the differences to carnotite are less apparent. S57 shows a strong reflection at 12.184°2θ (3.34 Å) likely because of quartz. A surface complex on quartz or an amorphous precipitate may be responsible for the significant change in shape of the U L IIIμXANES spectrum at X57. At S44 the peak intensity of the (111) reflection (9.5006°2θ, 4.2825 Å) for carnotite is strong, whereas at S45 the neighboring (020) reflection (9.6846°2θ, 4.2013 Å) is more pronounced. The shift of the X44 whiteline to lower energy, however, is not explained by this difference, which would rather be associated either with a reduction in oxidation state and or a change of the ligand environment. The μXRD, however, does reveal the presence of another crystalline mineral phase that could be responsible for either.
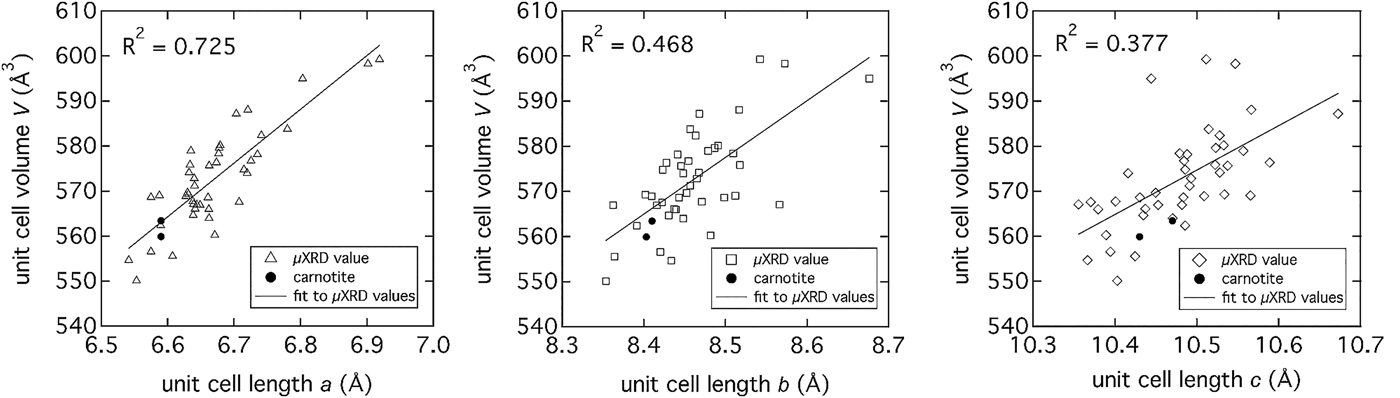
The predominance of carnotite provided the opportunity to more closely investigate the crystal structure across the majority of locations indicated in Figure 4(a). Detailed pattern analysis of the major peak near 6.3°2θ, with the published structure of anhydrous carnotite (Appleman and Evans, Reference Appleman and Evans1965), showed movement of the peak to lower 2θ indicating an expansion of the interlayer. The μXRD patterns were analyzed with Topas (v.4.2, Bruker, 2008) using an input structure file created from crystal structure refinements published by Appleman and Evans (Reference Appleman and Evans1965) and Abraham et al. (Reference Abraham, Dion and Saadi1993) with monoclinic P21/a symmetry. The unit-cell volume (V) was compared as a function of unit-cell lengths a, b, and c (Figure 8), showing a strong linear correlation to an expansion of the interlayer distance, a. The interlayer expansion is likely because of partial hydration of K+ ions (Figure 9) and or other, larger cations sharing the interlayer space such as. Rb or Sr, both of which are present in the carnotite cementing phase (ascertained by μXRF image analysis at 16.000 and 17.479 keV (data not shown). Applying a confidence interval of 95% (P = 0.05) for a population of 42 patterns and unit-cell volumes, eight significantly different unit-cell volumes could be identified ranging from 546.8 to nearly 602.6 Å3 (mean = 572.7 ± 10.9 Å3) for an interlayer spacing (unit-cell length, a) of 6.33–6.53 Å.
Unit-cell parameters (a, b, and c) determined from μXRD patterns collected from locations marked on the image in Figure 4(a). The strongest linear correlation between unit-cell volume and unit-cell lengths exists with the interlayer d-space (unit-cell length, a). The correlation to unit-cell lengths b and c is weaker because of the greater scatter in the data.
(Color online) Carnotite [K2(UO2)2V2O8·nH2O, n = 0, 1, 2, or 3] structure showing the K+ ions (purple) in the interlayer space, the U–O polyhedra (grey) and the V–O polyhedral (red).
IV. CONCLUSION
Synchrotron μXRD is a highly complementary technique to microspectroscopic characterization and offers a number of advantages for crystalline materials, including speed of data acquisition and concentration independence. With simple software and programmable code, the diffraction background because of amorphous quartz slides can be removed efficiently and consistently making μXRD in the transmission mode a practicable and highly informative structural tool. Not having to remove or demount thin sections (which may not be self-supporting) enables easy coincident μXRD and μXAFS data collection with fewer or no positional errors. The challenges associated with this technique, however, remain with more robust phase identification when microdiffraction patterns reflect single-crystal data or strongly oriented specimen (e.g., S44) and highlight the usefulness of a complementary structural probe such as μXANES (e.g., S40).
In the present example of U mineralization, the combination of μXRF imaging, μXANES, and μXRD provided important insights on the general crystallographic properties of the carnotite mineral, as well as fundamental differences in the speciation of uranyl moieties. Natural carnotite, such as natural clays, does not appear to have a unique interlayer composition, but may contain additional elements such as Rb and Sr in addition to K. The absence of Ca in the interlayer suggests that the exchange of K+ cannot be accomplished with any other cation. The interlayer composition and the unit-cell volume (V) expansion, which is linearly correlated to an expansion of the interlayer (unit-cell dimension a) reflect the likelihood of a variable interlayer composition (e.g., Na, Ca, Sr, and Rb) and/or a more, cation-based, hydrated state. The increased hydration state of the carnotite interlayer is significant in the context of industrial U extraction or environmental U solubility as it generally reflects a more soluble state.
ACKNOWLEDGEMENTS
Portions of this work were performed at Beamline X27A, National Synchrotron Light Source (NSLS), Brookhaven National Laboratory (BNL). X27A is supported in part by the U.S. Department of Energy (DOE) – Geosciences (DE-FG02-92ER14244 to The University of Chicago – CARS). Use of the NSLS was supported by the DOE, Office of Science, Office of Basic Energy Sciences, under Contract No. DE-AC02-98CH10886. The authors acknowledge travel funding provided by the International Synchrotron Access Program (ISAP) managed by the Australian Synchrotron and funded by the Australian Government.