

Introduction
From time to time economists and policy-makers recommend dollarisation as a vaccine against foreign debt crises, especially for emerging economies. In addition, dollarisation may have the advantage of delegating the conduct of monetary policy to the US Federal Reserve Board, and therefore it can induce a more stable path for prices in the long run. Nevertheless, and despite the fact that the literature on exchange rate regimes and economic performance is vast, there is no clear consensus on the benefits of dollarisation. Within the Latin American region, Panama, Ecuador and El Salvador are all currently ‘dollarised’, like many other small countries around the world, and dollarisation was seriously suggested as a solution to Argentina's most recent crisis. Through time, arguments have fluctuated in favour of intermediate regimes, super-fixes (and dollarisation) or flexible exchange rates.Footnote 1
When there is theoretical disagreement, empirical evidence plays a particularly important role. But in this topic, as in many others in economics, empirical studies face multiple difficulties, mostly associated with the fact that countries (fortunately) do not choose their regimes in a random fashion. In many instances they do not really choose their regimes at all, but rather find them imposed by economic circumstances; more often than not, de jure and de facto regimes are different; and for some regimes very few observations can be or have been made.
In this paper we provide evidence on the consequences of dollarisation for the dynamics of real exchange rates and inflation. In doing so, we study the experience of a group of countries that share important similarities but have chosen different exchange rate regimes: that is, Central American countries. This region currently has cases of intermediate regimes and cases of very hard pegs, including dollarised countries. In this sense the paper addresses the arguably more realistic question, at least for many emerging economies, of comparing the effects of intermediate regimes and a very hard peg.
Some authors have suggested that a hard peg – indeed, dollarisation – is the best exchange rate regime for Central American countries and the Dominican Republic (we shall refer to those countries from now on as the CAD countries).Footnote 2 According to this view, a fixed exchange rate regime, of which dollarisation is an extreme version, has the benefit of stabilising inflation. The typical associated cost of such a policy is to have a more volatile RER (the relative price of tradable to non-tradable goods and services), and in consequence more volatile output. In this paper we assess the extent to which the empirical evidence supports this view.
In order to investigate the effect of exchange rate regimes on real exchange rate (RER) and price dynamics, we proceed in two steps. Firstly, we estimate equations for the RER in each country. This assumes that the RER is determined by a set of fundamental variables. If the RER moves away from the value predicted by these fundamentals, then the RER is said to be misaligned. This type of misalignment is sub-optimal for any economy, and we ask whether there is any correlation between the exchange rate regime and the length and intensity of these misalignments. Secondly, we estimate open-economy New Keynesian Phillips equations for inflation dynamics following the approach of Clarida, Gali and Gertler.Footnote 3 These equations describe inflation dynamics as a function of past and expected inflation, as well as marginal costs. If the monetary policy is credible, as a consequence of dollarisation, for instance, one should expect that future inflation will be relatively more important in determining the overall inflation dynamics. In that sense, we ask whether, in dollarised economies, the forward-looking component is more important in determining the dynamics of inflation.
To the best of our knowledge this is the first attempt to investigate relative price dynamics in this group of countries. Although there are some previous studies that assess the performance of Panama, the first dollarised economy in the region, they examine the performance of the economy mainly on the basis of the evolution of output.Footnote 4
In the next section of the paper we briefly review the theoretical arguments that support different exchange rate arrangements: fixed, freely floating, and managed exchange rate regimes. We then describe the evolution of exchange rate arrangements in the CAD countries from the 1980s until 2008, before presenting the methodological approach to investigating both inflation and RER dynamics. This section also contains the empirical results.
Exchange Rate Regimes: Which One to Choose?
As noted by Agénor and Montiel, since the collapse of the Bretton Woods system, the process of exchange rate determination in developing countries has been fundamentally different from that of industrial economies. In particular, major industrial countries have followed a policy of managed floating in which the exchange rate is largely determined by market forces, although there have been sporadic central bank interventions. In contrast, the vast majority of countries in the developing world have not abandoned the policy of determining an official exchange rate.Footnote 5
The Mexican tequilazo financial crisis of 1994, the 1997–8 Asian crisis, the 1998 Russian crisis, the Brazilian crisis of 1999 and the collapse of the currency board in Argentina in 2001 have all provided evidence that defending a particular value for a currency can become a costly and risky process. As a result many authors have argued in favour of either letting the market determine the value of the currency or abandoning the national currency altogether (full dollarisation).Footnote 6
Despite the fact that a flexible exchange rate regime is capable, in theory, of coping with different sources of shocks, there are some reasons why countries may be reluctant to tolerate much variation in their exchange rates. Emerging countries are said to suffer from ‘fear of floating’ when the central bank lacks credibility. In these cases, devaluations have a great impact on inflation and hence the lack of credibility induces the central banks to avoid depreciations of the exchange rate. This fear of floating is likely to explain the fact that a vast majority of countries that claim to be free floaters are de facto managed floaters, or have some other kind of intermediate regime.Footnote 7
As noted by Edwards and Magendzo, there is wide agreement among economists that countries which give up their own currency by dollarising and delegating monetary policy to an advanced country's central bank have, on average, significantly lower inflation than countries that pursue an active domestic monetary policy.Footnote 8 This type of regime seems to restore the credibility of the nominal anchor, enabling countries to sustain a lower interest rate that induces higher investment and faster growth.Footnote 9
Fixed exchange rate regimes can induce some problems, however. In particular, in the face of adverse external disturbances such as negative terms of trade shocks or higher international interest rates, the nominal exchange rate cannot accommodate the required changes in relative prices.Footnote 10 As a result, the only way to offset these shocks is through a contractionary fiscal policy.
Under fixed exchange rates, the nominal exchange rate is used to provide a nominal anchor for the economy and relative price adjustments rely on domestic wage-price mechanisms. Compared to fixed exchange rates, intermediate regimes, in principle, facilitate temporary relative price adjustments while preserving some degree of monetary autonomy. Furthermore, relative to completely flexible rates, intermediate regimes can provide a nominal anchor to the economy and can limit the range of fluctuations in the exchange rate. As shown by Krugman, an (explicit or implicit) exchange rate band – one way to characterise perfectly credible intermediate regimes – is stabilising in the face of shocks that affect the exchange rate.Footnote 11 In particular, when the exchange rate is near the top edge of the band (above the central parity), the probability of intervention is higher. In this context, the probability that the exchange rate will depreciate further is smaller than the probability that it will appreciate. Thus market participants will bid the exchange rate down to a level below the one that would have prevailed in the absence of the band. A similar argument can be made in cases in which the exchange rate is approaching the lower end of the band.
One of the main conclusions of Krugman's model is that within the band, the exchange rate will react less to shocks.Footnote 12 The fact that exchange rate bands, or target zones, are inherently stabilising is known as the ‘honeymoon’ effect, and has been documented, as well as tested, by Svensson.Footnote 13 If this is so, compared to the dollarised case, the RER should spend more time close to its (flexible prices) equilibrium level. This is the main hypothesis that we test in this paper. In other words, we test whether, when choosing an intermediate regime, the loss of credibility of the nominal anchor is compensated to some extent with an RER that is closer to its (flexible price) equilibrium value.
This hypothesis might not hold in practice for two reasons. Firstly, the credibility of the nominal anchor that results from dollarisation can substantially reduce inflation persistence. We test this hypothesis separately by estimating expectations-augmented Phillips curves. Secondly, lack of credibility of the intermediate regime in a situation of capital mobility can induce extra volatility of the RER.Footnote 14
Exchange Rate Regimes in CAD Countries: A Comparative Analysis
There are several studies that look at evidence on economic performance under different exchange rate regimes.Footnote 15 But empirical studies on this topic face multiple difficulties, mostly associated with the absence of good controls to perform a credible comparative study. In addition, as noted already, de jure and de facto regimes differ more often than not, and for some regimes there have been very few observations.
This paper offers evidence of the consequences of exchange rate regimes for Central American countries. These countries share some relevant characteristics for the purposes of our study, but have chosen different exchange rate regimes. Their regimes are well identified, but data availability is a significant obstacle for the econometrician. Nevertheless, we have been able to collect annual data for most countries from 1970, and quarterly data from 1992. Annual data are used to estimate RER equations, whereas quarterly data are used to estimate inflation equations.Footnote 16
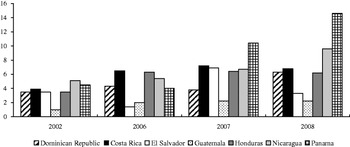
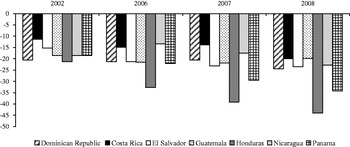
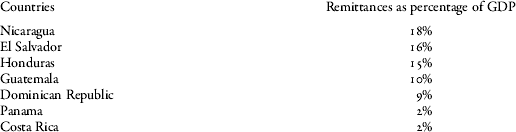
From the point of view of the variables of interest to the present study, the CAD countries share many similarities. These are small, open and middle-income countries (according to World Bank income classification). Their trade structures are highly dependent on the United States, as are their economic cycles. CAD exports are relatively concentrated on manufactures (maquila) as well as some primary goods (foodstuffs), while most commodities are imported, as are machinery and equipment.Footnote 17 Remittances from the United States are very important for these countries – in fact, they represent 10 per cent or more of GDP in most countries, the exceptions being Costa Rica and Panama (see Table 1). Remittances represent an important fraction of foreign currency flows to the CAD countries. In particular, they are above the level of foreign direct investment (FDI) received from abroad (see Figure 1). Therefore, except for Panama and Costa Rica, remittances contribute to financing the deficit on the balance of trade (see Figure 2).
FDI as a Percentage of GDP

Trade Balance as a Percentage of GDP

Remittances to Central America in 2004
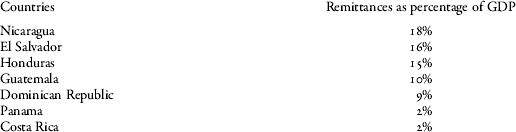
Source: Inter-American Development Bank (IDB).
Note: data are for 2004, except for the Dominican Republic, for which the data are for 2001.
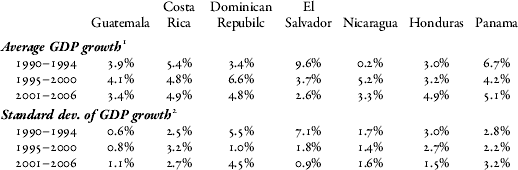
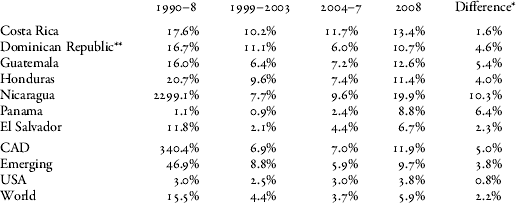
Growth rates for these countries have been positive, but not ‘miraculous’ (see Table 2). In recent years, inflation has been relatively low most of the time, at least compared with the rest of Latin America, and there have been no hyper-inflation experiences (see Table 3).Footnote 18 One striking difference among these countries is GDP volatility; another is RER volatility; and yet another is exchange rate regimes.
GDP Growth and Volatility
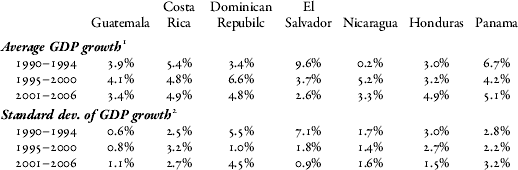
1 Annual basis.
2 Defined as the average deviation of GDP growth from the sample mean. This is defined on an annual basis.
Source: IMF.
Average Inflation across Periods
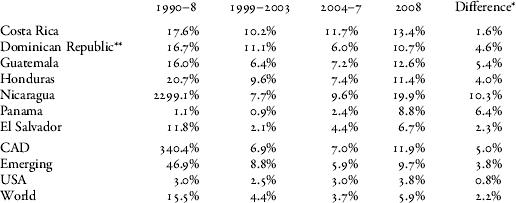
Note: inflation is on an annual basis.
* This is the difference between inflation in 2008 and average inflation in the 2004–7 period.
** The 2004–7 average excludes 2004 in this country.
Source: IMF.
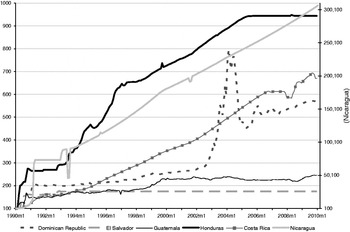
Although macro-economic conditions may be similar across CAD countries, their exchange rate regimes are not. According to the IMF, they range from dollarisation in El Salvador and Panama to the managed floating regimes of the Dominican Republic and Guatemala. Costa Rica and Nicaragua have crawling pegs, while Honduras has a crawling band.Footnote 19 The alternative de facto classification of Reinhart and Rogoff classifies Guatemala as a crawling peg.Footnote 20 In fact, visual inspection of Figure 3 is almost enough to determine the exchange rate regimes of Central American countries in recent years.
Nominal Exchange Rate Index (Local Currency against US Dollar, January 1990=100)

Until the 1980s, exchange rate regimes in CAD countries took the form of dollar pegs. Subsequently, individual countries began to abandon this type of regime. Costa Rica abandoned the peg in 1981, adopting a free-floating regime, followed by an RER rule based on the inflation differential with the United States. This rule was modified in 1997 to take into account targeted rather than actual inflation. The rate of crawl of the colón was adjusted on the basis of the inflation differential between Costa Rica and its main trading partners. From October 2006 the value of the currency was allowed to float inside a band. It is evident from Figure 3 that Costa Rica has had a de facto crawling peg with infrequent adjustments to the rate of crawl.
The Dominican Republic had a very narrow de facto crawling band until 1982; it then moved to a free-floating exchange rate. In 1992 it adopted a managed floating exchange rate regime that lasted until 2003. At that time a severe banking crisis brought the economy back to a freely floating regime. According to IMF classification, the Dominican Republic had a managed floating regime from 1991 to 2003 before moving to an independently floating arrangement in January 2004. Nevertheless, it is evident from Figure 3 that this country, with the exception of the turbulent period between 2003 and 2005, has had a managed float, allowing little variation in the exchange rate.
Guatemala abandoned the peg in 1984; afterwards it oscillated between free and managed floats. In 1991 the system converged to a de facto crawling peg, which remains as the current regime. In the IMF classification, however, Guatemala had a managed float in the 1990s and early 2000s, until it moved to an independent float in 2003. Visual inspection of Figure 3 makes it evident that Guatemala has allowed little variation in the value of its currency vis-à-vis the US dollar, corresponding to a de facto managed float with high degrees of intervention.
Honduras abandoned the peg in 1990 and had a de facto crawling band from 1991 to 1998 before converging to a de facto crawling peg. In the IMF classification, however, Honduras adopted a float from 1992 to 1994. It then moved to a crawling peg and finally to a crawling band in 1996. The rate of crawl is determined by the projected inflation differential with its main trading partners vis-à-vis the US dollar. The band was widened from 1 to 7 per cent in 1998, but movements within the band have been limited and the rate of crawl has been adjusted only twice since 2000. From 2005 the exchange rate to the US dollar was fixed.
Nicaragua spent a long period with a freely floating regime due to hyperinflation. In 1991 the exchange rate was pegged, and since 1993 it has been a crawling peg. The rate of depreciation is now pre-announced by the central bank, and has not been changed since 2001.
El Salvador abandoned the peg to the US dollar in 1983, adopting a managed floating regime until 1990, when it moved to a de facto peg. This country followed a different path from that of its neighbours, however. In the early 1990s, after the cessation of the civil conflict, the exchange rate came under appreciation pressures, which were resisted through the use of sterilised interventions. Finally, El Salvador joined Panama and full dollarisation was adopted in 2001. In summary, our sample is composed of five intermediate regime countries and two dollarised countries.
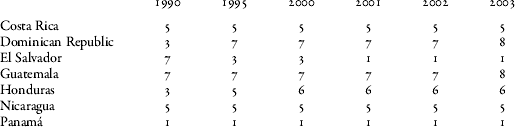
The evolution of exchange rate regimes in the region according to IMF classification can be seen in Table 4. This information is coherent with the evolution of the exchange rate presented in Figure 3. In particular, Costa Rica, Honduras and Nicaragua have had a crawling peg regime during most of the sample period. More recently, from 2003 onwards, Costa Rica has experienced a higher degree of exchange rate volatility, whereas Honduras has fixed its exchange rate. On the other hand, El Salvador has had a fixed exchange rate regime since 1990, whereas Guatemala has a very narrow crawling band. Finally, according to Figure 3, the independent float adopted by the Dominican Republic is still in place. Overall, to determine the type of exchange rate regime in place, it is useful to combine the IMF classification methodology (Table 4) with information about the actual path of the exchange rate (Figure 3).
Exchange Rate Regimes in the CAD Countries
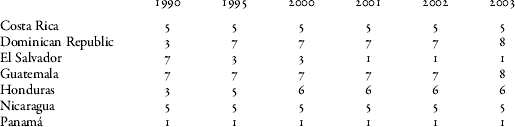
Key: 1: not separate legal tender; 2: currency board; 3: conventional fixed peg; 4: pegged within a horizontal band; 5: crawling peg; 6: crawling band; 7: managed floating; 8: independently floating.
Source: Kim and Papi, ‘Regional Integration’.
RER Dynamics and Inflation Persistence
According to conventional economic theory, the RER, like any other relative price, is determined by a set of fundamental variables. If prices, including the nominal exchange rate, were fully flexible, the RER should, by definition, be the value determined by its fundamental variables. Nevertheless, price rigidities may interfere in the adjustment process and push the RER away from the value implied by its fundamentals, producing what the literature has defined as an RER misalignment.Footnote 21 In this section we estimate the ‘equilibrium’ RER for each of the CAD countries. We then proceed to estimate RER misalignments and to analyse whether these misalignments have been statistically different for different exchange rate regimes. The great advantage of our sample is that it is less subject to mis-specification because the countries are very similar to one another (closer to a natural experiment).
A convenient way of analysing theories that differ from that of purchasing power parity (PPP) is to divide the RER fundamentals into two categories. The first considers those fundamentals that affect the RER through the current account (trade flow), while the second takes into account the fundamentals that impact the RER through the capital account (the net asset position of the economy).Footnote 22
This can be characterised as a stock-flow approach. In this framework, equilibrium RER is defined as a value that is consistent with internal and external balance. Internal balance corresponds to output being at its potential level in conjunction with a non-accelerating rate of inflation. External balance, on the other hand, requires a balance of payments position in which any current account imbalance is financed by a sustainable rate of capital flows.
We consider four variables that affect the trade flow. The first is relative productivity between the traded and non-traded sector, denoted as TNT. This variable has a negative impact on the RER. In particular, with labour mobility and wage equalisation across sectors, an increase in productivity in the traded goods sector raises the real wage in both sectors, leading to an increase in the relative cost and price of non-traded goods. As a result, the RER tends to appreciate.Footnote 23 This is the Balassa–Samuelson hypothesis. The second variable we consider is the terms of trade, TOT. This variable has a negative impact on the RER. In particular, an increase in TOT raises the disposable income and hence increases the demand for both traded and non-traded goods. Since tradable goods prices are given, an increase in TOT tends to increase the relative price of non-traded goods and hence leads to appreciation in the RER. The third variable is the composition of fiscal spending between traded and non-traded goods. The expected impact of this variable on the RER is negative. In particular, an increase in government expenditure is likely to increase the price of domestically produced goods, appreciating the RER. We use as a proxy for this variable the share of government expenditure in GDP, G/Y. The last variable reflecting flow considerations is the level of tariffs. As noted by Edwards, an increase in tariffs may switch demand from traded to non-traded goods, inducing an appreciation in the RER.Footnote 24
The stock variable we consider is the net asset position of the economy as a percentage of GDP, NAP/Y. This variable has a negative impact on the RER. In particular, an increase in NAP/Y implies higher net payments from abroad. This is coherent with a higher sustainable current account deficit, which can be induced with appreciation in the RER.
Taking into account the stock and flow of fundamental variables, an empirical equation for the RER can be expressed as a function of the fundamental variables described above. As explained before, the theoretical impact of these fundamentals on the RER is negative. A log-linear equation relating the RER to its fundamental variables can be written as:

where L indicates variables in logarithm and the estimates of β i are expected to be negative. This approach has been applied to various countries, including China, Costa Rica and Brazil, Chile, South Africa, and a set of developed economies.Footnote 25 As far as we know, this approach has not been applied to most of the CAD countries, and has never been applied systematically to all of them using the same methodology.
Estimation methodology: Dynamic ordinary least squares
Following Calderón and Caputo and Dominichetti, we use dynamic ordinary least squares (DOLS) to estimate (1).Footnote 26 This methodology corrects one of the problems that arise when using the Engel and Granger approach.Footnote 27 In particular, DOLS corrects the reverse causality due to the potential correlation between the disturbances to the RER in (1) and the fundamentals. This problem is addressed by including leads and lags of the first differences of the fundamental variables. In particular, if X t= (1, LTNT t, LTOTt,(G/Y)t, (NAP/Y)t, TARIFFt), the cointegrating vector, β=(β 0, β1, β2, β3, β4, β5), is estimated through the following expression:
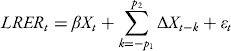
where the above specification is estimated using ordinary least squares (OLS). The p 1 leads and p 2 lags are chosen according to the Schwartz information criterion. In this particular case we consider one lead and one lag. Once the cointegrating vector, β, has been estimated, it is possible to compute the degree of misalignment as the difference between the actual level of RER and the one predicted when using the estimated cointegrating vector,  . In particular, the degree of misalignment can be computed as:

In order to estimate (1), we use annual data from 1970 to 2007.Footnote 28 Available data for 2008 are used to assess the degree of contemporaneous misalignment. We do not consider data on tariffs given the lack of consistent data in this area. Most of the data come from the IMF or regional central banks. Data on the NAP are taken from Lane and Milesi-Ferreti; we update the series until 2008 using data on the current account of each country (see Appendix).Footnote 29 We include Mexico in our estimations as a reference, given the fact that it is an inflation targeter with a free-floating regime.
Misalignment and exchange rate regimes
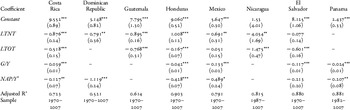
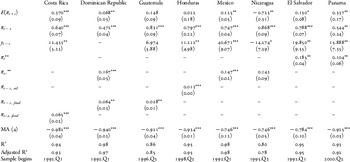
The results from estimating (1) with DOLS are presented in Table 5. We find that the RER's elasticities to its fundamentals have the expected sign and are, in general, statistically significant. For some countries – México, Costa Rica and El Salvador – the model is a relatively good fit. For the rest of the countries, restricted versions of the model in (1), in which one or more of the β i are set to zero, are better representations of RER behaviour.Footnote 30
RER Elasticities to Fundamentals (Equation (1))

Notes: estimation using DOLS. Standard errors in parenthesis (Newey-West).
***
**
* imply statistical significance at 1%, 5% and 10%.
1 NAP constructed with the net external position in Lane and Milesi-Ferretti, ‘The External Wealth of Nations’.
In accordance with our null hypothesis, the dynamics of the equilibrium RER should not be affected by the exchange rate regime. We assume neutrality of the regime in the long run.Footnote 31 The results validate the presumption that CAD countries are similar among themselves, especially Costa Rica, the Dominican Republic, Guatemala and El Salvador. For instance, the effect of our relative productivity measure on the RER is not statistically different for the first three countries, and the effect of terms of trade is not different for Costa Rica, Guatemala and El Salvador. This may reflect the fact that, in some aspects, the structures and institutions of the economies under study are very similar, as noted by Kim and Papi.Footnote 32
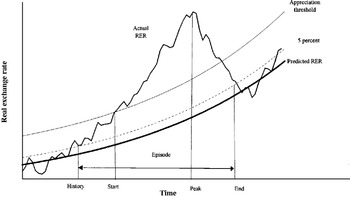
Based on these results, it is possible to compute the contemporaneous RER misalignment. This is the difference between the actual RER level and the one predicted by equation (1) when evaluated using the contemporaneous values of the fundamentals. In particular, the misalignment is defined by equation (2). To see whether misalignments are relevant, one should define a metric. We follow Goldfajn and Valdés and define an episode of appreciation as the time elapsed between the moment at which the RER misalignment first reaches 5 per cent and then continues above a certain threshold, and the moment at which the RER returns to an over-appreciation of 5 per cent or less. Figure 4 shows the way in which an appreciation episode is defined in Goldfajn and Valdés.Footnote 33
Appreciation Episodes: Definition and Phases

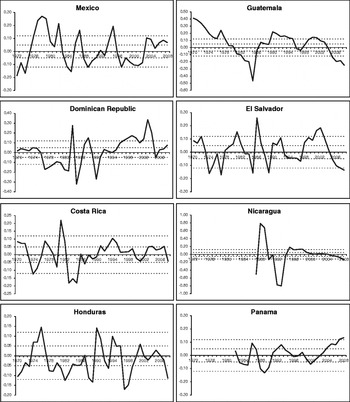
Our threshold level is 12 per cent, and the duration of the appreciation (and depreciation) episode is defined as the time between the history point and the end point in Figure 4. We present the evolution of the RER misalignment for each country, along with the ±5 per cent line and the threshold line of ±12 per cent, in Figure 5. The last point is the misalignment computed with data available up to the first quarter of 2008. In Figure 5, a misalignment above zero is an over-depreciation and below zero an over-appreciation.
RER Misalignments (Percentage Deviation from Equilibrium Level, Dotted Line at ±12% and ±5%)

The results are coherent with causal information about the countries concerned. For example:
1. In Mexico the RER depreciates substantially after the ‘tequila crisis’ of 1994. The RER was undervalued by nearly 20 per cent in 1995, a year after the crisis hit the Mexican economy. After this the RER appreciated until 2003, and since then it has been above the value predicted by the fundamentals.
2. In the case of the Dominican Republic, the RER depreciated substantially after the abandonment of the peg in 1982. Also, in 2003, after a severe currency crisis, the RER depreciated substantially and was above the value predicted by its fundamentals. Guatemala abandoned the peg in 1984 after years in which the RER was overvalued. After 1984 this misalignment has tended to be corrected.
3. In El Salvador the RER experienced a marked depreciation for some years after the abandonment of the peg in 1983. In particular, the RER was nearly 25 per cent undervalued in 1986.
4. Costa Rica abandoned the peg in 1981. That year the RER depreciated substantially, showing an undervaluation of 22 per cent. Since 1988 the RER has been fluctuating around its equilibrium level with a small degree of misalignment.
5. Before 1991 Nicaragua spent a long period with a free-falling regime – in other words, continuous depreciations in a high-inflation environment. Perhaps as a consequence of this, the RER was severely undervalued from 1988 to 1990 (nearly 60 per cent, as shown in Figure 5). In 1991 the exchange rate was pegged. This and the fact that inflation was still high may have contributed to an important appreciation of the RER which lasted until 1994, the year after a crawling peg regime was introduced.
6. In the case of Honduras, after the abandonment of the peg in 1990, the RER experienced a marked depreciation.
7. Panama has experienced a comparatively small degree of RER misalignment since 1982.
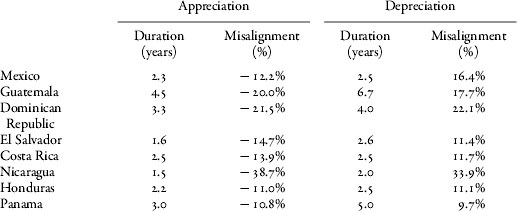
The results are not only coherent with casual observation but also in line with the findings of Goldfajn and Valdés, showing that in most cases large and medium appreciations are reversed in a short time with nominal devaluations.Footnote 34 In Table 6 we present the duration and the average size of misalignment episodes. The duration of a misalignment episode is defined as the distance between the history and end points in Figure 4. Appreciation episodes tend to last between 1.5 years (Nicaragua) and 4.5 years (Guatemala). The average size of appreciations fluctuates between –38.7 per cent (Nicaragua) to –10.8 per cent (Panama). For all countries, depreciation episodes tend to last longer than appreciation episodes. In particular, depreciation episodes last between two years (Nicaragua) and 6.7 years (Guatemala). On the other hand, the average size of misalignment in these cases tends, in general, to be below the size of the appreciation episodes. In the case of the Dominican Republic, the average size of both appreciation and depreciation is (in absolute value) nearly 22 per cent. The duration of misalignments in this country is about four years, which is fairly consistent with the findings of Sánchez-Fung.Footnote 35
RER Misalignments in Different Periods
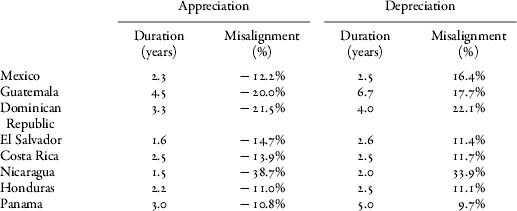
Note: duration and misalignment are the episode average for the period 1970–2008.
Source: authors' calculations.
This evidence suggests that, in general, appreciation episodes tend to be reversed faster than the depreciation episodes. This asymmetry can be explained by the fact that appreciations tend to end abruptly once a certain level of nominal exchange rate can no longer be sustained. On the other hand, the fact that depreciations tend to last longer may be due to the existence of free-falling episodes, continuous depreciations in a high-inflation environment, associated with a non-credible monetary policy. In such cases, if the policy is not credible and prices are sticky, depreciation episodes can last for longer given the fact that lack of credibility does not set an upper bound for the nominal exchange rate; consequently, the RER may deviate persistently from its long-run level.
A first look at the behaviour of the RER in dollarised and non-dollarised countries shows some relevant differences. On average, during the period analysed, CAD countries have spent 19 per cent of the time in over-appreciation periods and 26 per cent of the time in over-depreciated periods. In total, the RER has significantly (and persistently) deviated from its equilibrium level 45 per cent of the time.
Panama, the region's dollarised country par excellence, has been much closer to equilibrium, spending only 22 per cent of the time in misalignment zones. In the case of El Salvador, since dollarisation in 2001, the country spent 78 per cent of the time within the RER misaligned zone with respect to its fundamental level. The RER in El Salvador was over-depreciated from 2000 until 2003 and then over-appreciated from 2007 to the end of the sample (2008). This figure of 78 per cent is considerably more than the overall average, and is also greater than El Salvador's own historical average of 57 per cent. It is also more than the overall average of 39 per cent for all other countries for the same period (2001 to 2008).
Finally, it is also worth comparing the dollarised El Salvador with its more similar neighbours, in other words excluding Mexico, Panama and Nicaragua from the sample. The average for this reduced sample is 49 per cent, and for the 2001–8 period it is 39 per cent, coincidentally the same as for the complete sample of countries. We conclude that, even though Panama has had an RER closer to its equilibrium level than the average CAD country, this is not the case for El Salvador. This supports the idea that some flexibility in the RER allows this variable to be closer to its equilibrium level. In fact, the Costa Rican crawling peg strategy has been particularly successful in maintaining the RER close to its equilibrium level: it has been in a state of misalignment only 27 per cent of the time, 0 per cent if we consider only the 2001–8 period.
With respect to the size of the misalignments, the evidence does not point in the same direction. In fact, the average size of over-appreciations and under-appreciations in El Salvador and Panama has been somewhat lower than the average for the other CAD countries. That means that, for the case of El Salvador, the RER has deviated from the equilibrium RER more persistently, but the size of the misalignment is not necessarily larger.
Inflation persistence
Against the argument that more flexible exchange rate regimes are more appropriate to avoid undesired fluctuation in the RER due to price rigidities, Calvo shows, in the context of a simple model, that the fixed exchange rate, if credible, can in itself reduce the persistence of inflation.Footnote 36 Inflation persistence, in other words, is not exogenous to the exchange rate regime. The reason for this is that when low and stable inflation is credible, economic agents set prices in a more forward-looking fashion.
Even in the extreme case that dollarisation is adopted, the fact that domestic prices are sticky means that the foreign monetary policy is not neutral. As a result, changes in the nominal foreign interest rate will have impacts on the real interest rate, affecting consumption, output and labour, and as a consequence affecting the dynamics of inflation. In particular, the New Keynesian literature has emphasised a relationship between inflation, the degree of price stickiness and marginal costs.Footnote 37 This relationship takes the form of:

where π is the inflation rate, y is a measure of the output gap (which is supposed to be proportional to the marginal costs), and E t is the expectation operator. The coefficient λ is a coefficient depending on the degree of price stickiness. In particular, if prices are stickier – in other words, if they take longer to adjust or are kept fixed for longer – the λ coefficient will be smaller, and vice versa. A direct implication of this is that in an environment where there is a high degree of price stickiness, the output gap (marginal costs) will have to be adjusted by a large proportion to affect inflation. As a result, the stickier prices are, the larger will be the sacrifice ratio, the cost of modifying the inflation rate in terms of output.
An open economy version of (3) also includes some degree of inflation persistence.Footnote 38 This can be expressed as:

where the lagged term in inflation captures the fact that some firms reset prices according to past inflation. As monetary policy becomes more credible, expected inflation will be more important in explaining current inflation (in equation 4, α will be larger and β smaller). If credibility is low, current inflation will be determined mainly by past inflation. On the other hand, foreign inflation affects marginal costs and therefore has an impact on domestic inflation beyond that of the output gap.
We estimate this basic equation for all CAD countries to see the relative importance of each inflation determinant. We do so with quarterly data from 2000 Q1 to 2008 Q1 (see the Appendix for a detailed description of data sources). We have included Mexico in the sample in order to provide an additional reference. The output gap is computed using the Hodrick-Prescott filter; foreign inflation corresponds to the Producer Price Index of the United States and is measured in domestic currency using the average nominal exchange rate for each period. Parameters have been estimated using a two-step OLS procedure. The first step in this procedure is to instrument inflation expectations with the fitted value of the OLS regression of lead inflation to lags of all dependent variables.Footnote 39 Based on (4), we can test the following hypothesis:
i) Dollarised economies exhibit a large response to foreign inflation (a large δ coefficient).
ii) Credibility is higher in dollarised economies (a smaller β and a larger α).
iii) Prices are stickier in dollarised economies (a smaller λ). In fact, more credible policies may lead to less frequent adjustments in prices, as pointed out by Fernández-Villaverde and Rubio-Ramírez.Footnote 40
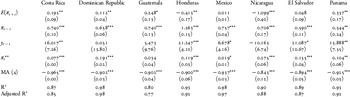
Table 7 shows the main results. With respect to credibility, El Salvador has a comparatively small degree of persistence (β); however, the impact of expected inflation is not different from zero and is smaller than in all other CAD countries except Honduras and Nicaragua. On the contrary, expected inflation is an important element behind inflation dynamics in Panama, the other dollarised country in the region: the forward-looking coefficient is nearly 0.4 and it is not statistically different from the lagged coefficient, 0.5. Of all CAD countries, Panama is the one exhibiting both more forward-looking behaviour and less persistent inflation. Even when compared to a non-CAD country like Mexico, which follows an inflation targeting regime, Panama's inflation dynamics are more driven by inflation expectations.
Estimation of the New Keynesian Phillips Curve (3) (Sample 2000 Q1 to 2008 Q1)

Notes: standard errors in parenthesis.
***/**/* imply statistical significance at 1%, 5% and 10%.
Output gap elasticity in El Salvador, a measure of price rigidity, is statistically similar to that of Honduras, but higher than in all other CAD countries and Mexico. This coefficient is larger in Panama than in El Salvador – this suggests that price adjustments are less frequent in Panama (in other words, prices are stickier there). Also, price stickiness is higher in Panama when compared to the rest of the countries where δ is different from zero (Costa Rica and Honduras); when compared to Mexico, however, it seems that prices are adjusted more frequently in Panama.
The inflation response to foreign inflation is not statistically different in Panama and El Salvador than in the rest of the CAD countries, even though it is high in both Panama and El Salvador when compared to Mexico. No relevant differences emerge from this point of view.
The fact that Panama features more forward-looking and less persistent inflation, together with less sticky prices, suggests that this economy enjoys a comparatively high degree of credibility. This is perhaps not surprising, given the fact that Panama's monetary policy has been delegated to the US Federal Reserve for over a century. Inflation dynamics in El Salvador, on the other hand, are not very different from the remainder of the CAD countries. This may be due to the fact that the monetary regime is relatively recent and expectations are not fully anchored.
Some additional elements that may impact inflation dynamics are related to foreign supply shocks: the price of oil and the price of food. These elements were at the centre of the rise in global inflation in 2007–8. To quantify the relative importance of these additional elements, we re-estimate (3) but now introduce those elements. In addition, we incorporate data from before 2000 to see the extent to which individual countries may have behaved differently in the past. The results of this estimation are presented in Table 8.
Estimation of the New Keynesian Phillips Curve with Supply Shocks (4)

Notes: standard errors in parenthesis.
*** /
** /
* imply statistical significance at 1%, 5% and 10%. In Guatemala the output gap is four lagged periods.
Once supply shock elements are introduced and the sample is extended (the exception is Panama, for which we do not have additional data), the main results presented in Table 7 do not change substantially. In particular, inflation in Costa Rica reacts mainly to lagged inflation and to the output gap. Expected inflation is of less importance, although its impact is different from zero. Once the price of food is introduced into the estimations, US producer price inflation is no longer relevant in explaining Costa Rica's inflation. The same is true for Guatemala. In the case of the Dominican Republic, the only difference with the previous specification is that both foreign and food inflation are relevant in the Phillips curve. In the case of Honduras, the only difference is that the relevant foreign price is oil. In the case of Nicaragua there are no substantial changes with the expanded sample: inflation is mainly determined by its lagged value.
For Mexico, there are two important changes. Firstly, inflation elasticity to output increases substantially. This may be due to the fact that the extended sample considers a high-inflation period that may have induced more frequent price adjustments, thus increasing λ. Secondly, the impact of foreign (US) inflation is also higher than in recent years. This may be due to the fact that, although the United States is still Mexico's main trading partner, China and other countries have stronger trading links now than in the past.
In the case of El Salvador, the results are virtually unchanged. This suggests that inflation dynamics, in terms of their determinants, have not been modified (so far) by adopting the dollar as the official currency.
Finally, the more stable countries in the region, Panama and Costa Rica, present very similar results in terms of inflation dynamics (Tables 7 and 8). In particular, the forward-looking component of inflation is statistically different from zero and has a similar size in both countries. The same can be said with respect to the response of inflation to its lagged value and to the output gap. Perhaps this is an indication of more credible monetary policy in those countries, which is not necessarily related to any specific exchange rate regime.
Conclusions
This paper makes an empirical contribution to the discussion on the optimal exchange rate regime. It provides a cross-country comparison among similar countries that have implemented alternative policy regimes. We compare the dynamics of the RER and inflation persistence in dollarised countries and countries with some exchange rate flexibility in Central America and the Dominican Republic. One of the contributions of the paper is the dataset: we have assembled the relevant data for seven countries, including Mexico, since 1970.
To the best of our knowledge this is the first paper to provide systematic estimates for RER and inflation equations for this group of countries. The results are satisfactory in two senses. Firstly, we find that theoretically fundamental variables correlate with the RER and inflation with the correct sign and reasonable magnitudes. Secondly, we are able to explain a large part of the variance with equations that are relatively standard in the economic literature.
The main results are as follows. Firstly, our equations do a good job in explaining long-run RER dynamics. We find evidence that in El Salvador, since dollarisation, the RER has spent more time away from its estimated equilibrium level than in other countries of the region that have more exchange rate flexibility. Nevertheless, the opposite is true for Panama and for Costa Rica, which has an independent monetary policy.
Secondly, we find that inflation is quite inertial in almost all countries, including those that have dollarised. Expected inflation, on the contrary, is relevant for inflation dynamics only in the case of Panama and Costa Rica. Taken together, the previous results suggest that in most countries there is a low degree of credibility in a price stability policy, either because monetary policy is not explicitly set to tackle inflation or because the central bank lacks credibility.
An alternative interpretation of our results regarding El Salvador is that the eventual benefits of dollarisation do not arise immediately. In particular, while Panama has been a dollarised economy for more than a hundred years, El Salvador has only adopted this regime recently.
Overall we can conclude that, besides the specific exchange rate regime adopted, there are other elements that may play an important role in determining the economic performance of any given country – institutional development, for example.
Appendix
Data Methodology and Sources
Inflation: CPI inflation (International Financial Statistics, IMF CD, August 2008), core inflation based on Central Bank and National Statistical Offices in each country.
International oil price: West Texas Intermediate (WTI) oil price, IMF.
Real exchange rate (RER): constructed as the ratio between the nominal exchange rate times the US index for consumer price inflation (CPI) and producer price inflation in each country (International Financial Statistics, IMF CD, August 2008). When producer price inflation is not available, we use wholesale price inflation or CPI inflation.
Government expenditure (G/Y): constructed as a percentage of GDP. Source: World Development Indicators, World Bank.
Terms of trade (TOT): the ratio between the export price index (Px) and import price index (Pm). Source: World Development Indicators, World Bank.
Relative productivity between tradable and non-tradable sectors (TNT): as a proxy for this variable we use the ratio between per capita GDP in each country and per capita GDP in the United States. Source: World Development Indicators, World Bank.
Net foreign asset position (NAP/Y): the ratio between the net foreign asset position in each economy (in US$) and GDP (also in US$). Source: Lane and Milesi-Ferretti, ‘The External Wealth of Nations’.