


Introduction
Aerial insectivorous birds breeding in North America are in decline (Sauer et al. Reference Sauer, Pardieck, Ziolkowski, Smith, Hudson and Rodriguez2017; Rosenberg et al. Reference Rosenberg, Dokter, Blancher, Sauer, Smith and Smith2019). Multiple studies have indicated that the cause of this decline is likely complex, with multiple factors working against these birds. Some factors include habitat changes associated with climate change and agricultural intensification, declines in insect abundance and changes in their phenology, and changing land use patterns on migratory routes and wintering grounds (Bohning-Gaese et al. Reference Böhning-Gaese, Taper and Brown1993; Garrett et al. Reference Garrett, Pelletier, Garant and Bélisle2022; Imlay and Leonard Reference Imlay and Leonard2019; Spiller and Dettmers Reference Spiller and Dettmers2019). This multi-dimensional decline can make conservation measures challenging as it is rare that a single initiative can address even one of these factors at any meaningful spatial scale.
The Purple Martin Progne subis is an example of a colonial obligate insectivore which is declining in some parts of its breeding range (Tautin et al. Reference Tautin, Cousens, Kostka, Kotska, Airola, Rich, Arizmendi, Demarest and Thompson2008). In common with other aerial insectivores, this decline likely has its roots in challenges both on the breeding and wintering grounds. What stands out about the eastern subspecies of the Purple Martin Progne subis subis, however, is the exclusive use of human-made colonial nest boxes for breeding (Brown and Tarof Reference Brown, Tarof and Rodewald2013). While this could be equally considered an opportunity or a vulnerability for this species (Jervis et al. Reference Jervis, Spicer, Foster, Kelly and Bridge2019), it does provide researchers with a novel insight into factors determining breeding success in this species. Human-made housing can help to standardise some of the usual factors confounding such studies in natural environments (Ghosh et al. Reference Ghosh, Banerjee, Mukhopadhyay, Bhattacharya and Ray2022), and can be more reliably and systematically studied to provide high-quality data on fecundity over time.
Conservationists working with a “nest box species” like the Purple Martin have the chance to either manipulate the habitat around existing colonies, or to select the location of the nest boxes themselves to optimise conditions for breeding success. They can promote best practices for the design and monitoring of nest boxes and for additional support for nesting birds (Kelly and Hvenegaard Reference Kelly and Hvenegaard2022; Raleigh et al. Reference Raleigh, Ray, Grisham, Siegrist and Greene2019. Additionally, they can (at least in terms of preventing colonies becoming too large) control colony size to balance the likely benefits of colonial living with its costs (Davis and Brown Reference Davis and Brown1999). The Purple Martin is, however, still a wild species, vulnerable to the stochasticity of both local weather conditions and a changing climate. This implies limits to our capacity to alter its breeding success, even at a very local scale.
In this paper we ask to what extent is breeding success a predictable quantity in the Purple Martin, how much of the variation in success can be potentially controlled by well-informed conservation policy, and how much is truly beyond control. A more comprehensive understanding of nest productivity is an important step in diagnosing the cause of migrant decline. It can be used to predict circumstances in which the breeding stage of the annual cycle is a likely limit on population size, versus circumstances in which the decline is more likely caused by factors encountered on migration, or in the wintering range. To address these questions, we worked with ten years of data documenting breeding output and colony size in six Purple Martin colonies in Western New York. We purposefully took a relatively narrow geographic perspective in this case to remove large scale landcover and climatic changes from our dataset, and focus on local and regional scale factors, which are more likely to be controllable in conservation measures. The other benefit of this dataset is that it is relatively long-term data that has been amassed by a single group of volunteers who have recorded data in a consistent way across all the colonies throughout the 10-year time-period. Each nest record includes key demographic information including clutch size, brood size, the number of birds fledged from the nest, and estimates of first-egg, hatch and fledging dates. For each colony the percent of occupied nest cavities is also recorded.
We consider three classes of predictor variables.
Nest and colony variables
Some of these factors are under at least partial control of nest box managers. These include the style of nest box, with an expectation of enhanced breeding success in the larger “gourd style” box following the results of previous studies with this species (Raleigh et al. Reference Raleigh, Ray, Grisham, Siegrist and Greene2019; Williams et al. Reference Williams, Dittmar and Smith Pagano2020). We also included the size of the colony, with an expectation that moderately-sized colonies will balance the positive aspects of colonial living such as predator defense (Brown et al. Reference Brown, Stutchbury and Walsh1990), with the potential negatives including increased parasite load, mate guarding, and resource competition (Brown et al. Reference Brown, Stutchbury and Walsh1990; Davis and Brown Reference Davis and Brown1999; Williams et al. Reference Williams, Dittmar and Smith Pagano2020). We also considered nest-scale factors which are endogenously controlled by the birds themselves, and thus, not under the direct control of conservation – date of first egg, and clutch size. Eggs laid earlier in the season are predicted to result in a higher overall number of fledglings (Williams et al. Reference Williams, DeLeon and DeLeon2024), likely due to a combination of enhanced parental quality (Taroff et al. Reference Tarof, Kramer, Tautin and Stutchbury2012) and environmental factors, such as weather and prey availability (Daan et al. Reference Daan, Dijkstra and Tinbergen1990). Finally, we expect an increased number of fledglings to be predicted by an increased number of eggs. However, this is unlikely to be a purely linear relationship, and we have expectation of diminishing returns on unusually large clutch sizes (Godfray and Parker Reference Godfray and Parker1991).
Local scale habitat variables
With a “nest box species” the habitat surrounding nest boxes is somewhat controllable since new colonies can be positioned in optimal habitat for conservation purposes. Purple Martins tend to be associated with areas of open water where they hunt for flying insects (Jackson and Tate Reference Jackson and Tate1974; Anderson and Hvenegaard Reference Anderson and Hvenegaard2021). They also prefer areas of low-growing vegetation situated a short distance from wooded habitat (Anderson and Hvenegaard Reference Anderson and Hvenegaard2021; Brown and Tarof Reference Brown, Tarof and Rodewald2013). In addition to prey type and availability, disturbance associated with higher levels of human development may also play a role in nest site selection and success. We expected colonies situated in areas with open water or marsh, predominantly low vegetation, near wooded areas, and with limited human development to be most successful.
Local scale stochasticity/ weather variables
Stochastic factors including daily temperature and precipitation levels during the breeding season likely directly impact fledging rate. Cooler temperatures and rainy days make effective incubation more challenging for parents (Williams and DeLeon Reference Williams and DeLeon2020) and potentially result in mortality for young unfeathered nestlings, not yet capable of thermoregulation (Whittow and Tazawa Reference Whittow and Tazawa1991). For aerial insectivores, cool and wet weather is also predicted to lead to a reduced fledging rate due to decreased food availability.
We use random forest modeling of the three classes of variables to predict the number of nestlings fledged per nest both as a one-stage process (going from eggs to fledglings) and as a two-stage process (separating out the factors affecting the incubation stage from those affecting the nestling stage). There is good reason to expect different external drivers of these two biologically distinct processes. For example, ambient temperatures might be the crucial determinant of incubation success as it affects embryo development, but rainfall might have a more direct role in predicting prey availability for the provisioning stage (Raleigh et al. Reference Raleigh, Ray, Grisham, Siegrist and Greene2019).
Through a full analysis of these three classes of predictor variables, we hope to better understand the potential and limitations for conservation interventions to impact breeding success in this declining migratory songbird.
Methods
Study site and monitoring
Our study included six established and distinct colonies of Purple Martins in Western New York State (Table 1). Distinct colonies were delimited by their separation distance (see below). All six colonies were in habitat considered typical for breeding Purple Martins (Allen and Nice Reference Allen and Nice1952) with common habitat types in the vicinity of the colonies including open water, marsh, forested wetlands, shrublands and forest. Some of these colonies include multiple nesting structures, which were separated by no more than 300 m. The shortest distance separating any of the six distinct colonies was 3.5 km. The full dataset comprised a total of 2,041 nests, monitored over a ten-year period.
Summary of Purple Martin colonies considered in this study

Table 1. Long description
The table consists of five columns and seven rows including a total row.
* Row 1: Iroquois H Q, 3 nesting structures, 40 maximum nest sites, located at Iroquois National Wildlife Refuge, 2015 to 2024 (10 years).
* Row 2: Job Corps, 5 nesting structures, 108 maximum nest sites, located at Iroquois National Wildlife Refuge, 2015 to 2024 (10 years).
* Row 3: Tops Pond, 1 nesting structure, 22 maximum nest sites, located at Tonawanda Wildlife Management Area, 2015 to 2024 (10 years).
* Row 4: Mud Creek, 1 nesting structure, 22 maximum nest sites, located at Tonawanda Wildlife Management Area, 2016 to 2024 (9 years).
* Row 5: Goose Pond, 2 nesting structures, 44 maximum nest sites, located at Oak Orchard Wildlife Management Area, 2015 to 2024 (10 years).
* Row 6: Batavia W T P, 2 nesting structures, 24 maximum nest sites, located at Batavia Wastewater Treatment Plant, 2017 to 2024 (8 years).
* Row 7 (Total): 14 nesting structures and 260 maximum potential nest sites across all colonies.
All six colonies were monitored by the same team of staff and volunteers using a single protocol for nest checks and data recording. Nests were checked weekly between nest initiation and fledging and the monitors recorded the number of eggs and nestlings. When eggs were first observed in a nest, the first egg date was estimated based on the assumption that one egg is laid each morning. The first time that nestlings were observed, their age was estimated based on morphological characteristics and hatch date was estimated. Nestlings typically fledged around 28 days old, and nestlings absent from the nest were considered fledged when aged 25 days or older, but deceased when missing at an earlier age. The presence of available, but unused nesting cavities was also recorded. We computed the percentage of potential nesting sites that were vacant for each colony each year. We defined a vacancy to be a potential nest site in which no eggs were laid.
Predictors of fledging success
We assembled data to describe factors affecting the number of fledglings produced by a Purple Martin nesting attempt. Predictor variables are explained below and summarised in Table 2.
Summary of predictor variables included in each of the three models. An “O” denotes that a variable was included in the global for a specified model. An “X” denotes that the variable was maintained in the final presented model after model selection
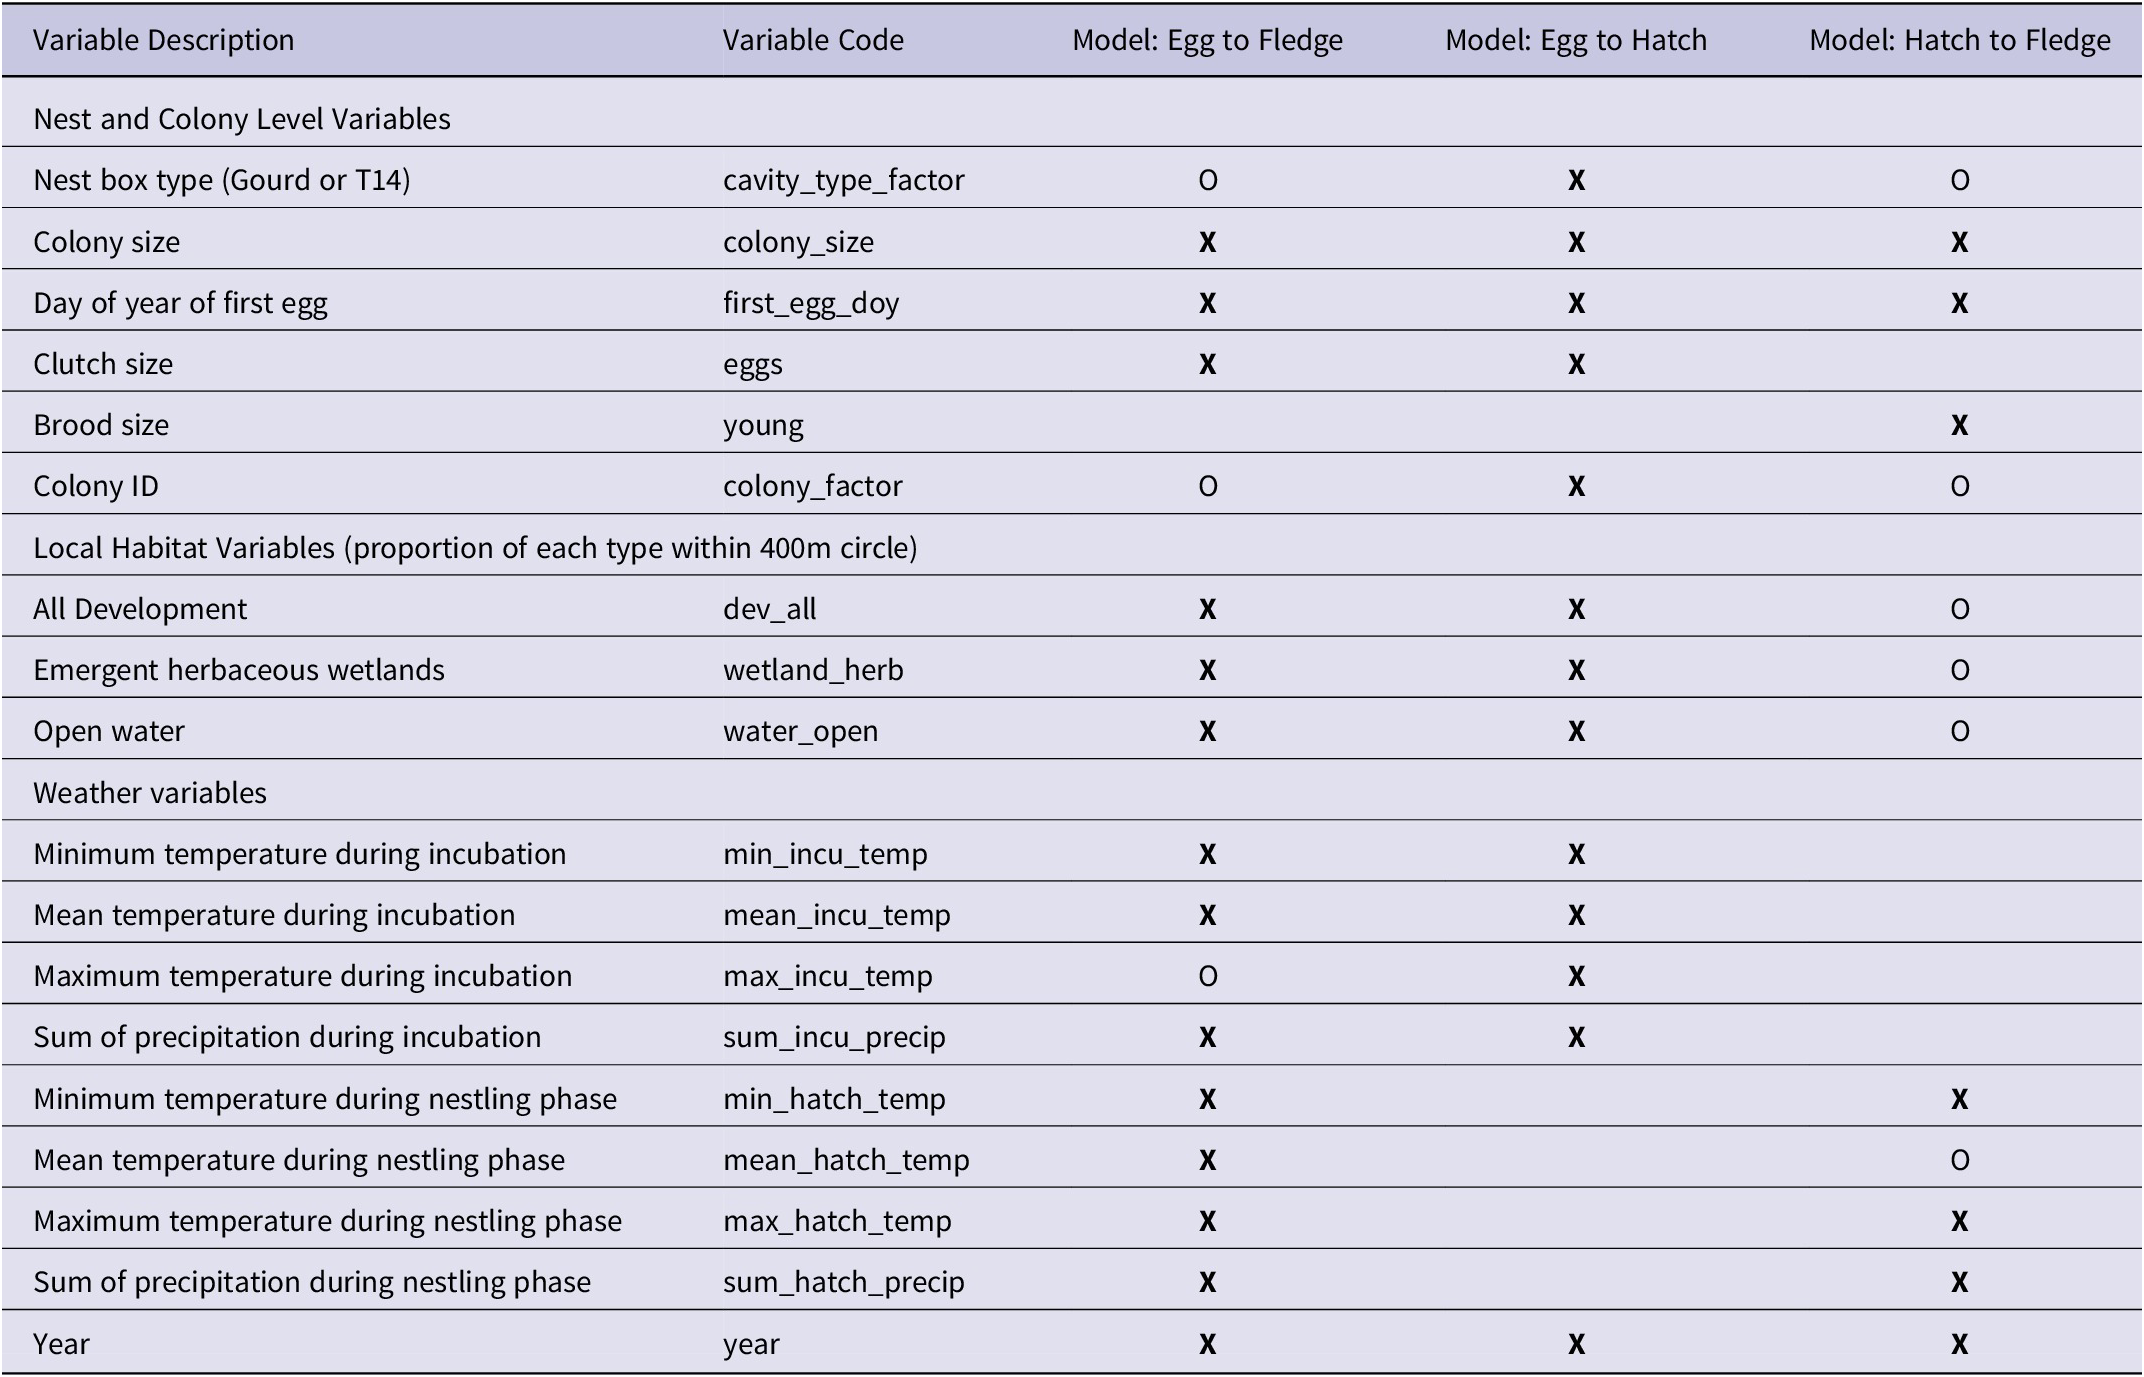
Table 2. Long description
The table consists of five columns: Variable Description, Variable Code, Model: Egg to Fledge, Model: Egg to Hatch, and Model: Hatch to Fledge.
Nest and Colony Level Variables:
- Nest box type (cavity_type_factor): O in Egg to Fledge and Hatch to Fledge; X in Egg to Hatch.
- Colony size (colony_size): X in all three models.
- Day of year of first egg (first_egg_doy): X in all three models.
- Clutch size (eggs): X in Egg to Fledge and Egg to Hatch; not applicable to Hatch to Fledge.
- Brood size (young): X in Hatch to Fledge; not applicable to other models.
- Colony I D (colony_factor): O in Egg to Fledge and Hatch to Fledge; X in Egg to Hatch.
Local Habitat Variables (proportion within 400m circle):
- All Development (dev_all): X in Egg to Fledge and Egg to Hatch; O in Hatch to Fledge.
- Emergent herbaceous wetlands (wetland_herb): X in Egg to Fledge and Egg to Hatch; O in Hatch to Fledge.
- Open water (water_open): X in Egg to Fledge and Egg to Hatch; O in Hatch to Fledge.
Weather variables:
- Minimum temperature during incubation (min_incu_temp): X in Egg to Fledge and Egg to Hatch.
- Mean temperature during incubation (mean_incu_temp): X in Egg to Fledge and Egg to Hatch.
- Maximum temperature during incubation (max_incu_temp): O in Egg to Fledge; X in Egg to Hatch.
- Sum of precipitation during incubation (sum_incu_precip): X in Egg to Fledge and Egg to Hatch.
- Minimum temperature during nestling phase (min_hatch_temp): X in Egg to Fledge and Hatch to Fledge.
- Mean temperature during nestling phase (mean_hatch_temp): X in Egg to Fledge; O in Hatch to Fledge.
- Maximum temperature during nestling phase (max_hatch_temp): X in Egg to Fledge and Hatch to Fledge.
- Sum of precipitation during nestling phase (sum_hatch_precip): X in Egg to Fledge and Hatch to Fledge.
- Year (year): X in all three models.
Nest and colony variables
Two different nest box types were included in this study – Troyer T-14 martin houses (Troyer PT-14C White Roof) providing birds with a somewhat smaller overall volume, and plastic gourds (Troyer TVGC and THGC) with a somewhat larger volume. The colony size was the number of nests in the specified colony during the specified year. The day of year that the first egg in a clutch was laid was recorded for each nest to reflect nest seasonality. The clutch size was considered as the number of eggs laid in a single nesting attempt, and the brood size was the maximum number of nestlings observed at a given nest. Finally, the colony ID variable matched each nesting effort with one of our six studied colonies in an attempt to quantify residual colony-level variation not captured in our biological variables.
Local scale habitat variables
We used a 400 m radius circle around each nesting structure to analyse local habitat. This distance was chosen based on estimated foraging ranges of nesting Purple Martins from our previous study at the Iroquois HQ colony site (Williams et al. Reference Williams, DeLeon and DeLeon2024). Habitat variables were assessed using United States Geological Survey (USGS) National Landcover Database (NLCD) layers from 2015–2023. Descriptions and divisions of landcover classes were based on the Anderson II classification system with descriptions available online through USGS (Anderson et al. Reference Anderson, Hardy, Roach and Witmer1976; U.S. Geological Survey 2024). A buffer was calculated around each individual nest structure then extracted from NLCD raster data layers. The proportion of each habitat class within the buffer was calculated in R 4.3.2 using the Terra spatial analysis package to estimate proportions of habitat types within each buffer circle (Hijmans Reference Hijmans2025; R Core Team 2023). During data analysis, the nest success response variables for each nest in each year were associated with the habitat metrics from the buffer around the associated nest structure in the relevant NLCD year raster. The individual NLCD habitat categories we assessed included: barren land, hay/pasture, developed high intensity, developed low intensity, developed medium intensity, developed open space, deciduous forest, woody wetlands, emergent herbaceous wetlands, and open water. We also built four combined variables where we added together proportions of all crop cover types, all development levels, all forest types, and all wetland types. In addition, distance from each nest structure to nearest edge of open water marsh was measured based on satellite imagery.
Local scale stochasticity/weather variables
Weather variables considered included: maximum, minimum and mean temperatures, and the sum of precipitation recorded during both the incubation and nestling phase. Weather data (daily temperatures and precipitation) were obtained from the Iroquois National Wildlife Refuge weather station (https://wrcc.dri.edu/). All weather variables used were specific to the timing of each individual nest. For example, “incubation maximum temperature” recorded the maximum temperature for the 21 days after the first egg was laid, to match the known mean incubation duration in this species. Similarly, “nestling sum of precipitation” recorded the total precipitation for 28 days after the first egg hatch to match the average duration of the nestling phase. Year was also considered as a predictor in the model to capture additional variability in conditions each year.
Preliminary Analysis
For weather and nest/colony level variables we computed a complete correlation matrix to eliminate highly correlated variables (Pearson’s r > 0.8) in a single model. Where large correlations occurred, we used single predictor models (linear regression, t-tests or analysis of variance, as dictated by the data type) to determine which predictor to maintain. We found that colony size was highly correlated with distance to water (r = 0.89, P < 0.001). Although in general there is not an a priori reason to expect this correlation, it is likely based on the coincidence that in our study the largest colonies are located furthest from the nearest water. We retained colony size since it explained more variation in preliminary studies and in the subsequent random forest calculations. All other weather and colony variables were also retained.
For habitat variables we followed the same process of creating a correlation matrix to eliminate highly correlated pairings (r > 0.8). We then built five alternative preliminary habitat sets, avoiding any highly correlated variables. These five habitat variable sets were combined with the nest and weather variables. We ran all five combined global models and then selected the model with the best fit in terms of variance explained and root mean square error. The top global model included the habitat variables ‘all developed area’, ‘emergent herbaceous wetlands’ and ‘open water’ as well as all retained nest and weather variables (Table 2).
Random Forest models
Our suite of predictors included both numerical and categorical variables, with a wide range of hypothesised relationships with fledging success. Random forest models are a good choice for datasets like this given they allow for the data to flexibly dictate the shape of the predicted relationship. Random forest models can be used to indicate variable dependence and compute variable importance. The large nest sample size provided an ample basis for a random forest model.
We used the ‘randomForest’ R package (Liaw and Weiner Reference Liaw and Wiener2002) in R 4.3.2 (R Core Team 2023). All the fits we reported are from regressions with 80% training data and 20% of the data set aside for test validation.
We created three different random forest analyses of the nesting process. The first modeled the entire nesting process in a single model starting at eggs and ending with fledglings. For further insight, we supplemented this with two additional random forest models, one for the incubation stage and one for the nestling stage (Table 2).
To avoid overfitting, we followed a model selection process. We sequentially eliminated the poorest performing variables in terms of variable importance to find an optimum RMS error and overall variance explained. RMS error and variance explained always tracked together.
Results
Nest occupancy and productivity
Raw data showing the number of nests, eggs, nestlings, fledglings and occupancy over the ten-year period are shown in Table 3. Over the ten-year study period, the 2,041 nests produced 10,270 eggs, 8,177 young and fledged 6,860 birds. This is an 80% hatch rate of the eggs, an 84% fledge rate of the young and a net fledge rate of the eggs of 67%.
Summary of nest occupancy and productivity. Nests rows indicate the number of nestboxes in which at least one egg was laid, with numbers in parentheses indicating the potential capacity of the colony. Note that the number of nests can exceed the number of nest boxes available when two nests are made serially in a cavity. Eggs, nestlings and fledglings rows give the total number of eggs, young or fledged from the colony during the specified year
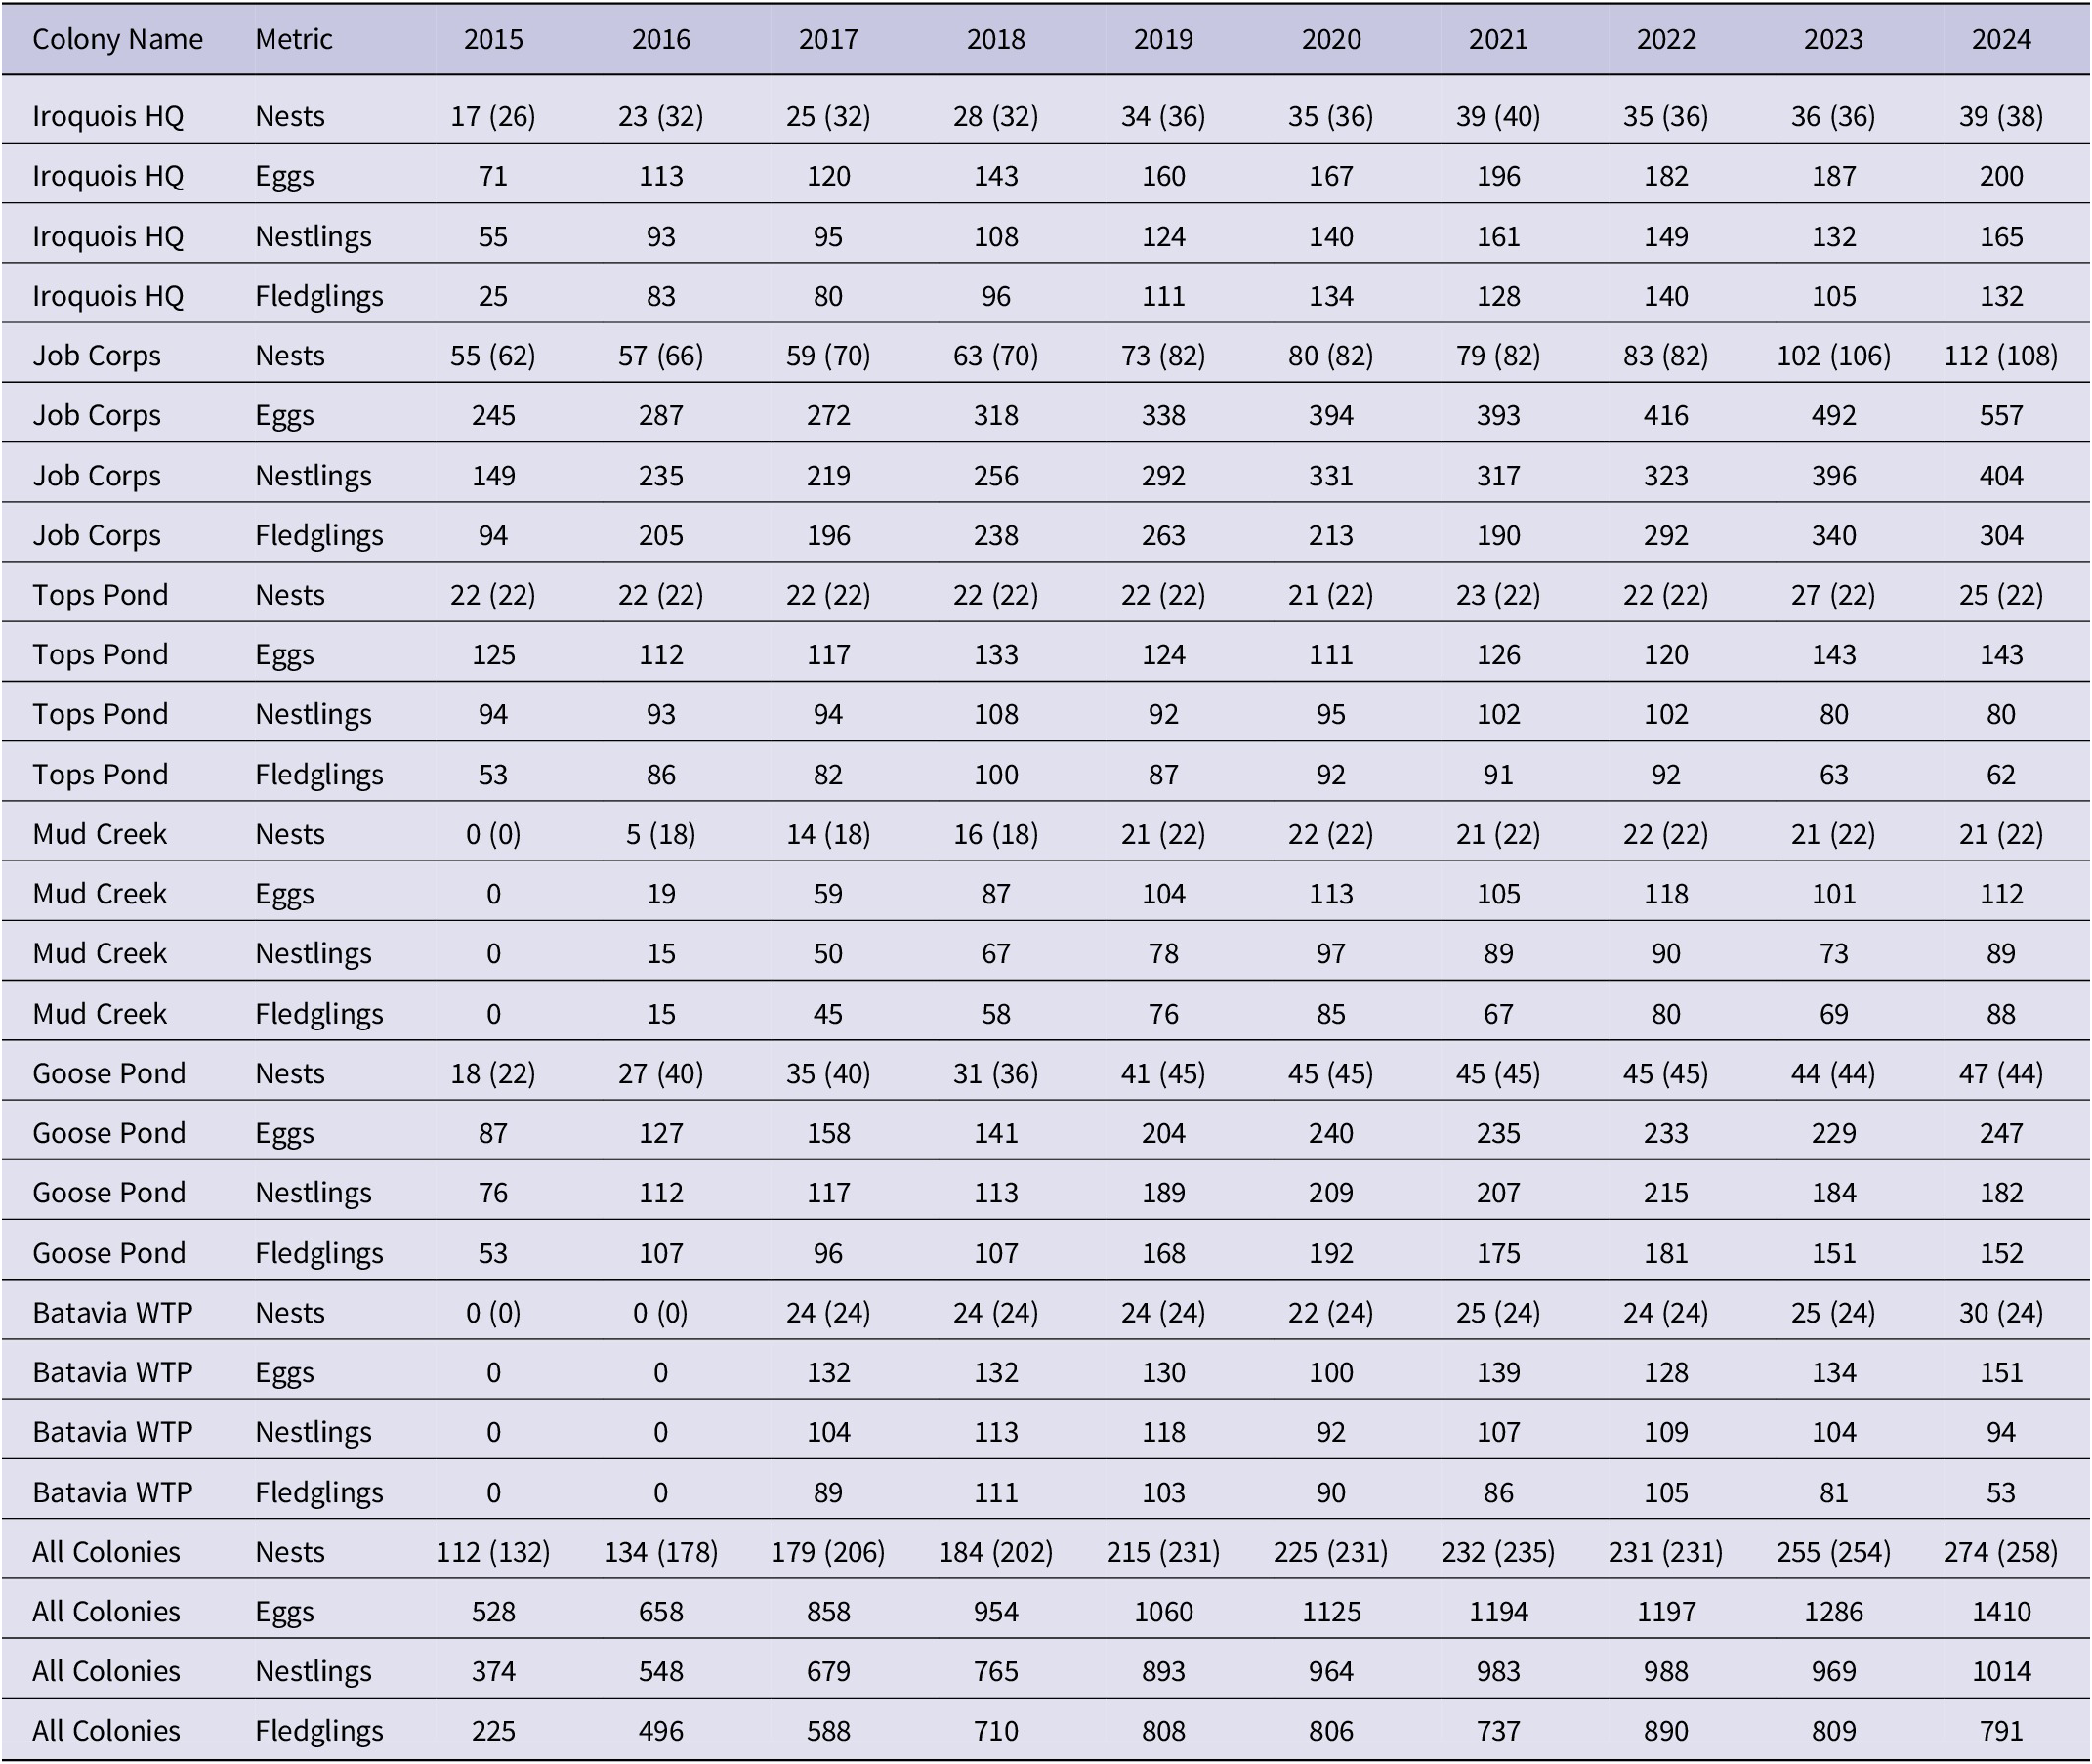
Table 3. Long description
The table tracks four metrics: Nests (with potential capacity), Eggs, Nestlings, and Fledglings across seven categories: Iroquois H Q, Job Corps, Tops Pond, Mud Creek, Goose Pond, Batavia W T P, and All Colonies.
* Iroquois H Q: Nests grew from 17 in 2015 to 39 in 2024. Eggs increased from 71 to 200. Fledglings peaked at 140 in 2022.
* Job Corps: Nests increased from 55 to 112. Eggs rose from 245 to 557. Fledglings peaked at 340 in 2023.
* Tops Pond: Nests remained stable around 22 to 25. Eggs fluctuated between 111 and 143. Fledglings peaked at 100 in 2018.
* Mud Creek: Started with 0 nests in 2015, growing to 21 by 2024. Eggs reached a high of 118 in 2022.
* Goose Pond: Nests increased from 18 to 47. Eggs rose from 87 to 247. Fledglings peaked at 192 in 2020.
* Batavia W T P: No activity until 2017. Nests grew from 24 to 30 by 2024. Eggs peaked at 151 in 2024.
* All Colonies Total: Total nests increased from 112 in 2015 to 274 in 2024. Total eggs rose from 528 to 1410. Total fledglings increased from 225 to 791, with a peak of 890 in 2022.
A plot of percentage vacancy by colony and by year is shown in Figure 1. There is often a period of 2-3 years with high vacancy rates while a colony is becoming established. After this induction period, the vacancy rate drops down to 10% or less.
Percentage of potential sites that are vacant in each colony each year.

Figure 1. Long description
The x-axis is labeled year and ranges from 2015 to 2024. The y-axis is labeled percent vacancy and ranges from 0 to 60. A legend on the right titled Colony name identifies six locations.
* Mud Creek (green line with crossed square markers) starts at a peak of over 70 percent in 2016 and drops sharply to near 0 percent by 2020.
* Iroquois H Q (purple line with square markers) starts at 35 percent in 2015 and trends downward to 0 percent by 2024.
* Goose Pond (orange line with triangle markers) fluctuates between 10 and 30 percent from 2015 to 2019 before dropping to near 0 percent.
* Job Corps (pink line with plus markers) maintains a relatively stable but slightly declining trend between 15 percent and 5 percent.
* Batavia W T P (teal line with diamond markers) remains at 0 percent until 2020 where it peaks briefly at 10 percent before returning to near 0.
* Tops Pond (yellow line with star markers) remains at 0 percent for the entire duration from 2015 to 2024.
Overall, the graph shows a convergence toward low vacancy rates for all colonies by the year 2024.
Full nest cycle model
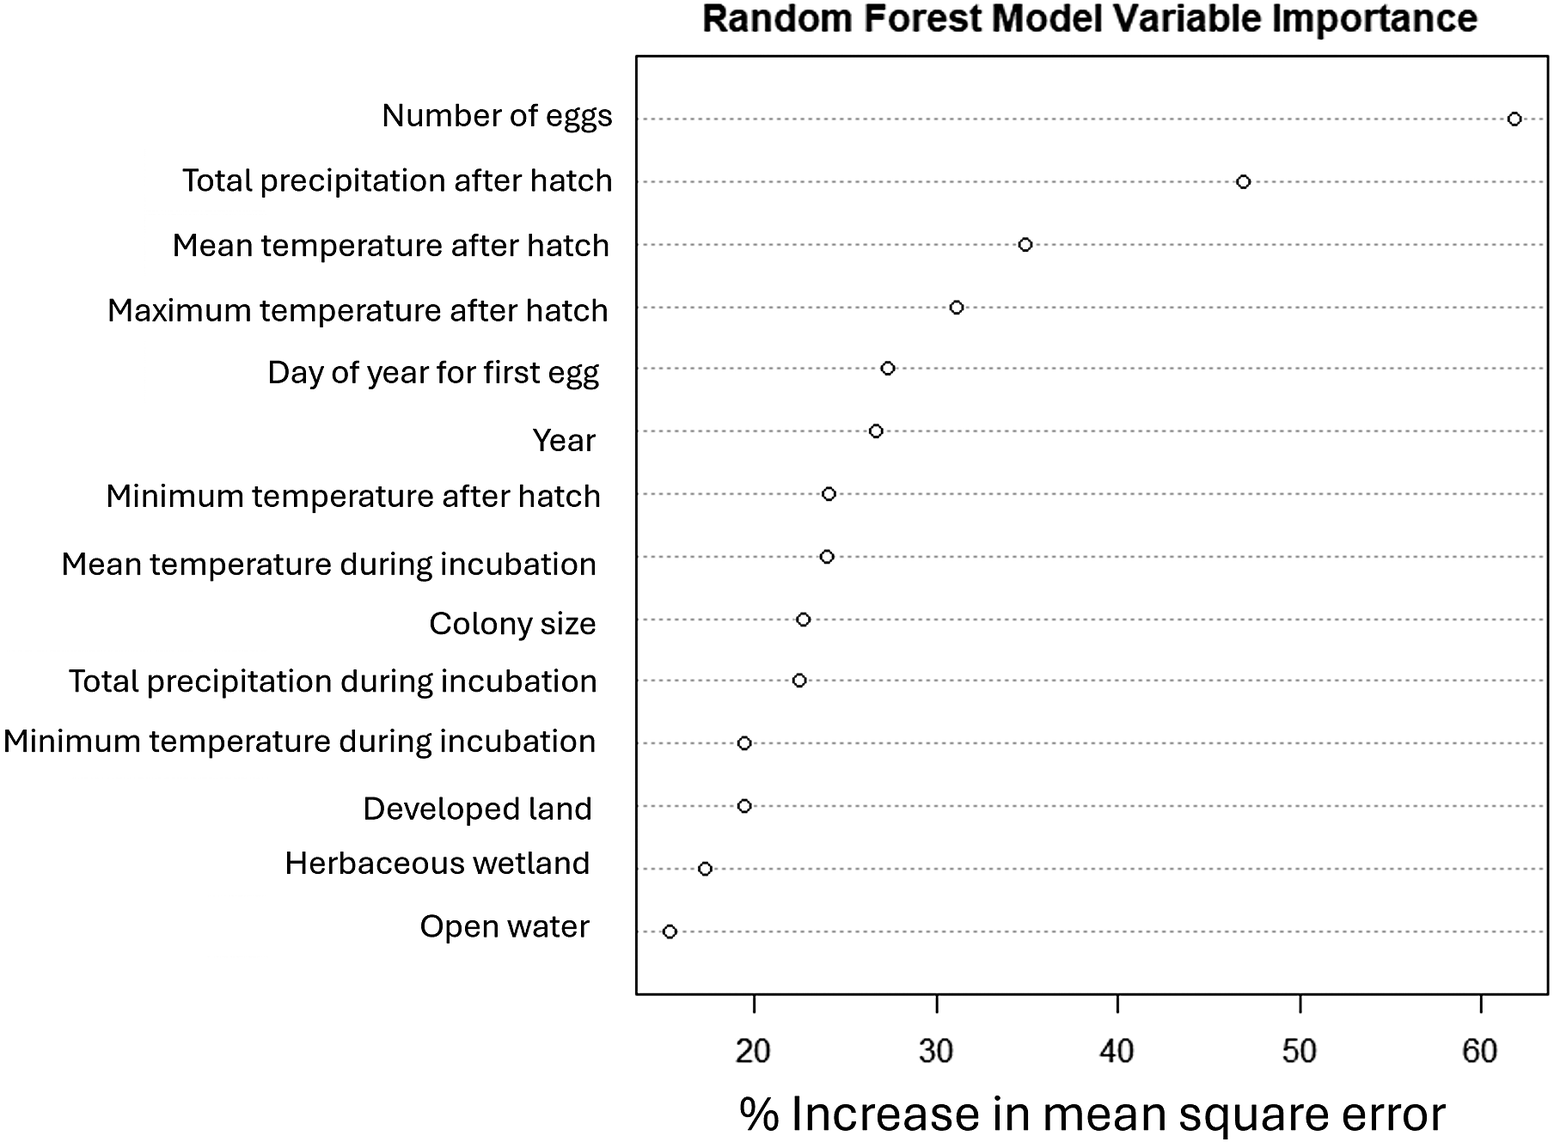
In the one-part random forest model we modeled the entire nesting process to predict how many fledglings are produced per nest, taking eggs as the starting point. After variable and model selection processes (see Methods) the model which produced the highest percent variance explained (32.6%) and the lowest root-mean-square error (1.56) included 14 predictor variables (Table 2 and Figure 2). Although the 14-variable model is the best, there was not a great deal of difference between the different model sets. In the range of 6 to 17 variables the variance explained only ranges from a low of 28.6% to the high of 32.6% (Figure 2). Number of eggs was the strongest predictor of overall success, however precipitation and temperature during the fledgling period, as well as first egg date and year, all contributed >25% increase in MSCE. The partial plot dependences (Figure 3), illustrate the relationship between each predictor variable and the number of fledglings produced per nest.
Random forest variable importance for the one-part model which aims to predict the number of fledglings per nest, starting from the egg laying stage.

Figure 2. Long description
The horizontal x-axis is labeled percent Inc M S E, with numerical markers at 20, 30, 40, 50, and 60. The vertical y-axis lists 14 environmental and biological variables. Data points are represented by open circles on horizontal dotted grid lines, ranked from highest importance at the top to lowest at the bottom:
* eggs: approximately 62
* sum_hatch_precip: approximately 47
* mean_hatch_temp: approximately 35
* max_hatch_temp: approximately 31
* first_egg_doy: approximately 27
* year: approximately 26
* min_hatch_temp: approximately 24
* mean_incu_temp: approximately 24
* colony_size: approximately 23
* sum_incu_precip: approximately 22
* min_incu_temp: approximately 19
* dev_all: approximately 19
* wetland_herb: approximately 17
* water_open: approximately 15
Partial plots illustrating the dependency of the number of fledglings on each variable for the one-part model.

Figure 3. Long description
A multi-panel figure containing eight line graphs arranged in two columns and four rows. A vertical label on the far left reads Partial dependence.
* Top-left panel: X-axis is Number of eggs. The curve shows a sigmoid increase from 1 to 6 eggs, peaking at 7, then slightly declining and leveling off.
* Top-right panel: X-axis is Total precipitation during hatching. The curve rises sharply from 0 to 25, then fluctuates with a slight upward trend across higher values.
* Second row, left panel: X-axis is Mean temperature during hatching. The curve is stable until 20 degrees, peaks sharply at 22, then drops abruptly and levels off after 24 degrees.
* Second row, right panel: X-axis is Maximum temperature during hatching. The curve remains flat and low until 28 degrees, where it begins a steep linear increase.
* Third row, left panel: X-axis is Day of year of first egg. The curve is stable until day 160, then shows a steady, non-linear decline toward day 200.
* Third row, right panel: X-axis is Year. The curve rises from 2015 to 2017, remains at a high plateau until 2020, then declines steadily through 2024.
* Bottom-left panel: X-axis is Minimum temperature during hatching. The curve rises from 0 to 4 degrees, plateaus until 8 degrees, then shows a gradual accelerating decline.
* Bottom-right panel: X-axis is Mean temperature during incubation. The curve is relatively stable with minor fluctuations until 20 degrees, followed by a consistent downward trend.
The figure consists of six panels arranged in a 3 by 2 grid.
* Top-left panel: Partial Dependence on colony_size. The x-axis ranges from 20 to 100. The line shows a gradual decline from a value of 3.35 at x equals 20 to approximately 3.15 at x equals 110, with a sharp drop occurring after x equals 80.
* Top-right panel: Partial Dependence on sum_incu_precip. The x-axis ranges from 0 to 200. The value remains stable near 3.3 until x equals 80, then drops sharply to a plateau near 2.9 for values above 110.
* Middle-left panel: Partial Dependence on min_incu_temp. The x-axis ranges from 0 to 12. The line shows a peak at x equals 7 with a value of 3.30, sloping downwards on both sides toward 3.20.
* Middle-right panel: Partial Dependence on dev_all. The x-axis ranges from 6 to 16. The line rises to a plateau between x equals 10 and 13 at a value of 3.35, followed by a sharp drop to 3.15 at x equals 17.
* Bottom-left panel: Partial Dependence on wetland_herb. The x-axis ranges from 0 to 50. The line increases from 3.20 to a plateau of 3.35 between x equals 18 and 42, then drops sharply.
* Bottom-right panel: Partial Dependence on water_open. The x-axis ranges from 0 to 50. The line shows a sharp initial increase to a peak of 3.34 at x equals 5, followed by a very slight, near-linear decline across the rest of the range.
Incubation stage model
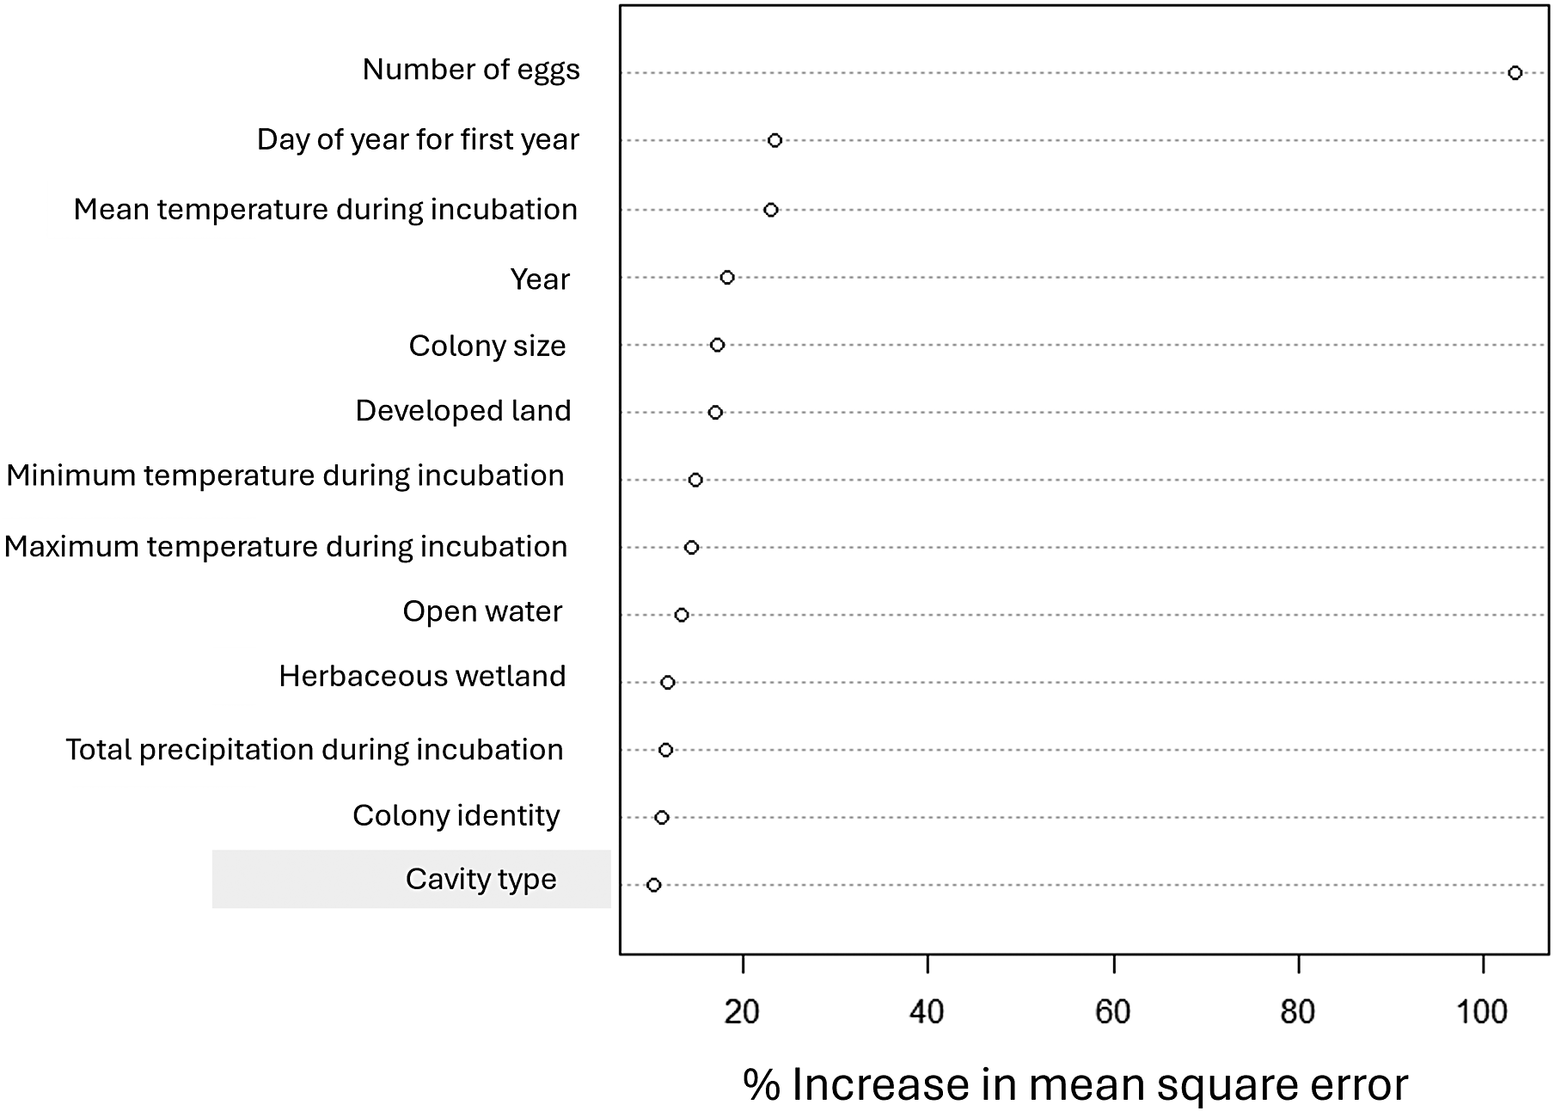
To provide further insight, we break up the nesting cycle into two parts. The first part is the incubation stage, which models the number of nestlings hatched from the eggs. In this case, all 13 candidate variables were retained in our model selection procedure (Table 2) to produce a model which explained 30.0% of the variance with a root-mean-square error of 1.48. Although the 13 variable model was the best, there was not a great deal of difference between the different model sets. In the range of 6 to 13 variables the variance explained only ranges from a low of 27.8% to the high of 30.0% (Figure 2). The variable importances are shown in Figure 4. The partial plot dependences (Figure 5) illustrate the relationship between each predictor variable and the number of nestlings produced per nest.
Random forest variable importance for the incubation stage of the two-part model.

Figure 4. Long description
A dot plot titled Random Forest Model Variable Importance. The X-axis is labeled percent I n c M S E with numerical markers at 20, 40, 60, 80, and 100. The Y-axis lists 13 variables from top to bottom in descending order of importance. Each variable is associated with a horizontal dotted line and a single open circle data point.
* eggs: The highest importance, with a value exceeding 100.
* first underscore egg underscore d o y: Approximately 23.
* mean underscore incu underscore temp: Approximately 22.
* year: Approximately 18.
* colony underscore size: Approximately 17.
* dev underscore all: Approximately 16.
* min underscore incu underscore temp: Approximately 15.
* max underscore incu underscore temp: Approximately 14.
* water underscore open: Approximately 13.
* wetland underscore herb: Approximately 12.
* sum underscore incu underscore precip: Approximately 11.
* colony underscore factor: Approximately 11.
* cavity underscore type underscore factor: The lowest importance, at approximately 10.
Partial plots illustrating the dependency of the number of nestlings on each variable for the incubation stage of the two-part model.

Figure 5. Long description
A multi-panel figure containing eight line graphs arranged in two columns. A vertical label on the left side reads Partial dependence.
Top-left panel: Number of eggs on the x-axis from 2 to 10. The line shows a steady increase, peaking at 6 eggs before a slight decline and plateau.
Top-right panel: First egg day of year on the x-axis from 120 to 200. The line remains high and stable until day 160, then shows a sharp step-like decrease.
Second row, left panel: Mean incubation temperature on the x-axis from 16 to 24. The line fluctuates with a peak around 19 degrees Celsius followed by a steady decline.
Second row, right panel: Year on the x-axis from 2016 to 2024. The line forms a broad arch, peaking around 2019 to 2020 and declining sharply after 2022.
Third row, left panel: Colony size on the x-axis from 20 to 100. The line shows a jagged upward trend with peaks at 45 and 80, followed by a sharp drop after 110.
Third row, right panel: Development all on the x-axis from 6 to 16. The line is stable until 8, rises to a plateau between 10 and 12, then drops significantly.
Bottom-left panel: Minimum incubation temperature on the x-axis from 0 to 12. The line is stable until 7 degrees Celsius, then shows a steep, staggered decline.
Bottom-right panel: Maximum incubation temperature on the x-axis from 29 to 35. The line shows a consistent linear increase peaking at 32.5 degrees Celsius before declining.
The figure consists of five panels arranged in three rows.
1. Top-left: Line graph titled Partial Dependence on water_open. The x-axis ranges from 0 to 50. The y-axis ranges from 3.88 to 3.96. The curve peaks sharply at x equals 5, then levels off to a horizontal line around y equals 3.92 for the remainder of the range.
2. Top-right: Line graph titled Partial Dependence on wetland_herb. The x-axis ranges from 0 to 50. The y-axis ranges from 3.65 to 3.90. The line remains stable near 3.90 until x equals 45, where it drops sharply to 3.70.
3. Middle-left: Line graph titled Partial Dependence on sum_incu_precip. The x-axis ranges from 0 to 200. The y-axis ranges from 3.70 to 3.95. The curve rises gradually to a peak at x equals 75, then drops abruptly at x equals 110 to a low, flat baseline.
4. Middle-right: Bar chart titled Partial Dependence on colony_factor. The x-axis lists six categories: B W _ L, G P _ L, H Q _ L, J C _ L, M C _ L, and T P _ L. The y-axis ranges from 0 to 4. All six blue bars show nearly identical heights near the value of 4.
5. Bottom-left: Bar chart titled Partial Dependence on cavity_type_factor. The x-axis has two categories: C and G. The y-axis ranges from 0 to 2. Both blue bars are of equal height, reaching the value of 2.
Nestling stage model
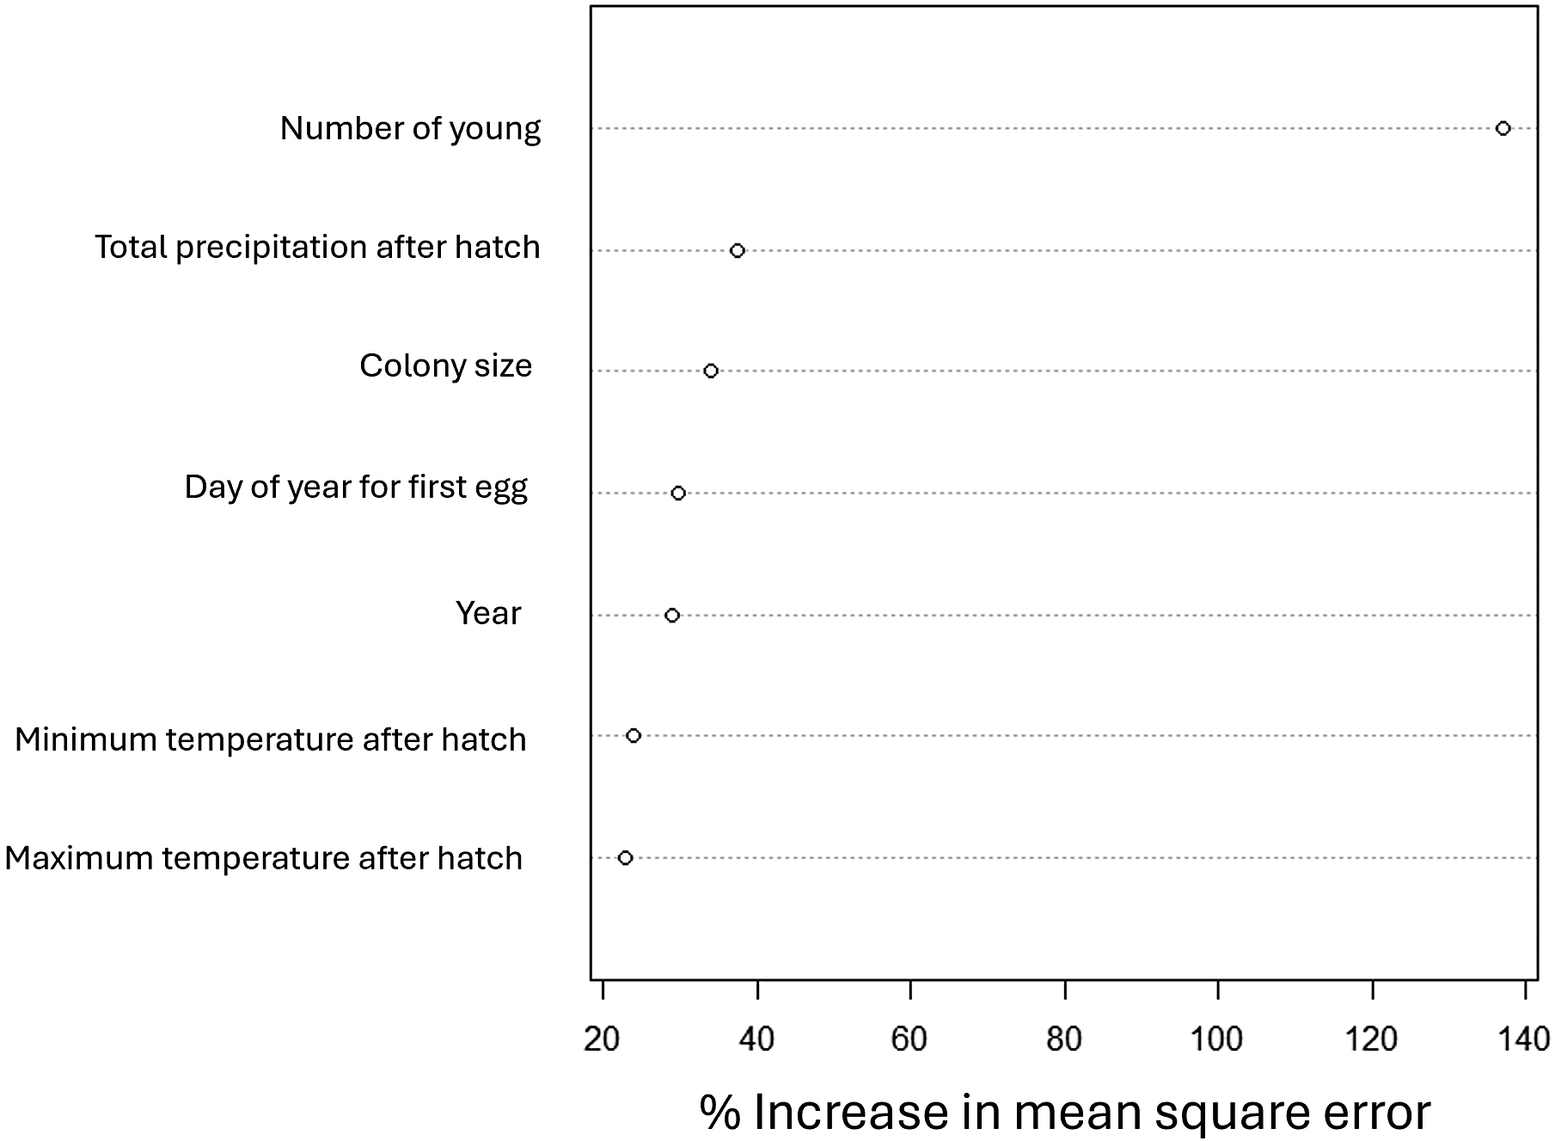
The second part of our two-part model covers the nestling stage, which models the number of fledglings based on the number of nestlings which hatched from the eggs. In this case, our model selection process eliminated 7 candidate variables, leaving a 7-variable model (Table 2) which explained 66.1% of the variance with a root-mean-square error of 1.11. Although the 7-variable model is the best, there is not a great deal of difference between the models. In the range of 6 to 14 variables the variance explained only ranges from a low of 64.0% to the high of 66.1%. The variable importances are shown in Figure 6. The partial plot dependences (Figure 7) illustrate the relationship between each predictor variable and the number of fledglings produced per nest. Like the previous models, the starting point, in this case number of nestlings, was the most important variable. However, in this model all top variables contributed >25% increase in MSE.
Random forest variable importance for the nestling stage of the two-part model.

Figure 6. Long description
The horizontal x-axis is labeled percent increase in M S E, with a scale from 20 to 140. The vertical y-axis lists seven environmental and biological variables. Data points are represented by open circles on horizontal dashed lines. From top to bottom, the variables and their approximate values are:
* Number of young: 138
* Sum of hatch precipitation: 38
* Colony size: 34
* First egg day of year: 30
* Year: 29
* Minimum hatch temperature: 24
* Maximum hatch temperature: 23
The number of young variable shows a significantly higher importance compared to all other variables, which are clustered between 20 and 40 percent increase in M S E.
Partial plots illustrating the dependency of the number of fledglings on each variable for the nestling stage of the two-part model.

Figure 7. Long description
A multi-panel figure containing seven line graphs arranged in two columns. The vertical y-axis for all plots represents Partial dependence.
* Top-left graph: Number of young on the x-axis from 0 to 8. The line shows a sigmoidal increase, leveling off after 6.
* Top-right graph: Sum hatch precipitation on the x-axis from 0 to 200. The line rises sharply at the start and then fluctuates around a high plateau.
* Second row left: Colony size on the x-axis from 20 to 100. The line shows an overall downward trend with several small peaks and plateaus.
* Second row right: Year on the x-axis from 2016 to 2024. The line increases until 2018, plateaus, and then slightly declines after 2020.
* Third row left: First egg day of year on the x-axis from 120 to 200. The line is stable until 140, peaks around 150, and then declines steadily.
* Third row right: Maximum hatch temperature on the x-axis from 0 to 35. The line is flat until 25, then shows a sharp exponential increase.
* Bottom-left graph: Minimum hatch temperature on the x-axis from 0 to 12. The line stays low until 2, rises sharply to a plateau between 3 and 7, and then declines after 8.
Of particular note in the partial plots is that the models indicated little to no additional benefit of increasing brood size beyond 6, with unusually large broods of 7 or 8 nestlings resulting in a similar number of fledglings as 6-nestling broods. We also found that both extremely dry conditions and very wet conditions in the nestling phase impacted fledge rate, while relatively warm conditions (with a maximum temperature above 28 °C) substantially increased the chances of fledging. Our nestling success model also indicated a negative effect of colony size becoming too large (around 80 nests in our location). Finally, higher nest productivity was associated with a moderately low proportion of human development (8–13% in our location), a substantial amount of wetland herbaceous habitat (20–45% in our location) and when there is at least a small amount of open water within their home range.
Discussion
In our ten-year dataset, we found that 80% of all eggs hatch, and 84% of those nestlings go on to fledge the nest. Overall, this means that 67% of eggs result in a fledgling. This is lower than recent range-wide estimates of hatch rates closer to 90% and nestling to fledging rates of around 88% in Purple Martins (Raleigh et al. Reference Raleigh, Ray, Grisham, Siegrist and Greene2019). We do note, however, that our region (Great Lakes) had the lowest survival percentages of all regions considered in that dataset. Our nesting success is also slightly lower than historical estimates of hatching success, around 91% in Purple Martin colonies in Michigan (Allen and Nice,Reference Allen and Nice1952) and Texas (Brown Reference Brown1978). It is also lower than an observed 92% survival of nestlings in nestbox populations of Tree Swallows Tachycineta bicolor, a sympatrically-breeding, closely-related species in Ontario (DeSteven Reference De Steven1980). The somewhat low productivity, paired with a high variability within our dataset, suggests the potential for identifying an underlying cause and indicates a need for conservation actions to improve breeding success in this set of colonies.
In terms of variance explained, our most successful modeling approach sought to explain the number of nestlings which go on to fledge (the nestling only stage model). We can get some insight into the nestling stage by examination of the variable partial plots in Figure 7. Quite naturally, the most influential predictor of the number of fledglings was the number of nestlings, but there appears to be diminishing returns on very large broods, with the number of fledglings produced plateauing after 6 nestlings. This is in common with other empirical studies into Purple Martin breeding dynamics (Brown Reference Brown1978) and evolutionary theory of clutch size optimisation more generally (Lack Reference Lack1947). Our results also indicated a strong role of temperature and precipitation in the nestling stage for predicting fledging success. Since Purple Martins are aerial insectivores, nestling survival is expected to depend heavily on weather conditions affecting prey availability. For example, a study of Tree Swallows in New York found that cold snaps were the top cause of nestling mortality, mediated by a drop in food availability (Winkler et al. Reference Winkler, Luo and Rakhimberdiev2013). Our model also highlighted a negative effect of very large colony size on fledge rate. Increasing colony size in Purple Martins has previously been shown to result in a higher ectoparasite load and increased intraspecific interference competition (Davis and Brown Reference Davis and Brown1999) and might also result in resource competition. Although Davis and Brown (Reference Davis and Brown1999) did not find an overall negative effect of increased colony size on reproductive output, we note that their maximum colony size is below the point at which we note an effect in our study. In line with previous work, we observed a decline in the fledging rate of nestlings in late-season nests (Williams et al. Reference Williams, Dittmar and Smith Pagano2020; Williams et al. Reference Williams, DeLeon and DeLeon2024) and some variability by year. While a ten-year timespan is likely insufficient to detect an effect of climate change, this annual variability may be the result of unquantified variation in weather conditions.
Compared with the nestling phase of our two-part model, both the 1-part model (describing the entire process from eggs to fledglings) and the incubation stage of the 2-part model did not perform as well. Many of the relationships supported the findings described above for the nestling phase of the 2-part model. However, these models both retained additional predictors after model selection highlighting the importance of habitat characteristics. We can get some insight into the fledgling stage by examination of the variable partial plots in Figures 3 and 5. Nestlings were more likely to fledge when surrounded by wetland, in areas of low to moderate human development, with easy access to open water. All of these associations support what is considered typical Purple Martin breeding habitat (Allen and Nice Reference Allen and Nice1952), but are arguably limited in scope given the high proportion of these habitat types in our study area. Since nest structures were already placed in presumed Purple Martin habitat there was also limited variability in the habitat immediately adjacent to the study colonies. The incubation model also supported the findings of Raleigh et al. (Reference Raleigh, Ray, Grisham, Siegrist and Greene2019) who found an effect of nest box design on breeding productivity, with a higher output from gourd style nest boxes.
Given the similarity in incubation success (80%) and nestling success (84%), it may seem surprising we were able to explain twice as much of the variance in nestling survival as we were in egg hatch rate. Clearly, the current variable set is producing a far better prediction of the hatchling/provisioning phase than the incubation phase. A lot of the nestling mortality in our long-term dataset occurs when young nestlings are exposed to prolonged cold or wet conditions. Regardless of potential mitigating factors such as colony size or habitat characteristics, the selected variables account for a substantial proportion of the observed variation.
The failure of an egg to produce a nestling is not as well described by our models. It is possible that the incubation phase is more susceptible to subtle intrinsic factors, such as parental health and fertility, or behaviours like attentiveness to incubation. In contrast, the nestling phase may be more dependent on easily measured environmental factors such as habitat, or average seasonal weather conditions. Our nest check protocol was not set up to distinguish between different causes of egg failure. That means that we are unable to confidently differentiate between egg failure due to exogenous factors such as predation, to intrinsic aspects of parental quality, or to environmental factors such as temperature and precipitation. Future studies might consider collecting additional nest-level data to improve incubation phase models. Direct measurement of nest attentiveness using cameras or temperature sensors could help quantify parental behaviour. Capture and tracking of individual adults might help identify arrival times and body condition that could correlate with parental fitness. Candling eggs to monitor embryo development and stage of failure could help directly correlate failure to parental fertility, timing of parental behaviours, or timing of weather events like individual storms or cold snaps. While these factors are not directly controllable by researchers or managers, their inclusion in models could still help explain overall Purple Martin success.
From a conservation perspective, we must consider what we can do to increase breeding productivity in the Purple Martin. This study indicates that nest box managers should consider the carrying capacity of a colony and not continue adding additional housing to the same area indefinitely. Providing high quality, relatively large, gourd style nest boxes is preferred to smaller T14 or cavity style housing. Situating a colony within optimal habitat of relatively low human development, with access to open water and a relatively high proportion of herbaceous wetland vegetation should be considered to maximise food availability for the foraging adults. However, some of the strongest predictors of fledging success in this study – number of eggs laid, the date of the first egg, and weather conditions – are outside the direct control of conservationists. Given the strong evidence that cool, wet conditions lower fledge rate, Purple Martin nest box managers might consider supplemental feeding protocols (Purple Martin Conservation Association 2025) during these times to limit nestling loss. Box-level modifications including provision of plugs to block extra ventilation holes and insulating nest material like pine needles could be considered to mitigate the direct effects of cold conditions on un-feathered nestlings. Given the unique human-association of the Purple Martin, conservation has a responsibility to provide housing which gives the best chance of breeding success for this regionally declining long-distance migrant.
Acknowledgements
We are grateful to the volunteers and staff at Iroquois National Wildlife Refuge who were involved in the data collection for this project.
Financial support
This research received no specific grant from any funding agency, commercial or not-for-profit sectors.
Competing interests
The authors declare none.







 Open access

