Introduction
With the continuous development of human society and technology, energy consumption is increasing. At the same time, the problem of energy shortage has emerged. Supercapacitors are a promising energy storage device developed in recent decades, which store charge by forming the double layer capacitance or generating the pseudocapacitance. Supercapacitors have attracted the interest of many researchers because of large capacity, high power density, wide operating temperature range, long cycle life, and green environmental protection [Reference El-Kady, Strong, Dubin and Kaner1, Reference Niu, Dong, Zhu, Li, Hng, Zhou, Chen and Xie2, Reference Merlet, Rotenberg, Madden, Taberna, Simon, Gogotsi and Salanne3]. For the electrode materials of supercapacitors, the most common is carbon materials, which play an important role in the application of supercapacitors. Among all the carbon materials, mesoporous carbon materials are regarded as good electrode materials because of their good electrical and thermal conductivity, large specific surface area, regular pore structure, narrow pore diameter distribution, and good chemical stability [Reference Bhattacharjya, Kim, Bae and Yu4, Reference Yin, Zhang, Zhao, Wang, Zhu and Wang5]. Therefore, it is of great significance to study mesoporous carbon materials with stable morphological structure and excellent performance.
With in-depth research, a large number of research results show that heteroatom doping (e.g., N, S, P, and B) [Reference Duan, Chen, Jaroniec and Qiao6, Reference Hasegawa, Deguchi, Kanamori, Kobayashi, Kageyama, Abe and Nakanishi7, Reference Wang, Zhang, Sun, Guo, Guo, Tang, Xue, Liu, Zhang, Zhu, Xie and He8, Reference Yuan, Zhou, Zhou, Zou, Mo and Xia9] is an effective way to improve the capacitance performance of carbon materials. When heteroatom is incorporated into carbon materials, the electronic structure and conductivity of carbon surface are changed, so that the mechanical properties and electronic properties are enhanced. The doping of heteroatom can not only improve the conductivity of carbon material but also enhance the wettability between the electrolyte and the electrode material, and introduce pseudocapacitance by the redox reaction of heteroatom. The introduction of pseudocapacitance can increase the specific capacitance of carbon materials [Reference Hou, Cao, Idrees and Ma10]. In addition, the synergistic effect of dual-heteroatom doping can further increase the capacitance of carbon materials, for example, N/S codoped porous carbon materials [Reference Li, Wang, Wei, Fan and Yan11, Reference Ito, Cong, Fujita, Tang and Chen12], N/P codoped carbon materials [Reference Wang, Sun, Zhou, Wan, Zhang and Qiu13], and N/B codoped graphene [Reference Wu, Winter, Chen, Sun, Turchanin, Feng and Mullen14]. These dual-heteroatom-doped carbon materials have shown enhanced capacitance behavior compared to single heteroatom doped. Therefore, many studies have focused on dual-heteroatom-doped carbon materials.
There are two main preparation methods for heteroatom-doped carbon materials: in situ doping and posttreatment doping. In situ doping is the direct doping of heteroatom in the process of synthesizing carbon materials. Posttreatment doping is the subsequent treatment of the synthesized carbon materials with the heteroatom-containing carbon precursor. In situ doping process is easy to control, so many heteroatom-doped carbon materials are prepared by this method. In our investigation, the heteroatom was introduced by using benzoxazine as carbon precursor. Benzoxazine, a new kind of high-performance phenolic resins, is known as the promising carbon precursor for the synthesis of nitrogen-rich carbon materials, owing to their own nitrogen content, high char yield, excellent thermal stability, and good molecular design flexibility [Reference Agag, Arza, Maurer and Ishida15, Reference Hao, Li, Qian, Wang, Zhang, Zhang, Wang, Schüth, Bongard and Lu16]. Due to the good molecular design flexibility, the content and the type of nitrogen functionalities in benzoxazine can be easily adjusted by changing the type or the proportion of primary amine. Furthermore, the incorporation of S/P/B or other heteroatom into carbon framework can be realized by using primary amine or phenolic compounds containing such heteroatom as raw materials for the synthesis of benzoxazine, which should be an attractive method for preparation of heteroatom-doped carbon materials. Unfortunately, the exploration on polybenzoxazines for heteroatom codoped carbon materials has seldom been reported in the literature so far [Reference Wan, Wang, Xie, Sun and Li17].
In this work, we have developed a novel strategy for synthesizing the heteroatom-doped carbon materials by using benzoxazine as carbon precursor and SBA-15 as hard template. And, we reported for the first time the synthesis of N/S codoped ordered mesoporous carbon materials using sulfur-containing benzoxazine as precursor. We investigated the effects of carbonization temperature on the structure of carbon materials. The micromorphology and heteroatom content of two different carbon materials were characterized and analyzed. The electrochemical properties of the N-doped and N/S codoped carbon materials were investigated. The two carbon materials have almost the same microscopic morphology and superior performance. However, due to the different types and contents of heteroatom, the properties of N/S codoped carbon materials are better than those of the N-doped carbon materials.
Results and discussion
Microstructure characterization
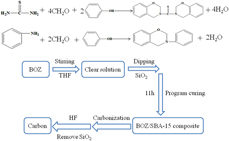
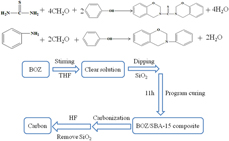
Nitrogen and sulfur heteroatoms are introduced into the carbon skeleton by in situ doping using benzoxazine as the carbon precursor and SBA-15 as the hard template. The preparation processes of materials are illustrated in Fig. 1. First, the thiourea-type benzoxazine and aniline-type benzoxazine were synthesized by solvent method. The as-obtained benzoxazine was dissolved in tetrahydrofuran (THF) and then impregnated with SBA-15. Finally, the carbon material was obtained by curing, carbonization, and etching.
The schematic illustration of the preparation process of NSCM and NCM.

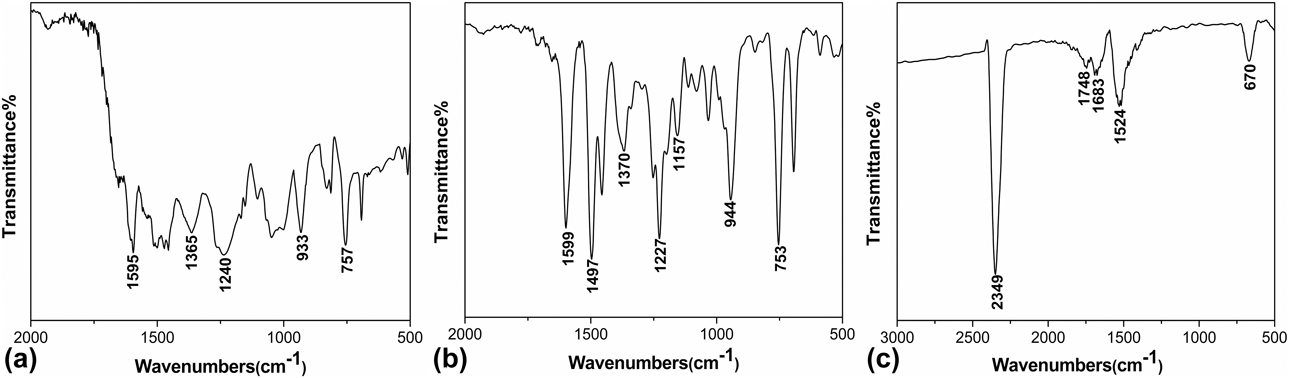
The structure of benzoxazine was characterized by FTIR. The FTIR spectrums of thiourea-type benzoxazine and aniline-type benzoxazine are presented in Fig. 2. As shown in Fig. 2(a), 757 cm−1 is the absorption peak of the outward bending vibration of the benzene ring C–H. The peak at 933 cm−1 is the characteristic absorption peak of the oxazine ring. 1240 cm−1 and 1365 cm−1 are the stretching vibration absorption peaks of the C–O–C and C–N–C bonds on the oxazine ring, respectively. 1595 cm−1 is the characteristic absorption peak of the benzene ring skeleton. The above characteristic peaks confirm the formation of benzoxazine.
The FITR of (a) thiourea-type benzoxazine, (b) aniline-type benzoxazin, and (c) NSCM-800.

According to Fig. 2(b), 753 cm−1 is the absorption peak of the outward bending vibration of the benzene ring C–H. 944 cm−1 is the characteristic absorption peak of the oxazine ring. 1157 cm−1 and 1227 cm−1 are the symmetric and asymmetric stretching vibration absorption peaks of the C–O–C bond on the oxazine ring, respectively. 1370 cm−1 is the stretching vibration absorption peak of C–N–C on the oxazine ring. 1497 and 1599 cm−1 are the characteristic absorption peaks of the benzene ring skeleton. According to the range of wave numbers that the characteristic peak appears, this structure is the target benzoxazine monomer.
Figure 2(c) is the FTIR spectrum of NSCM-800. The peak at 670 cm−1 indicates the presence of sulfur group [Reference Ai, Xie, Du, Zeng, Liu, Zhang, Huang, Huang and Yu18]. The absorption band at 1524 cm−1 is attributed to the C–N stretching vibration on the surface of the carbon structure. The 1683 cm−1 is the stretching vibration absorption peak of the C=C bond. The band at 1748 cm−1 corresponds to the C=O stretching vibration. The adsorption band at 2349 cm−1 is the characteristic peak of C≡N bond. The FTIR shows that N and S atoms are doped into the carbon materials.
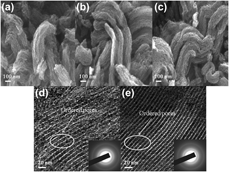
The morphology of carbon materials were characterized by scanning electron microscopy (SEM) and transmission electron microscopy (TEM). Figures 3(a)–3(e) are the SEM and TEM images of nitrogen/sulfur codoped carbon materials (NSCM) and nitrogen-doped carbon materials (NCM) samples. As can be seen from the SEM images, the samples show a worm-like structure that partially replicates the morphology and structure of template. Compared to the NSCM-700 and NSCM-900, the NSCM-800 has good dispersibility and homogeneity. The TEM images of samples show uniform stripe-like and hexagonally arranged structure, indicating that the samples have an ordered structure. This further proves that carbon materials have been successfully replicated from the template [Reference Liu, Yin, Wang, Zhang, Lun, Xiang, Qi and Gao19]. Compared to NSCM-800, the stripe arrangement of NCM-800 are more regular, indicating a better ordered structure. The selected area electron diffraction (SAED) patterns of NSCM-800 and NCM-800 are presented in the insets of Figs. 3(d) and 3(e), respectively, which indicate that the materials consist mainly of amorphous carbon [Reference Mateyshina, Ukhina, Brezhneva and Uvarov20]. Moreover, there is no significant difference between the SAED patterns of NSCM-800 and NCM-800, suggesting that the S atom is intercalated between the layers rather than into the crystal lattice [Reference Zhao, Zhang, Du, Liu, Zhou and Wang21].
SEM images of (a) NSCM-700, (b) NSCM-800, and (c) NSCM-900; TEM images; and SAED patterns (inset) of (d) NSCM-800 and (e) NCM-800.

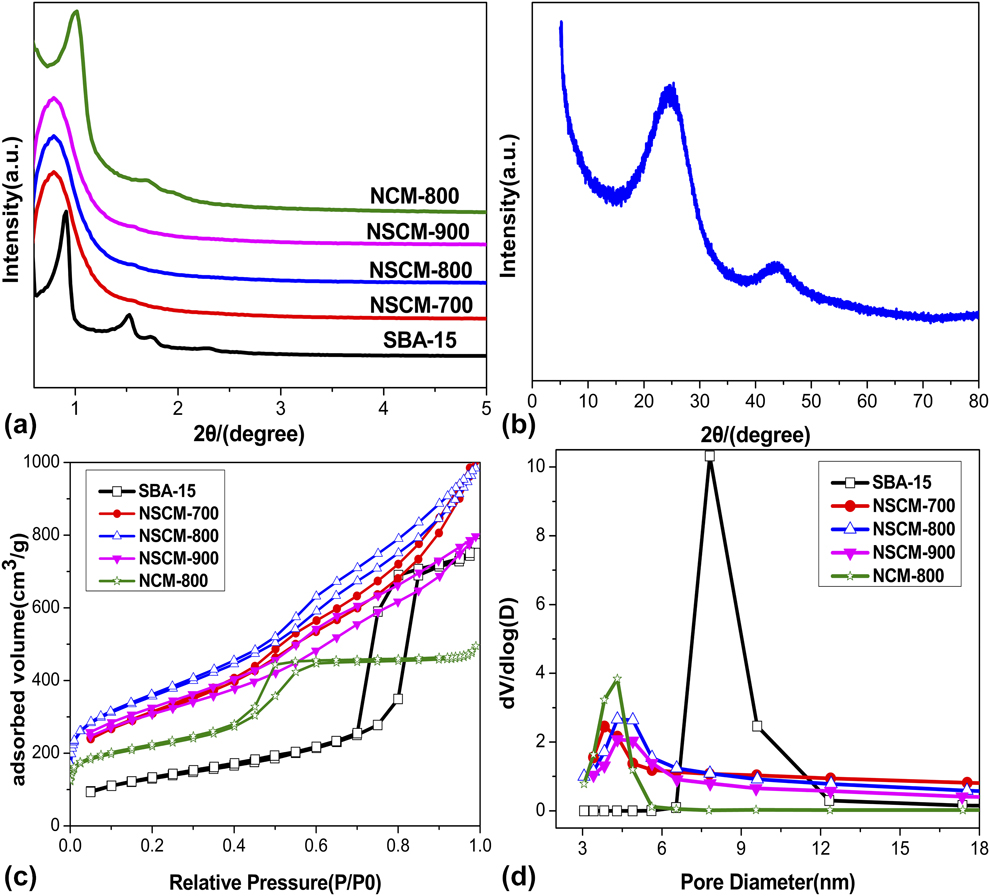
The order degree of carbon materials were also detected by small angle X-ray diffraction (XRD). Figure 4(a) shows the small angle XRD diffraction patterns of NCM-800, NSCM and SBA-15. The small angle XRD of SBA-15 exhibits three characteristic diffraction peaks, associated with (100), (110), and (200) reflections of hexagonal symmetry. These peaks show that SBA-15 has a good structural ordering [Reference Zhang, Hao, Zheng, Ma, Feng and Luo22]. Compared to the SBA-15 template, the (110) and (200) diffraction peaks of samples are not observed, but the (100) diffraction peak is very obvious, which indicates a decrease of the structural order in the materials after replication. Moreover, the peak intensity of NCM-800 sample is higher than those of the other three NSCM samples, suggesting a better structural ordering, which is consistent with the TEM test results. This may be due to the co-doping of nitrogen and sulfur atoms resulting in a decrease in the structure ordering of materials. The wide angle XRD pattern of NSCM-800 [Fig. 4(b)] exhibits two diffraction peaks, which can be observed at 2θ = 25 and 44°. These two diffraction peaks belong to the (002) and (100) planes of hexagonal carbon, respectively [Reference Zhao, Wang, Wu, Liu, Wang, Gao and Zhang23]. The wide angle XRD shows that these samples are graphitized and amorphous carbon structures, which can effectively improve the electrochemical properties of carbon materials. The SAED result also indicates the amorphous structure of the as-prepared carbon material.
(a) small angle XRD patterns of NCM-800, NSCM and SBA-15, (b) wide angle XRD patterns of NSCM-800, (c) Nitrogen adsorption–desorption isotherms, and (d) pore size distribution curves of NCM-800, NSCM, and SBA-15.

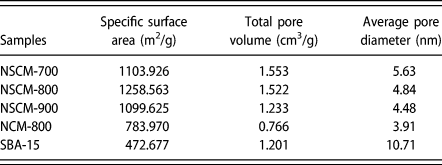
To further study the pore structure of samples, we used the nitrogen adsorption–desorption isotherms and pore size distribution curves to determine the specific surface area and pore structure of samples, as shown in Figs. 4(c) and 4(d). The specific surface area, average pore diameter and total pore volume of samples are listed in the Table I. According to the IUPAC classification, the nitrogen adsorption–desorption isotherm of SBA-15 exhibits a typical type IV curve with hysteresis loop (relative pressure, p/p 0 = 0.7–0.9), indicating its mesoporous structure. As can be seen from Fig. 4(c), the nitrogen adsorption–desorption isotherms of the three NSCM samples are nearly similar in shape, showing that the structures of samples are similar. The nitrogen adsorption–desorption isotherms of the resulting materials also exhibit typical type IV curves. At the same time, the nitrogen adsorption–desorption curves of NSCM have a significant hysteresis loop at the relative pressure p/p 0 = 0.4–1.0, and the curve of NCM-800 has a hysteresis loop at the relative pressure p/p 0 = 0.4–0.6, which proves that the as-prepared materials have a rich mesoporous structure [Reference Liang, Du, Gibson, Du and Qiao24].
The results of nitrogen adsorption and desorption measurements.

From Fig. 4(d) and Table I, the average pore diameter of the as-prepared samples is 3–6 nm, which is smaller than the corresponding values of SBA-15, further showing that the carbon materials have a mesoporous structure. Moreover, the carbon materials have narrow pore size distribution and uniform pore structure. As can be seen from Table I, NSCM-800 has the largest specific surface area, compared to NSCM-700 and NSCM-900. From the specific surface area and SEM image, it is known that 800 °C is a suitable carbonization temperature. From the BET isotherms, the specific surface areas of NSCM-800 and NCM-800 are 1258.56 m2/g and 783.97 m2/g, respectively, which is much larger than SBA-15 (472.677 m2/g). The pore volumes of NSCM-800 and NCM-800 are 1.522 cm3/g and 0.766 cm3/g, respectively (Table I). The specific surface area and pore volume of NSCM-800 are higher than NCM-800. The large specific surface area is beneficial to the charge accumulation at the electrode/electrolyte interface. The mesoporous structure can act as an ion transport channel, allowing electrolyte ions to quickly enter the electrode.
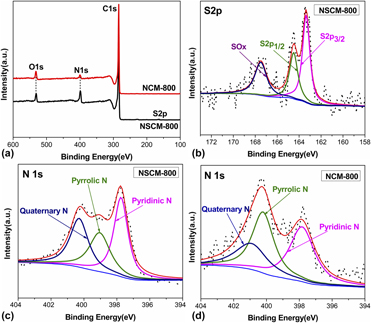
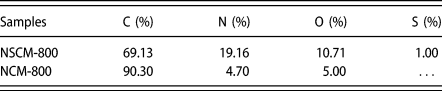
In order to study the elemental composition and state of N-doped and N/S codoped carbon materials with benzoxazine as carbon precursor, NSCM-800 and NCM-800 were characterized by X-ray photoelectron spectroscope (XPS). As shown in Fig. 5(a), in the XPS survey spectrum of NSCM-800 and NCM-800, there are a weak peak and three distinct peaks at 164.7 eV, 284.2 eV, 531.32 eV, and 399.3 eV, corresponding to S 2p, C 1s, O 1s, and N 1s, respectively. Table II is the element content of NSCM-800 and NCM-800 samples. Although the sulfur content of NSCM-800 is 1%, it can effectively improve the capacitance performance. Figure 5(b) is the high-resolution S 2p spectrum of NSCM-800. There are three S 2p characteristic peaks: the S 2p 3/2 (163.4 eV) and S 2p 1/2 (164.5 eV) of the C–S bond of the thiophene-like sulfur, and the C–SOx–C bond (167.5 eV) [Reference Li, Zhou, Li, Wang, Cheng and Jiang25]. The spin orbit of the thiophene-S is incorporated into the crystal structure of carbon. It is easy to occupy the defective sites of carbon structure. The introduction of the S element can be an effective way to inhibit pore shrinkage to provide the rapid ion transport and reversible pseudo active point, thus enhancing the capacitive properties of carbon materials [Reference Qie, Chen, Xiong, Hu, Zou, Hu and Huang26, Reference Zhao, Zhang, Chen, Zhang, Reiche, Wang, Zhang, Schlogl and Su27, Reference Zhang, Han, Wang, Li, Lei, Wang, Wang, Zhang and Feng28].
(a) XPS spectrum of NSCM-800 and NCM-800, (b) High-resolution S 2p XPS spectrum of NSCM-800, (c) High-resolution N 1s XPS spectrum of NSCM-800, and (d) High-resolution N 1s XPS spectrum of NCM-800.

The element content of NSCM-800 and NCM-800 samples.

The high-resolution N 1s peaks [Fig. 5(c)] of NSCM-800 can be divided into three different functional groups, corresponding to pyridinic N (397.8 eV), pyrrolic N (399.1 eV), and quaternary N (400.3 eV). The nitrogen content of NSCM-800 is 19.16%. Figure 5(d) is the high-resolution N 1s peaks of NCM-800. It can be observed the three nitrogen functional groups doped in the carbon atom lattice: pyridinic N (397.9 eV), pyrrolic N (400.2 eV), and quaternary N (400.9 eV) [Reference Chen, Zhang, Liang, Kong, Guan, Chen, Hu and Yu29]. The nitrogen content of NCM-800 is 4.7%, which is lower than NSCM-800. The pyridinic-N and pyrrolic-N existing in the edge of carbon are considered to be electrochemically active and can produce many active sites to provide pseudocapacitance by reversible redox reactions. They can also promote the p-conjugated system with a pair of p-electrons in the graphene layers, which contributes to improve the capacitance performance. In addition, the quaternary-N is incorporated into the carbon matrix and replaces the carbon atoms in the plane of the graphene, which facilitates electron transfer and enhances the conductivity of carbon materials [Reference Lu, Zhang, Zhang, Leng, Zhang, Yang, Ma, Huang, Zhang and Chen30, Reference Wu, Zhang, Wang and Hou31, Reference Song, Zhao, Wang, Mullavey, Zhu, Geng, Chen, Ding, Moon, Liu and Wong32, Reference Song, Choi, Zhu, Geng, Zhang, Lin, Tuan, Moon and Wong33, Reference Li, Wu, Zhao, Miao, Xing, Zhou, Zhao and Zhuo34]. The XPS analysis results prove that N and S atoms have been successfully doped into the carbon skeleton. The codoping of N and S atoms may lead to an asymmetric distribution of charge density and can produce a large number of active sites, which is beneficial to improve the capacitance of carbon materials [Reference Zhou, Paek, Hwang and Manthiram35, Reference Cui, Wang, Zhang and Cao36].
Electrochemical performance
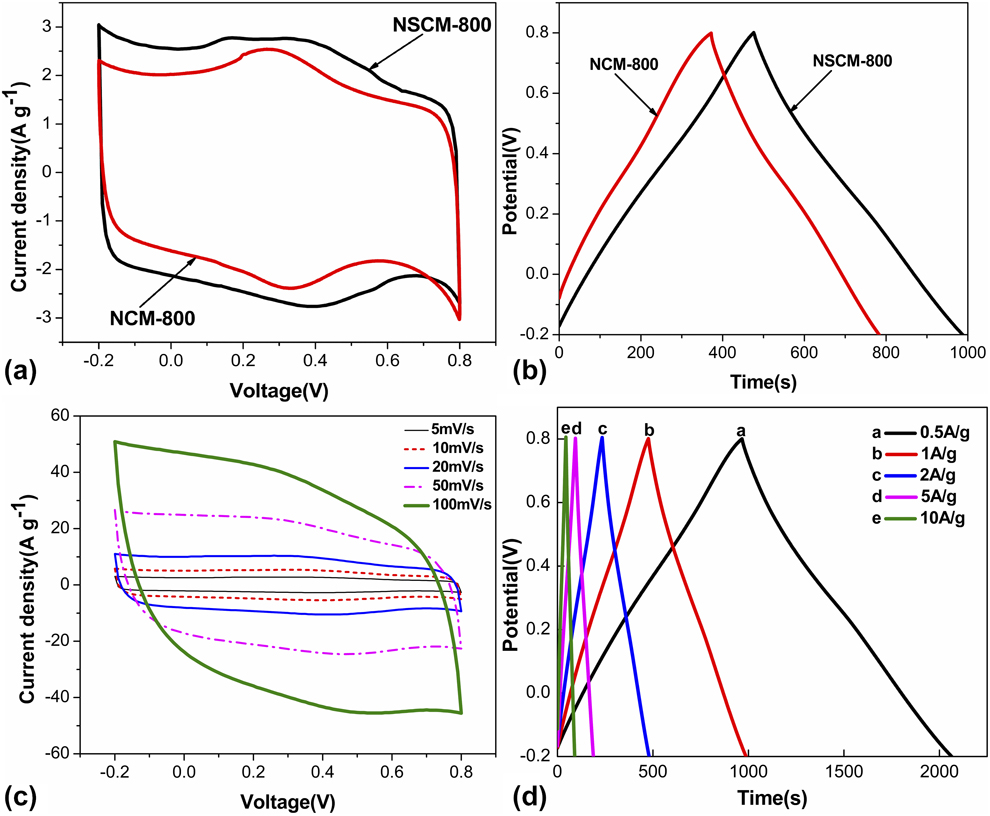
The electrochemical performance of NCM-800 and NSCM was tested by Cyclic voltammetry (CV) and GCD using a three electrode system in 0.5 mol H2SO4 electrolyte. Figure 6(a) is the CV curves of NCM-800 and NSCM-800 at the scan rate of 5 mV/s. The CV curves of the two samples are rectangular-like shapes with the redox peaks, indicating that the energy storage mechanism of the electrode is double layer capacitance and pseudocapacitance characteristics. The pseudocapacitance is caused by the redox reaction of heteroatom [Reference Candelaria, Garcia, Liu and Cao37, Reference Lee, Chang and Hu38]. In addition, the NSCM-800 has a larger area than NCM-800 at the same scan rate, which shows that the NSCM-800 has a higher capacitance.
(a) CV curves of NCM-800 and NSCM at the scan rate of 5 mV/s, (b) GCD curves of NCM-800 and NSCM at the current density of 1 A/g, (c) CV curves of NSCM-800 at the different scan rates, and (d) GCD curves of NSCM-800 at the different current densities.

The GCD method is commonly used to further evaluate the specific capacitance of supercapacitor electrode materials. Figure 6(b) is the GCD curves of NCM-800 and NSCM-800 at the current density of 1 A/g. The GCD curves of the two samples are very close to the isosceles triangle. The charging curve and the discharge curve have a slight curvature, which further indicates that the energy storage mechanism of carbon electrode material is mainly the double-layer capacitance, supplemented by pseudocapacitance. From Fig. 6(b), the GCD curve of NSCM-800 indicates the longer discharge time than NCM-800, demonstrating that the NSCM-800 has the higher specific capacitance, which may be due to the codoping of N and S atoms. The GCD test results is consistent with the CV.
Figure 6(c) is the CV curves of NSCM-800 at the different scan rates ranging from 5 to 100 mV/s. The CV curves of near rectangular show the ideal behavior of the electric double layer capacitor, which is achieved by reversible adsorption/desorption of free ions on the electrode surface of carbon materials. As the scan rate increases, the CV curves can still remain a rectangular shape. This shows that the NSCM-800 sample can be rapidly charged and discharged in the electrolyte solution as an electrode material, and has a high capacitance [Reference Wen, Wang, Mao, Bo, Kim, Cui, Lu, Feng and Chen39]. Figure 6(d) is the GCD curves of NSCM-800 sample at the different current density ranging from 0.5 to 10 A/g. At low current densities, the electrode material exhibits a mixed capacitance behavior of the double layer capacitance and pseudocapacitance. Due to the presence of pseudocapacitance, the GCD curve slightly deviates from the isosceles triangle. At high current densities, the pseudocapacitance gradually disappears, so the GCD curves of sample can maintain the shape of an isosceles triangle well, showing that the NSCM-800 has a good performance.
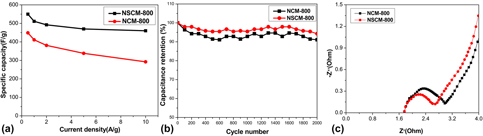
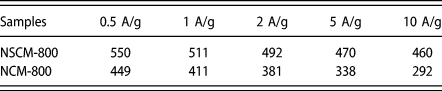
The rate performance is an important parameter for evaluating supercapacitor electrode materials. From Fig. 7(a) and Table III, the specific capacitances of samples decreases with the increasing current density. It is mainly because the relatively high current density provides short time for the electrolyte to diffuse sufficiently into the pore structure, resulting in a low specific capacitance. The NSCM-800 has the specific capacitance of 550 F/g at the current density of 0.5 A/g, which is higher than NCM-800. Moreover, the NSCM-800 still has the high specific capacitance of 460 F/g at the current density of 10 A/g, and the capacitance retention rate is 83.6%, which suggests that the NSCM-800 has a good rate capability. The excellent rate performance is mainly because the nitrogen and sulfur doping not only enhance the hydrophilic property of carbon material but also reduce the ion diffusion resistance.
(a) Specific capacitance of NCM-800 and NSCM at the different current densities, (b) cycle stability of NCM-800 and NSCM-800 after 2000 cycles at the current density of 5 A/g, and (c) EIS of NCM-800 and NSCM-800.

Specific capacitance (F/g) values of NSCM-800 and NCM-800 samples at different current densities.

Cyclic characteristics are another factor to consider in the practical application of supercapacitor electrode materials. Figure 7(b) study the cycling stability of NCM-800 and NSCM-800 samples. At the current density of 5 A/g, the specific capacitance values of NCM-800 and NSCM-800 are 442 F/g and 308 F/g after 2000 cycles of charge and discharge, which the capacitance retention ratios are 91% and 94%, respectively. This shows that the electrode has good cycle stability, which is related to the inherent structural and chemical stability of carbon materials [Reference Ma, Ning, Kan, Ma, Qi, Chen, Li, Lan and Gao40]. The good cycle stability and rate performance indicate that the as-prepared carbon materials have a good application prospect in supercapacitors.
Figure 7(c) is the impedance plot for NCM-800 and NSCM-800 in the frequency range of 10−2 to 105 Hz, which consists of a semicircle in the high frequency region and a straight line in the low frequency region. The diameter of the semicircle represents the charge transfer resistance (R ct) [Reference Gopalsamy, Balamurugan, Thanh, Kim and Lee41]. The R ct values obtained for NCM-800 and NSCM-800 from the Nyquist plots are found to be 1.2 and 0.9 Ω, respectively. Evidently, NSCM-800 shows a smaller semicircle than NCM-800, indicating that NSCM-800 has the lower charge transfer resistance. This lower resistance is attributed to the increase in carbon surface polarity caused by N/S codoping. Compared with NCM-800, NSCM-800 shows a larger linear slope in the low frequency region, indicating that NSCM-800 has better electrochemical performance, which is consistent with the CV and GCD test results.
Conclusion
The N-doped and N/S codoped carbon materials have been synthesized by using benzoxazine as carbon precursor and SBA-15 as hard template. The as-prepared carbon materials have ordered mesoporous structure, large surface area, and excellent electrochemical performance. The NSCM-800 has the higher specific capacitance of 550 F/g than NCM-800 in 0.5 M H2SO4 electrolyte at the current density of 0.5 A/g. Moreover, its specific capacitance can still retain 460 F/g at the current density of 10 A/g with a capacitance retention ratio of 83.6%. Meanwhile, the NSCM-800 sample also exhibits an extraordinary cycling stability with 94% capacitance retention after 2000 times cycles at the current density of 5 A/g. The excellent performance suggests that it is a simple and effective method to prepare heteroatom-doped ordered mesoporous carbon materials with heteroatom-containing benzoxazine as precursor.
Experimental
Synthesis of thiourea-benzoxazine
Thiourea (0.2 mol), formaldehyde solution (0.8 mol), and toluene (50 mL) were added into a 250-mL three-necked round bottom flask equipped with a thermometer, a mechanical stirrer, and a reflux condenser and stirred for 30 min at 40 °C. Then, 0.4 mol of phenol with 50 mL of toluene was added into the flask using the constant pressure dropping funnel. The solution was heated to 110 °C for 5 h and the solvent was removed by reduced pressure distillation. The mixture was dissolved in anhydrous ether and washed several times with sodium hydroxide solutions, and then washed with distilled water until neutral. The ether was removed by reduced pressure distillation. The product was dried at 60 °C in a vacuum oven for 24 h.
Synthesis of aniline-benzoxazine
According to the literature method [Reference Zhang, Deng, Zhang, Yang and Gu42], aniline-benzoxazine was synthesized by solvent method using phenol, aniline, and formaldehyde solutions as raw materials. Aniline (0.2 mol), phenol (0.2 mol), and formaldehyde solution (0.4 mol) were dissolved in toluene and refluxed at 110 °C for 6 h. The solvent of toluene was removed by reduced pressure distillation. The mixture was dissolved in anhydrous ether and washed several times with sodium hydroxide solutions, and then washed with distilled water until neutral. The ether was removed by reduced pressure distillation and the product was dried at 60 °C for 24 h.
Preparation of carbon materials
The heteroatom-doped carbon materials were synthesized by using SBA-15 as hard template and BOZ as carbon precursor. In a typical synthesis, BOZ was added into tetrahydrofuran (THF), and stirred to obtain a clear solution. Then, SBA-15 was added into above solution, and the mixture was sonicated for 6 h to acquire the BOZ/SBA-15 composite. The composite was dried at 60 °C in a vacuum oven for 24 h and programmed to cure for 11 h. Then, the thiourea-BOZ/SBA-15 composite was carbonized at 400 °C for 2 h and at desired temperature (700–900 °C) for 2 h with a heating rate of 1 °C/min under nitrogen atmosphere. And the aniline-BOZ/SBA-15 composite was carbonized at 400 °C for 2 h and at 800 °C for 2 h with a heating rate of 1 °C/min under nitrogen atmosphere. The obtained carbon materials were etched with hydrofluoric acid aqueous solution for 24 h at room temperature to remove the SBA-15 template. Finally, the sample was washed with distilled water until neutral and dried at 60 °C overnight. The as-obtained samples are denoted as NCM-800, NSCM-700, NSCM-800, and NSCM-900.
Characterizations
The morphology of the as-obtained carbon materials was characterized by scanning electron microscopy [SEM; JSM-7500F, Electronics Co., Ltd. (JEOL), Akishima, Japan] and transmission electron microscopy (TEM; FEI TalosF200S, FEI Corporation, Hillsboro, Oregon). The elemental composition and state of samples were detected by X-ray photoelectron spectroscope (XPS; AXIS Supra, Shimadzu Corporation Management, Co., Ltd., Beijing, China). The X-ray diffraction (XRD) of samples was taken on a X’Pert PRO X-ray diffractometer (PANalytical B.V., Eindhoven, Netherlands) using Cu Kα radiation. The specific surface area and pore size distributions were determined from the nitrogen adsorption–desorption isotherms using a Quantachrome Autosorb-iQ analyzer (Quantachrome Instrument Company, Boynton Beach, Florida). The specific surface area was calculated according to the Brunauer–Emmett–Teller (BET) method. The total pore volume was determined by the amount of adsorption with a relative pressure (p/p 0) of 0.99, and the pore size distribution was determined using the Barrett–Joyner–Halenda (BJH) way.
Electrochemical measurement
The electrochemical performance of samples was tested using a three-electrode system. The glassy carbon electrode coated with the sample was the working electrode. The saturated calomel electrode was a reference electrode and the platinum electrode was a counter electrode. The working electrode was prepared by mixing 80 wt% of as-obtained carbon materials, 10 wt% of conductive agent (acetylene black), and 10 wt% of poly(tetrafluoroethylene) (PTFE) binder in ethanol. CV and galvanostatic charge–discharge (GCD) were tested in 0.5 mol H2SO4 electrolyte. All of the electrochemical measurements were performed at room temperature using the electrochemical workstation (CHI660E, Shanghai Chenhua Instrument Co., Ltd., Shanghai, China). The specific capacitance of the electrode was calculated from the galvanostatic discharge process according to the following equation:
 $$C = {{I \times \Delta t} \over {m \times \Delta V}}\quad ,$$
where C (F/g) is the specific capacitance of the active material, I (A) is the discharge current, Δt (s) is the discharge time, ΔV (V) is the potential charge during discharge, and m (g) is the mass of the active material loaded in the working electrode.
Acknowledgments
This work was supported by the National Natural Science Foundation of China (Grant No. 51703205).