

According to Bourdieu, capital is “accumulated labor (in its materialized form or its ‘incorporated,’ embodied form) which, when appropriated on a private, i.e., exclusive, basis by agents or groups of agents, enables them to appropriate social energy in the form of reified or living labor” (Reference Bourdieu and Richardson1986, 46). As a source, the existence of capital comprises “the set of constraints, inscribed in the very reality of that world, which govern its functioning in a durable way, determining the chances of success for practices” (Tittenbrun Reference Tittenbrun2016, 82).
Bourdieu’s theory argues that capital can present itself in three fundamental forms or species:
as economic capital, which is immediately and directly convertible into money and may be institutionalized in the forms of property rights; as cultural capital, which is convertible, on certain conditions, into economic capital and may be institutionalized in the form of educational qualifications; and as social capital, made up of social obligations (“connections”), which is convertible, in certain conditions, into economic capital and may be institutionalized in the form of a title of nobility. (Bourdieu Reference Bourdieu and Richardson1986, 47)
Bourdieu argues that the form in which capital can present itself depends on the field in which it functions (type of relation) and its efficacy (the costs and benefits of using it) in the field in question (Bourdieu Reference Bourdieu and Richardson1986, 47).
Individuals often use species of capital to maintain certain positions of privilege in society. This condition is also related to the logic of reproduction of power in a society, since power is a cultural and symbolically created phenomenon, subject to a process of constant legitimization through an interplay of agency and structure (Bourdieu Reference Bourdieu and Richardson1986). Although political sociologists have acknowledged the importance of certain species of capital (cultural, social, and political) in the creation and access to relevant positions in the elites (Bourdieu Reference Bourdieu and Richardson1986; Bottomore Reference Bottomore2006; Camp Reference Camp2013; Garrido-Vergara Reference Garrido-Vergara2013; Genieys 2005; Gilens and Page Reference Gilens and Page2014; Joignant Reference Joignant, Joignant and Güell2011, Reference Joignant2014; Portes Reference Portes1998; Siavelis and Morgenstern Reference Siavelis and Morgenstern2012), the differentiated effects of those capitals on the access of certain individuals to relevant and strategic positions in the political field has rarely been studied directly. Accordingly, the principal assumption of this research is that some specific types of capital (political, social, and cultural) constitute a form of power whose possession has differentiated effects, positive or negative, for accessing certain key positions in the political system.
This is particularly relevant in the case of Chile, where, after the political transition, there was a reordering of the party system and therefore the political elite. Pinochet’s defeat in the 1988 plebiscite produced a historic change in the distribution of political power in Chile. With the withdrawal of the armed forces, control of political power passed to two coalitions: the Concertación and the Alianza por Chile, which gradually developed a model of political management based on a quest for consensus and pacts, or strategic agreements on certain matters (Navia Reference Navia2003; Siavelis Reference Siavelis2009).
As ruling elites, the Concertación and the Alianza remained mostly unchanged, fairly closed, and insufficiently porous until 2013, when the Concertación came to an end. (This coalition was replaced by the New Majority coalition in 2013, and the Alianza was replaced by Chile Vamos in 2015.) Studies of the political elites in post Pinochet Chile have argued that most of their members elected to Congress not only had a similar social origin, but were also part of social networks through which they interacted frequently, allowing them to narrow their ideological differences and become more compact and effective at keeping outsiders and newcomers out of the political system (Cordero Reference Cordero2006; González-Bustamante 2013).
Using datasets for members of the Chilean political elite in the period 1990— 2010, this country note examines the differentiated effect of political, social, and cultural capital on the access of certain individuals to strategic positions in the political field, comparing the legislative and executive branches, as represented by deputies and ministers, between 1990 and 2010.
Hypotheses and Techniques of Analysis
This study begins with a descriptive analysis of the sample of 386 members of Chile’s political elite. This is followed by a logistic regression analysis (logit models) to measure and compare the effect of the different forms of capital on ministers and deputies. The analysis comprises six models, considering individuals who served as ministers or deputies in three different periods: 1990—2010, 1990—2000, and 2000—2010.
The decision to divide the longer period into two decades implies distinguishing between two rather different periods: a conservative decade characterized by the transition and the Christian Democratic governments of Patricio Aylwin (1990—94) and Eduardo Frei (1994—2000) and the more liberal decade of the Socialist governments of Ricardo Lagos (2000—2006) and Michelle Bachelet (2006—10). This criterion has also been used in recent studies of ministers in Chile (González-Bustamante and Olivares 2016).
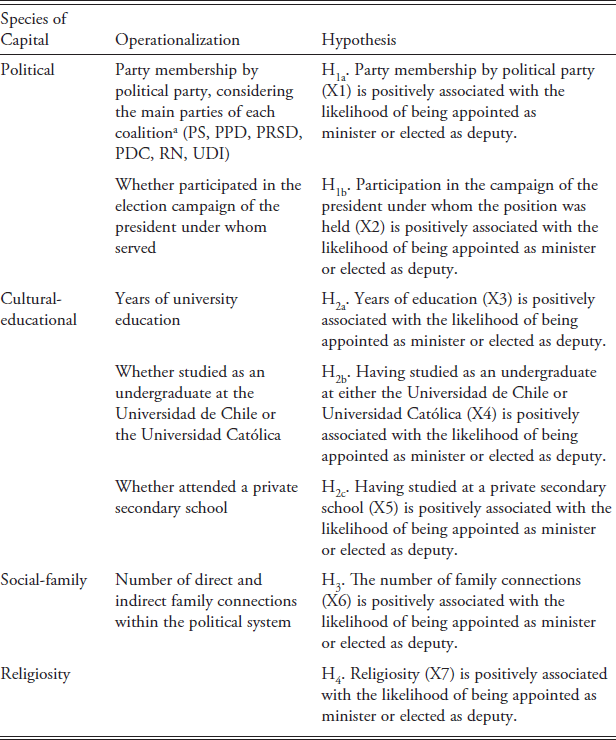
The variables used to measure the differentiated effect of the species of capital on the appointment of ministers and the election of deputies are classified into three dimensions. The first corresponds to the cultural-educational species and contains three variables: years of university education, whether the person studied as an undergraduate at the Universidad de Chile or the Universidad Católica, and whether the person attended a private school for secondary education. This species of capital is relevant for political recruitment, as the literature shows (Ashraf Reference Ashraf2017; Siavelis and Morgenstern Reference Siavelis and Morgenstern2012).
The second dimension corresponds to political capital, as reflected in party membership and participation in the election campaign of the president under whom the position was held (Samuels and Shugart Reference Samuels and Shugart2010). The third dimension corresponds to the social-family species of capital, defined as the number of direct and indirect family connections a person has within the political system (Querubin Reference Querubin2016). Religiosity is also considered in this dimension, due to its remaining influence on political identity in Chile and as a social resource in the conformation of social networks (Thumala Reference Thumala2010; Valenzuela et al. Reference Valenzuela, Scully and Somma2007). These dimensions and variables are shown in table 1. Age and gender are considered as control variables.
Species of Capital, Operationalization, and Hypotheses

a Last party to which the individual belonged.
Data Used in the Study
The data for the study were taken from the Survey of Elites in Chile (1990—2010), whose sampling procedure is of a nonprobabilistic nature. This survey was funded by Project 1100877 of Chile’s National Fund for Scientific and Technological Development (FONDECYT, Alfredo Joignant, Lead Researcher). The work was undertaken between 2010 and 2012. Between 1990 and 2010, a total of 1,465 individuals occupied relevant positions in politics in Chile. These are people who, for at least six months, held one of the following positions:
President of Chile
Minister
Undersecretary
Head of a government division
Chief of staff
Director of certain public services and agencies, such as the Central Bank, superintendencies, and some state companies
Deputy
Senator
Member of the governing body of a political party
Out of this universe, a preliminary sample of 590 cases, the so-called nucleus of the elite, was selected according to specific criteria, as follows:
All the country’s presidents
All ministers
All undersecretaries
All deputies who served for two or more terms
All senators who served for two or more terms
All deputies and senators who served for one term in each house
All presidents of the political parties represented in Congress during the period
All members of the governing body of the political parties represented in Congress during the period who held that position for at least three years
All heads of a government division who held the position for more than one presidential term
All presidents or managers of certain state companies
All heads of the government’s budget office
A combination of two or more of these criteria
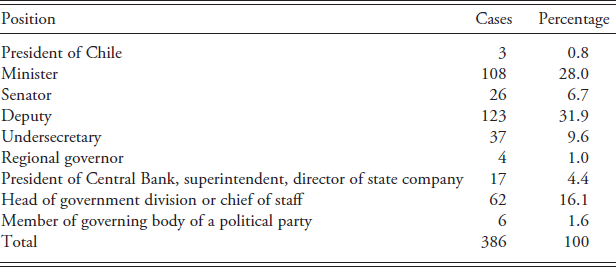
They were asked to answer a questionnaire about matters that included their political career, personal history, and perceptions. Table 2 shows the responses. The 386 replies received represented a response rate of 65.4 percent (or 68.3 percent if those no longer alive when the survey was applied are excluded). Each individual was classified according to the highest position held during his or her career. The positions that predominate in the sample are deputy and minister (123 and 108, respectively, which represents almost 60 percent of the cases). Regional governors and political party leaders account for only 1 percent and 1.6 percent, respectively. Three of the four presidents of Chile during the period studied answered the survey.
Composition of the Nucleus of the Elite in Chile

N = 386
Results: Descriptive Analysis of Sample
In general terms, the nucleus of the Chilean political elite shares certain characteristics in matters like religion, academic background, and family connections. The oldest members of the nucleus were born in 1918 and the youngest in 1978, while most were born between 1943 and 1958 (the mean is 1952 and the mode is 1953). Table 1 of the appendix shows members of Congress, the government, and the governing bodies of political parties by gender. According to both the original sample (386 cases) and a later sample (432 cases, considering that some individuals were appointed to more than one position between 1990 and 2010), men account for a majority of the political elite. In government positions, however, it is possible to observe a growing trend toward the incorporation of women. These descriptive results coincide with those of other research on Chile’s parliamentary elite (Cordero Reference Cordero2006) and governmental elite (González-Bustamante 2013, 137).
The president who appointed the fewest women to senior government positions was Patricio Aylwin (only 1), while Michelle Bachelet appointed the most (30). Between 1990 and 2010, more than 80 percent of the members of Congress were men, while women accounted for less than 9 percent of the sample. Another indicator of the homogeneity and concentration of the Chilean political elite is the municipal district where its members’ principal residences are located. Most of the nucleus of the elite lives in the Santiago Metropolitan Region and, within this, principally in four districts, where per capita income is among the highest in the country: Providencia, Las Condes, Ñuñoa, and Vitacura (almost 45 percent). Outside Santiago, Viña del Mar, Temuco, Valparaíso, Concepción, Talca, and Puerto Montt appear on the list, but together account for less than 4 percent of mentions.
Almost 60 percent of the members of the political elite identify themselves as Catholic, compared to some 30 percent who profess no religion. Catholicism has historically been influential among Latin American elites, and Chile is no exception. A historical bond between the elite and its religious tradition continued to exist after the political transition with the practice of more conservative forms of Catholicism (Thumala Reference Thumala2010).
The influence of Catholicism is also apparent in the education of the elite’s children. Indeed, the fact that most politicians identify themselves as Catholic could also be explained by their schooling, since more than 40 percent studied at private religious schools. Although many politicians attended prestigious state schools, such as the Instituto Nacional General José Miguel Carrera (henceforth, Instituto Nacional), the Liceo de Aplicación, and the Internado Nacional Barros Arana, most of their children studied, or are studying, at private schools (see appendix, table 2). Among these, Saint George’s (a religious school) receives most mentions for all groups of children, followed by San Ignacio in all groups except the fourth son or daughter. Other schools with a large number of mentions are Padres Franceses
(Sagrados Corazones), Colegio Alemán, Alianza Francesa, La Girouette, San Juan Evangelista, and Villa María Academy (the last is a Catholic girls’ school).
Most members of the nucleus of the political elite hold undergraduate and postgraduate degrees: 32.6 percent hold an undergraduate degree, 19.9 percent a master’s degree, and 11.7 percent a doctorate. Taking into account incomplete studies, less than 4 percent did not go to university. In other words, Chile’s political elite is not only concentrated but also highly educated (González-Bustamante 2013, 138).
In addition, more than 40 percent of the sample’s fathers hold undergraduate degrees, compared to 13 percent who only completed their primary education (see appendix, table 3). The most common undergraduate degrees are law (12.4 percent), engineering (6.5 percent), and medicine (5.4 percent). A majority of the sample’s mothers completed their secondary education (51.8 percent), and 15.5 percent hold an undergraduate degree, while 12 percent completed only their primary education. The mothers’ main occupation is housewife, followed by teacher (11.4 percent) and public employee (3.9 percent; see appendix, table 4).
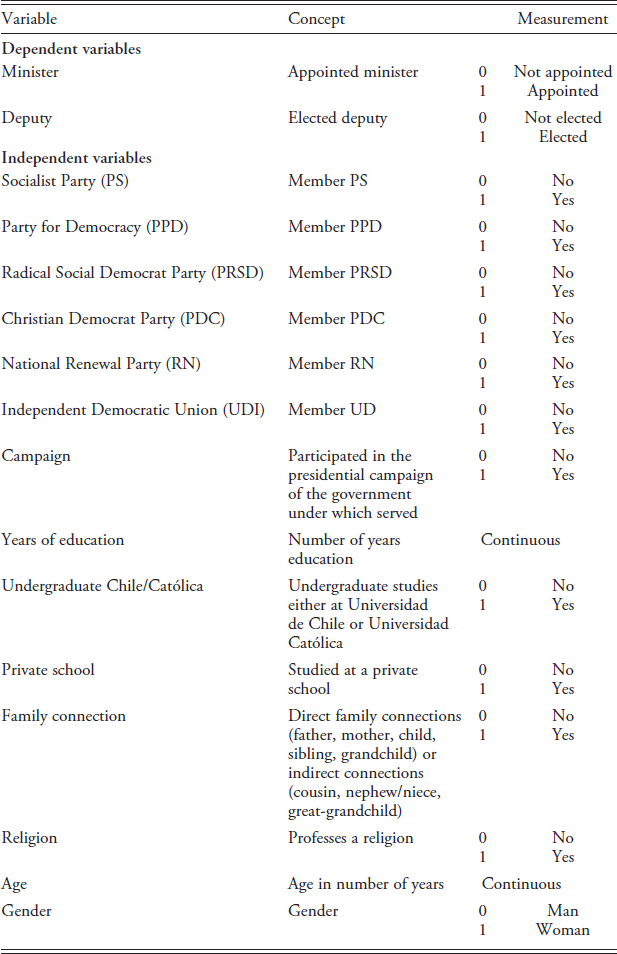
Values for Binary Logistic Regressions (logit models)

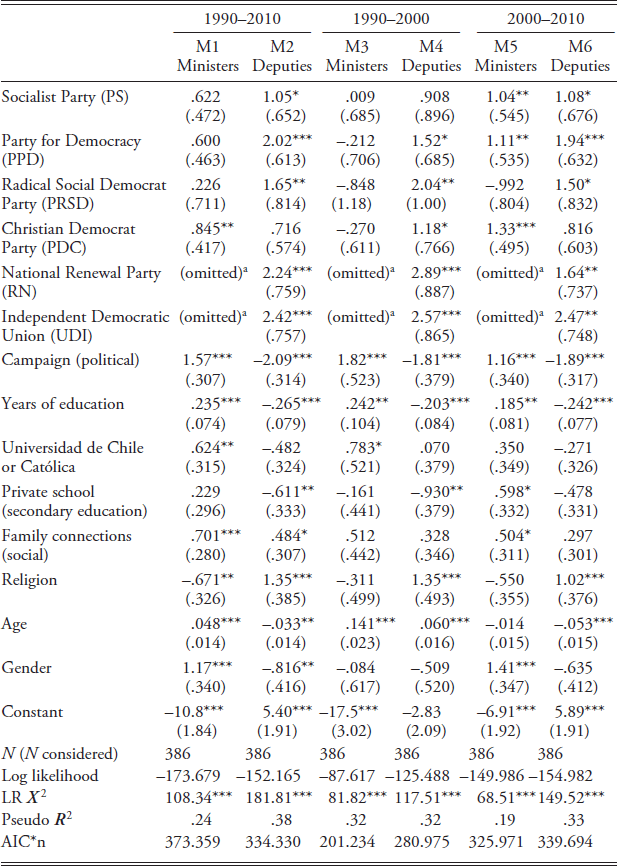
Binary Logistic Regressions for Appointment of Ministers and Deputies, 1990—2010

*p < 0.1; **p < 0.05; ***p < 0.01 Standard errors in parentheses.
a Variables omitted because, as these parties were in opposition, their members could not be appointed as ministers.
With regard to the university attended for undergraduate studies, those most frequently mentioned are the Universidad de Chile and the Universidad Católica, with 44.3 percent and 17.9 percent, respectively. The Universidad de Chile is secular and public; the Universidad Católica is Catholic and private. Given that most members of the nucleus of the elite attended private religious schools and define themselves as Catholic, it is striking that, for their undergraduate studies, so many preferred a secular public university. Indeed, 20 former presidents of Chile studied at the Universidad de Chile, including three of the four presidents between 1990 and 2010 (Frei, Lagos, and Bachelet). Only Aylwin attended the Universidad Católica.
In the case of postgraduate studies, almost 42 percent of the members of the nucleus of the political elite studied in Chile and 24 percent in the United States. Importantly, a high proportion of those with doctorates studied in the United States (16), Spain (6), or Germany (5), while for master’s degrees, most preferred Chile (41), the United States (30), or Spain (10). Most members of the sample who studied in the United States obtained either a master’s degree (30) or a doctorate (16), while in the case of those who studied in Chile, most either obtained a master’s degree (41) or took a less demanding graduate program, such as a diploma or executive program (37) (see appendix, table 5).
For the field of postgraduate studies, almost 27 percent of the sample opted for economics, which is consistent with the growing role that this discipline has acquired in recent decades in managing the state. Most of those who studied postgraduate economics did so in the United States (22) or Chile (17). This is the only discipline in which Chile does not have the largest number of mentions (see appendix, table 6).
Measurement and Comparison
The analysis in this study includes a set of binary logistic regressions to measure the differentiated effect of certain forms of capital on the appointment of two relevant positions in the political system: minister and deputy. The positions of minister and deputy were chosen because they were the most common ones in the sample (108 ministers and 123 deputies). Other positions were not considered due to sample size.
A limitation of this analysis is that the sample does not include the counterfactuals for each subsample. In other words, it does not include all those individuals who could have been considered to serve as minister or deputy. However, the use of regression models is also appropriate when there are comparison groups (Allison Reference Allison1999; Kuha and Mills Reference Kuha and Mills2018; Williams Reference Williams2009), and in this context, the analysis focuses on comparing the effects of specific forms of capital, considering the political elite and its access to two important positions related to executive and legislative power.
The hypotheses for this analysis are derived from three forms of capital: cultural-educational, political, and social-family (table 1). Each hypothesis indicates that each of these species of capital (X1, X2, X3, X4, X5, X6, X7) is positively associated with the likelihood of being appointed a minister or elected a deputy (Y). After carrying out different tests with numerous variables and considering indicators of the models’ fit, reliability, and multicollinearity, eight variables were included in the logistic regression models, as indicated in table 3.
In all models, the dependent variable is dichotomous and defined according to appointment either as a minister or election as a deputy. In the case of deputies, it is important to note that they are assumed to be those individuals who were nominated as candidates and won the election. For each position, the dependent variable takes a value of 1 or 0 according to whether the politician did or did not obtain the position, respectively. Most of the independent variables are dichotomous, except in the case of years of education, which is continuous.
The analysis includes six models considering the individuals who became ministers or deputies for the three different periods: 1990—2010, 1990—2000, and 2000— 2010. Between 1990 and 2000, 40 people were ministers and 71 were deputies, whereas between 2000 and 2010, 71 were ministers and 109 were deputies. It is important to note that some repetitions occurred between the two periods.
Party membership and variables related to electoral performance were not included in this analysis. In the case of party membership, this was due to the sample’s high level of homogeneity with respect to this variable; as for electoral performance, the study’s objective is to analyze the effect of species of capital on access to positions, not on electoral performance.
Table 4 presents a set of binary logistic regression (logit) models according to each dichotomous variable. The table shows the goodness of fit for each model. Given the number of cases included (N considered), this is relatively good, with the pseudo R2 oscillating between .19 and .38. The value of the AIC test, which reflects the relation between the bias and variance in construction of the model, shows that, although the six models are quite similar, the third one tends to have a better goodness of fit. Moreover, in order to prevent instability of the final results, variance inflation factor tests (VIF) were used to verify the absence of multicollinearity in both models.
The results partially support the hypothesis of this research. The first two models (for the full two-decade period) show that age, gender (control variables), and variables related to cultural-educational capital (except having attended a private school) and to social-family and political capital are significant for both positions but have opposite effects. Considering the sample, being older is more likely to characterize ministers than deputies, and being younger increases the likelihood of being deputies than ministers. Similarly, having had many years of education turns out to be significant to ministers compared to deputies, while having had fewer years of education is more likely to apply to deputies than ministers.
This is also reflected in the importance of having studied as an undergraduate at the Universidad de Chile or the Universidad Católica, which has a positive effect for ministers and a negative one for deputies. This may be related to the profile for the position of minister in Chile, which calls for technical and academic credentials as well as political experience (González-Bustamante and Olivares 2016). Only family capital has a significant effect in the same direction for both positions, but loses importance when the data are analyzed separately for each of the two decades, reflecting the fact that the models for the full period include different generations (parents and children).
Another interesting result is seen for gender. In the full period, a woman is more likely to be a minister than a deputy, but when the two decades are separated, this finding remains significant only for 2000—2010. This is because there were very few women ministers in the Aylwin and Frei governments compared to the Lagos and Bachelet governments, which saw a significant increase in the incorporation of women as a result of the adoption of gender parity criteria in the executive branch (González-Bustamante and Olivares 2016). This was not the case for deputies, where the negative effect of being a woman persists through both periods. However, it is important to consider that most of the women in the sample held their positions in 2000—2010, explaining why this variable was not significant in the period corresponding to the Aylwin and Frei governments.
Another clear trend is participation in the presidential campaign of the government under which the position was held. In the case of ministers, this variable is significant for all three periods analyzed. This is hardly surprising, since a cabinet seat is a position assigned by the president. The opposite occurs for deputies, which is also not surprising, since access to this position is determined by elections and the function does not depend on the executive.
Finally, religion is seen to be significant for both ministers and deputies considering the whole period (1990—2010). However, for ministers, the effect is negative and loses significance when the period is divided into two decades. For deputies, on the other hand, it has a significant positive effect in all three periods, suggesting that for them, unlike ministers, there is a species of capital related to their religious beliefs.
The fact that years of education is a significant variable confirms the importance of academic and technical specialization to be appointed as minister and is in line with the literature on this for Chile. After analyzing the results of the logit models, it is interesting to look at the predictive capacity this variable and that of gender have for access to the positions of minister and deputy. This was calculated using nonlinear models.
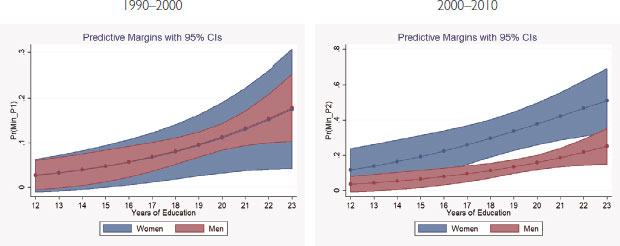
Figure 1 shows the probability of being appointed a minister by gender and years of education, with a 95 percent level of confidence. In regard to women, there is an important difference between the two periods. In both, the number of years of education and being a woman increases the probability of appointment as a minister, but in 1990—2000, the confidence interval tends to be much wider than for men, reflecting the small number of women in the sample for that period. In 2000— 2010, both the probability and the fit increase. The curve for men is similar to that for women in the first period, but with a better fit, whereas in the second period, it is below the curve for women but with a good fit.
Probability of Being Appointed Minister by Gender and Years of Education

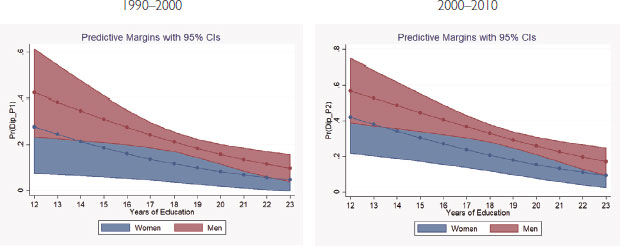
These results show that number of years of education and gender satisfactorily predict appointment as minister. For deputies, however, the opposite is true (figure 2). In the sample, fewer years of education (considering primary and secondary education as the minimum) and being a man increase the probability to be appointed a deputy rather than a minister. This analysis does not consider effects at the level of elections. This position is only analyzed comparatively with that of minister.
Probability of Being Appointed Deputy by Gender and Years of Education

Despite the differences for men and women, these results reinforce the idea that the number of years of education increases the probability of being appointed minister rather than deputy in the sample. It also confirms the favorable effect of the introduction of gender parity criteria on women’s incorporation into the executive branch, but not the legislature. Furthermore, the only variable that is not relevant in the analysis is secondary education at a private school. This could be due to the difficulties implicit in quantitative measurement of the school as a place of socialization and a social entry barrier to the elite, as discussed in the descriptive analysis. This represents an important challenge for future research.
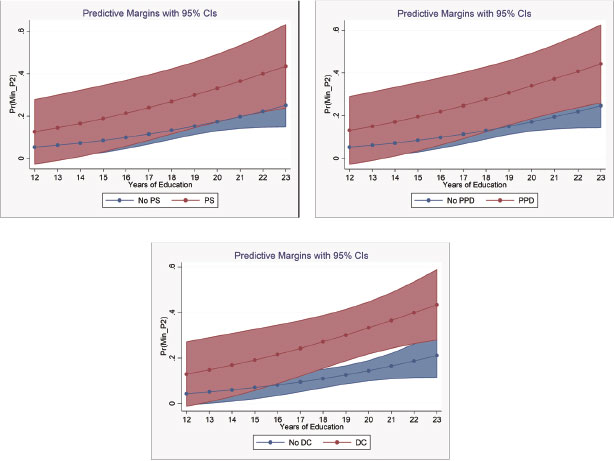
The results of the models show that membership in a political party has a significant effect for ministers in 2000—2010 in the case of the PS, the PPD, and the PDC. In line with this, the predictive capacity of membership in these parties, together with years of education, is compared as shown in figure 3.
Probability of Being Appointed Minister by Political Party and Years of Education, 2000—2010 (PS, PPD, and PDC)

The figure shows the probability of being appointed minister by political party and years of education in 2000—2010 (PS, PPD, and PDC), with a 95 percent level of confidence. In the case of ministers, although there are more significant variables related to technocratic qualifications, membership in a political party, together with years of education, has significant effects and is a predictor of appointment as a minister for the PDC, PPD, and PS. Among these three parties, the effect is most significant for the PDC, followed by the PPD and the PS. In other words, being a member of one of these parties in 2000—2010 and more years of education and specialization increased the probability of appointment as a minister. For deputies, membership in a political party has a significant effect in both decades. Therefore, after analyzing the results of the logit models, it is relevant to look at the predictive capacity of this variable and years of education for access to the position of deputy. This was calculated using nonlinear models considering each of the six parties included in the analysis.
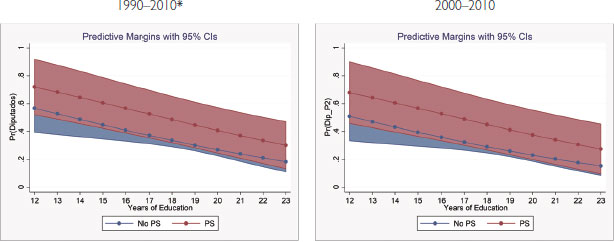
Figure 4 shows the probability of being appointed deputy rather than minister in the sample by political party and years of education for the PS, with a 95 percent level of confidence. The full two-decade period is considered as a reference because the logit analyses indicate that membership in this party did not have a significant effect in 1990—2000. The results show predictive capacity in both periods but, given that membership in the PS was not significant for 1990—2000, it is relevant only for 2000—2010.
Probability of Being Appointed Deputy by Political Party and Years of Education (PS)

In this case, it is important to note that for the full two-decade period, the variables mentioned have significant predictive capacity for being appointed deputy rather than minister, but as membership in the PS does not have a significant effect in 1990—2000, the comparison shown in figure 4 indicates that this effect is actually concentrated in the second period, implying that a predictive analysis for the first decade would be spurious.
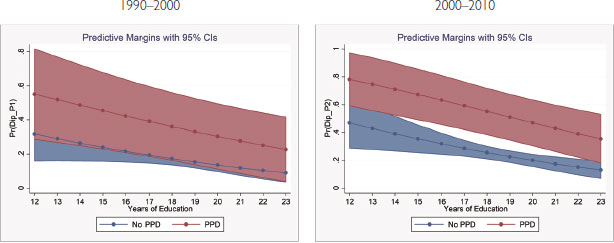
Figure 5 shows the probability of being appointed deputy rather than minister as relevant groups of comparison by political party and years of education for the PPD, with a 95 percent level of confidence. In contrast to the case of the PS, both variables are significant for both periods. However, the effect is larger in the second period, which also is seen in the case of predictive capacity. Figure 5 shows that the confidence interval tends to be smaller and the probability of being appointed deputy is greater than for those who were not members of this party.
Probability of Being Appointed Deputy by Political Party and Years of Education (PPD)

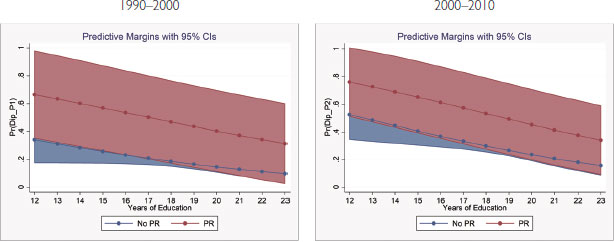
Figure 6 shows the probability of being appointed deputy instead of minister by political party and years of education for the PRSD, with a 95 percent level of confidence. As for the PPD, both variables are significant for both periods, but the logit analyses show that membership in this party tends to be more significant in the first decade. However, in the predictive graphs, it can be seen that the confidence interval is wide, reflecting the fact that the number of deputies belonging to this party is lower than for other parties, since it is a smaller party with less electoral strength.
Probability of Being Appointed Deputy by Political Party and Years of Education (PRSD)

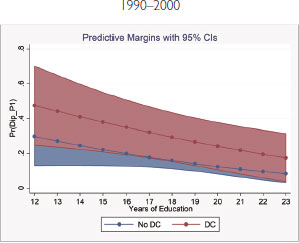
Figure 7 shows the probability of being appointed deputy rather than minister by political party and years of education for the PDC, with a 95 percent level of confidence, between 1990 and 2000. The PDC is the only party for which membership is significant only in the first decade. This is explained by its electoral and political decline after 2000. After the transition to democracy, it was the most powerful party in the Concertación, and the two first posttransition presidents, Patricio Aylwin and
Probability of Being Appointed Deputy by Political Party and Years of Education (PDC)

Eduardo Frei, were drawn from its ranks. However, the subsequent two governments were headed by members of the PS (Ricardo Lagos and Michelle Bachelet), and in the 2009 congressional elections, the PDC began to lose electoral strength, with a drop in the votes obtained by its candidates for both the Chamber of Deputies and the Senate.
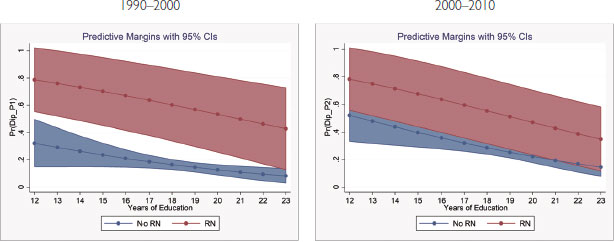
Figure 8 shows the probability of being appointed deputy by political party and years of education for the RN, with a 95 percent level of confidence. Membership in this party was highly significant in both decades. In the predictive graphs, it is clear that in the first period, the probability was extremely significant compared to those who were not members of this party. This was due to the binomial system for congressional elections, which heavily favored the Alianza and its two parties: the UDI and RN.
Probability of Being Appointed Deputy by Political Party and Years of Education (RN)

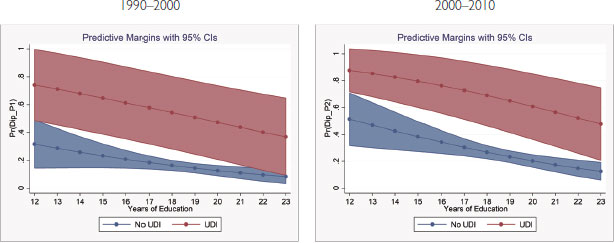
Figure 9 shows the probability of being appointed deputy by political party and years of education for the UDI, with a 95 percent level of confidence. In this case, both variables are significant but in opposite directions, with the probability of being appointed deputy decreasing with years of education (12) and increasing with membership in the party. Like the RN, the UDI benefited from the binomial electoral system.
Probability of Being Appointed Deputy by Political Party and Years of Education (UDI)

Discussion and Conclusions
This study contributes empirically to the study of Chile’s political elites. The results show that ministers are highly qualified and have a shared space of socialization through where they studied and family connections. In the case of deputies, educational cultural capital tends to be significant but in the inverse direction seen for ministers, suggesting that other resources or species of capital are very probably relevant for access to this position. Only religion and family tend to have a relevant significance, which is in line with the literature on this subject in Chile and other Latin American countries (Camp Reference Camp1997, Reference Camp2013; Thumala Reference Thumala2010). In the full period, family capital is significant for both positions, reflecting the fact that, in most cases, there is a generation (for example, a father or a mother) that held the position in the first decade, followed by a second generation (for example, a son or daughter) in the subsequent decade. These results provide empirical evidence for the prevalence of this form of capital in the elites in Latin America since the oligarchic regimes (Frank Reference Frank2001; Rovira Kaltwasser 2009, 2018).
Within the limitations of this study, the analysis of the results reveals a marked difference between members of the executive and legislative branches. In the case of ministers, a technocratic profile is seen to be important, which is a phenomenon that has prevailed since the mid-1950s in Chile (Silva Reference Silva2009). Empirically, the results show that cultural capital expressed as level of specialization (years of education) is important for this position. This reflects the strategic role that ministers play in the design and implementation of public policies (González-Bustamante and Garrido-Vergara 2018; González-Bustamante and Olivares 2016).
For deputies, an interesting result is that, as for ministers, family is important, along with religion. This is not trivial, because it confirms the importance of this resource, not only for membership in the elite but also for access to key positions. The prevalence of religion, especially Catholic, among the members of parliament also has been observed in other Latin American countries (Fleet and Smith Reference Fleet and Smith1997).
The data also reveal that other factors have important effects for being appointed either minister or deputy. Age, which is equated with experience, is important for appointment to a ministerial position, whereas for deputies, youth (relative to other positions, such as minister or senator) matters. Indeed, in the period studied here, the average age of deputies was between 45 and 48.
Both the existence and the reproduction of these species of capital imply a growing effort of socialization on the part of individuals in which social recognition is determined by numerous interactions, through which it is constantly affirmed and reaffirmed (Bourdieu Reference Bourdieu1985, 52). Based on this logic, the results presented here indicate that although many species of capital fulfill different functions for being appointed minister or deputy, family capital is a fundamental resource for access to both positions.
Given the limits of the data used here, on the other hand, there are some challenges that further research could address concerning the uses of cultural and social capital among the political elite. With regard to cultural capital, it would be certainly relevant to study elite preferences concerning their tastes and to compare them with the rest of the society, in order to analyze the relationship between the differentiation of tastes and the reproduction of social inequalities. This could certainly be addressed by replicating some other interesting studies that do measure these dimensions (Špaček 2017).
On the other hand, with regard to social capital, although it is difficult to quantify in terms of relations and reciprocal ties of power, some studies have addressed the conformation, structure, and consequences of political networks (Van Gunten Reference Van Gunten2015). This certainly remains a challenge for further research.
In general terms, the work presented here is the first applied analysis to measure quantitatively the effects of species of capital in Chile’s political elite. It tests empirically a series of hypotheses that were defined and operationalized as indicated in the literature on elites in Chile. From a sociological standpoint, the study has defined and compared the profiles of ministers and deputies according to the species of capital found to be instrumental for accessing these positions.
Note
I thank David Lehmann, Karina Arias-Yurisch, and Bastián González-Bustamante for providing detailed feedback on earlier drafts. I also thank Alfredo Joignant and FONDECYT project #1100877 for providing access to the database on political elites in Chile. I am also thankful to the three anonymous reviewers of LAPS for their valuable comments and suggestions on previous versions of this article. I finally thank participants in the panel about elites at the COES-LSE 2016 conference, as well as attendees in a workshop organized at the Universidad de Santiago de Chile (USACH) in 2018. Remaining errors are my own.
Supporting Information
Additional supporting materials may be found with the online version of this article at the publisher’s website: Appendix