


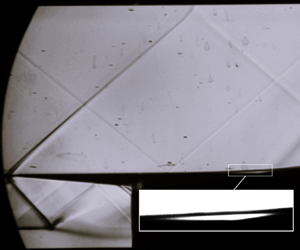



1. Introduction
A shock wave–boundary layer interaction (SBLI) is a classical flow phenomenon of high-speed aerodynamics. One encounters SBLIs in various applications, such as engine inlets, transonic wings, rocket nozzles and compressors, hence they have received a lot of attention over the past 70 years (Délery, Marvin & Reshotko Reference Délery, Marvin and Reshotko1986; Dolling Reference Dolling2001).
While small imposed flow deflections tended only to thicken the boundary layer, stronger flow deflections resulted in boundary layer separation. It was understood that one of the important mechanisms of SBLIs was the upstream propagation of the incident pressure rise through the subsonic channel of the boundary layer (Lees Reference Lees1949). Given how often SBLIs were encountered in practical applications, there began many investigations with the objective of developing a model to predict the length of the separated region.
However, this length scale was dependent on many parameters, such as Mach number, Reynolds number, imposed flow deflection, and more importantly, the type of upstream boundary layer. In fact, SBLIs can be classified into three types, depending on the location of boundary layer transition (Gadd, Holder & Regan Reference Gadd, Holder and Regan1954).
(i) Laminar interactions, where the boundary layer remained laminar throughout the interaction.
(ii) Transitional interactions, where transition to turbulence was initiated at some point along the interaction. Recent studies have shown that this type of SBLI may be further divided into several sub-categories, depending on the exact location of the boundary layer transition (Doerffer et al. Reference Doerffer, Flaszynski, Dussauge, Babinsky, Grothe, Petersen and Billard2020).
(iii) Turbulent interactions, where the boundary layer was ‘fully’ turbulent before the interaction.
The length of interaction  $L$ (formally defined as the streamwise distance between the imposed (inviscid) shock location at the wall and the mean location of boundary layer separation at the wall) for laminar interactions was much longer compared to turbulent interactions. Even when scaled with their respective boundary layer thicknesses, the measurements highlighted that
 $L/\delta ^* \approx O(10^1)$ for turbulent interactions, and
 $L/\delta ^* \approx O(10^2)$ for laminar interactions, for equivalent Mach numbers, Reynolds numbers and flow deflections.
Additionally, the flow deflection (or equivalently the pressure rise) required to separate a laminar boundary layer was much lower when compared to turbulent boundary layers (Liepmann, Roshko & Dhawan Reference Liepmann, Roshko and Dhawan1952). This meant that it was difficult to make a fair comparison between the different types of SBLIs.
When comparing the same types of SBLIs, free interaction theory (first proposed by Oswatitsch & Wieghardt (Reference Oswatitsch and Wieghardt1948) and later formalized by Chapman, Kuehn & Larson (Reference Chapman, Kuehn and Larson1958)) showed that the non-dimensional pressure rise at separation was independent of the imposed flow deflection, and was rather a function of only the upstream Mach and Reynolds numbers. This meant that the coefficient of free interaction was different depending on the type of upstream boundary layer (Babinsky & Harvey Reference Babinsky and Harvey2011).
Further, the length of interaction was found to be dependent on the type of geometrical configuration; while a small compilation of oblique shock reflection experiments did show the same linear relationship between the length scales and the imposed shock strength (Dupont, Haddad & Debieve Reference Dupont, Haddad and Debieve2006), the length scales from compression ramp experiments were approximately 2–4 times smaller for equivalent shock strengths.
The pioneering work of Souverein, Bakker & Dupont (Reference Souverein, Bakker and Dupont2013) was able to develop scaling laws for both the length of interaction and the shock strength, to collapse most of the experimental measurements of turbulent SBLIs. The length of interaction was shown to be a direct consequence of the mass flow deficit between the outgoing and incoming boundary layers. This scaling was a common formulation for both oblique shock reflections and compression ramps.
Moreover, it was shown that the pressure needed to separate a turbulent boundary layer was mainly dependent on the dynamic pressure of the free-stream, and only a weak effect of the Reynolds number was reported (see figure 8(a), p. 522, of Souverein et al. Reference Souverein, Bakker and Dupont2013). Hence an inviscid shock strength was developed that was a type of overall pressure difference across the interaction, expressed in non-dimensional form. This scaling was able to successfully clear the ambiguities associated with the length scales of turbulent SBLIs between various wind tunnel facilities over a large range of Mach numbers, Reynolds numbers, flow deflections and geometrical configurations. However, later studies showed that the Reynolds number did affect the pressure required to separate turbulent boundary layers, mainly at high Reynolds numbers (Touré & Schülein Reference Touré and Schülein2020, Reference Touré and Schülein2023; Xie et al. Reference Xie, Yang, Zeng, Liao, Ding, Zhang and Guo2021).
In contrast to turbulent SBLIs, the Reynolds number was found to have a significant effect on transitional interactions. Large differences (approximately 50 %) were reported between the length scales from the low Reynolds number wind tunnel of the IUSTI laboratory (Diop, Piponniau & Dupont Reference Diop, Piponniau and Dupont2016, Reference Diop, Piponniau and Dupont2019) and the high Reynolds number wind tunnel of TU Delft (Giepman, Schrijer & Van Oudheusden Reference Giepman, Schrijer and Van Oudheusden2018), for the same imposed shock strength.
A possible explanation was also the difference in free-stream noise of the two wind tunnels, which could have affected the transition process of the separated laminar boundary layer, and indirectly affected the length scales of the interaction. The wind tunnel of the IUSTI laboratory was found to have approximately four times lower turbulent intensities compared to the experimental facilities of TU Delft (comparing mass-flux fluctuations from Diop et al. (Reference Diop, Piponniau and Dupont2019) and Giepman, Schrijer & Van Oudheusden (Reference Giepman, Schrijer and Van Oudheusden2015)). On a similar note, numerical studies of oblique shock reflections showed that the amplitude of inflow perturbations had a significant influence on the length of interaction (Larchevêque Reference Larchevêque2016), similar to what was observed for low-speed laminar separation bubbles (Marxen & Henningson Reference Marxen and Henningson2011). Hence transition of the laminar boundary layer also played a significant role in affecting the length scales in such types of interactions.
Hence it was clear that the length scales of transitional SBLIs were sensitive to more parameters compared to turbulent SBLIs. Consequently, a thorough search of the literature did not yield any scaling laws or comprehensive compilation for laminar and transitional SBLIs that accounted for the effects of the Reynolds number.
The main aim of the current paper is to investigate the length scales of transitional SBLIs with the hope of reconciling the discrepancies between different wind tunnel facilities. It is well known that length scales of such interactions have a complicated relationship with the transition of the boundary layer. The effect of the Reynolds number and receptivity of the boundary layer to free-stream disturbances is not very well understood. As several experimental facilities have examined the length scales of transitional SBLIs, the current work explores whether a scaling can be developed that consolidates all these results. Finally, an effort is made to develop common scaling laws for laminar, transitional and turbulent SBLIs.
Experiments studying transitional SBLIs were performed with two compression ramps, and comparisons were drawn with previous experiments from the IUSTI laboratory. The paper is organized as follows. Section 2 describes the experimental facilities of the IUSTI laboratory along with the geometrical models and the flow measurement techniques that were used. Sections 3.1 and 3.2 verify and validate the canonical nature of the upstream laminar boundary layer as well as the compression ramp SBLIs, respectively. The length of interaction is addressed in § 3.3, initially focusing on the effect of flow deflection and Reynolds number, and then moving on to the compilation of experimental data. Section 3.4 extends the scaling to turbulent SBLIs, and comparisons are drawn between different types of interactions. Section 4 summarizes the results, providing conclusions and perspectives.
2. Experimental methodology
The experiments were performed at the IUSTI laboratory of Aix-Marseille University and CNRS. The supersonic wind tunnel was a closed-loop system that could be operated continuously for several hours without significant drift in free-stream properties ( ${\pm }1\ {\rm K}\ {\rm h}^{-1}$ and
 $\pm$0.5 mbar).
Experiments were performed in the S8 test section, where a symmetric converging–diverging nozzle accelerated the flow to Mach number  $M=1.65$, corresponding to free-stream velocity
 $u_{\infty} =464$ m s
 $^{-1}$. The total temperature was maintained at ambient conditions (approximately 295 K, depending on weather conditions), while the total pressure (
 $p_t$) of the free-stream could be varied from 0.15 atm to 0.9 atm. This resulted in a range of unit Reynolds numbers (
 $Re_u$) from
 $2.1 \times 10^6\ {\rm m}^{-1}$ to
 $12.4 \times 10^6\ {\rm m}^{-1}$ for the free-stream. Most of the current experiments were performed for free-stream total pressures 0.4 atm, 0.6 atm and 0.8 atm (see table 1).
Operating conditions of the experiments.

The free-stream noise at the exit of the nozzle was measured using the classical single sensor hot-wire anemometer. The streamline amplifier from Dantec Dynamics was operated in the symmetric bridge configuration. A platinum and tungsten wire of 2.5  $\mathrm {\mu }$m diameter was used. The constant temperature anemometer had an effective bandwidth in the range 100–150 kHz, depending on the unit Reynolds number. Sensitivity of the anemometer to fluctuations of total temperature was reduced by operating at a high overheat ratio 0.8, and sensitivity to fluctuations of Mach number was negligible as the free-stream Mach number was greater than 1.4 (Morkovin Reference Morkovin1956). Hence fluctuations of hot-wire voltage (
 $e$) were directly related to the fluctuations of mass-flux through the King's law coefficient
 $F_c$ (Dupont Reference Dupont1990). Additionally, fluctuations of velocity and pressure were determined from fluctuations of mass-flux, considering isentropic and non-rotational flow in the potential region (Morkovin Reference Morkovin1956), as follows:
 $$\begin{gather} \sigma_{\rho u} = \frac{(\rho u)_{rms}}{(\rho u)_{mean}} = \frac{1}{F_{c}} \times \frac{e_{rms}}{e_{mean}}, \end{gather}$$
 $$\begin{gather}\sigma_{u} = \frac{u_{rms}}{u_{mean}} = \frac{1}{F_{c}} \times \frac{1}{M^2 - 1} \times \frac{e_{rms}}{e_{mean}} , \end{gather}$$
 $$\begin{gather}\sigma_{p} = \frac{p_{rms}}{p_{mean}} = \frac{1}{F_{c}} \times \frac{\gamma M^2}{M^2 - 1} \times \frac{e_{rms}}{e_{mean}}. \end{gather}$$
Table 1 shows the measured turbulence intensities in terms of non-dimensional fluctuations (root mean square, r.m.s.) of mass-flux, velocity and pressure. The free-stream noise was found to have low turbulence intensities under all operating conditions. This ensured that the laminar boundary layer would not undergo bypass transition (Laufer Reference Laufer1961).
Downstream of the nozzle, the test section was 105 mm in height and 170 mm in spanwise width. The two geometric models were similar in construction, with a sharp leading edge, total length 280 mm, and spanning the entire width of the test section. The location of the corner of the ramp ( $x_c$) was 115 mm from the leading edge for both geometries (table 2). The Reynolds number based on the location of the corner (
 $Re_c$) is shown in table 1 for different total pressures of the free-stream. The two models were placed at height 25 mm from the floor, using supports near the spanwise edges of the wind tunnel (figure 1). These supports prevented any ‘leakage’ between the main flow over the models and the secondary flow underneath the models. It is to be noted here that the adiabatic wall temperature for these models nearly reached ambient conditions (total temperature of the free-stream), considering a recovery factor
 $r \approx Pr^{1/2} \approx 0.84$ for a fully laminar boundary layer, and
 $r \approx Pr^{1/3} \approx 0.89$ for a fully turbulent boundary layer (Mack Reference Mack1954), where
 $Pr$ is the Prandtl number. It is important to note that from here on, the entire geometry of the ramp on the flat plate is referred to as a ‘compression ramp’ for simplicity.
Differences between ramp geometries in figure 1(b).

(a) Picture and (b) schematic of compression ramp geometry (differences between ramp geometries are described in table 2).

The flow deflections ( $\varphi$) of the two compression ramps were chosen such that direct comparisons could be drawn with the oblique shock reflection experiments by Diop (Reference Diop2017). In particular, the ramp angles were chosen to be twice that of the imposed flow deflection in the oblique shock reflection experiments, so that the overall pressure rise across the interaction was the same between the two configurations (Délery et al. Reference Délery, Marvin and Reshotko1986). The oblique shock reflection experiments were performed in the same wind tunnel facility (but in the other test section (S7) of the IUSTI laboratory), at similar Mach and Reynolds numbers. Similar to experiments of Diop (Reference Diop2017), the floor of the wind tunnel was modified to have additional depth 10 mm to alleviate choking of the secondary flow underneath the models.
The boundary layers on the side walls of the test section were ‘tripped’ and hence turbulent in nature. The onset of separation for a turbulent boundary layer at this Mach number was estimated to be a  $14^\circ$ ramp (or
 $7^\circ$ oblique shock reflection). Hence these side wall boundary layers were not separated, but only decelerated. The ‘edge/corner’ effect of this decelerated side wall boundary layer on the main transitional SBLI on the ramp was expected to be minimal.
Flow visualization was performed using Schlieren measurements from a conical set-up involving a parabolic mirror and continuous illumination. Vertical gradients of density in the flow were visualized by placing the knife edge horizontally. Images of the mean flow were acquired with a classical full-frame digital SLR camera (Nikon D700), having a 12-bit CMOS sensor with pixel size 8.45  $\mathrm {\mu }$m, and resolution
 $4526 \times 2832$ pixels, and the exposure time of the camera was set to 150
 $\mathrm {\mu }$s.
A classical Pitot probe was used to make measurements of the mean flow field. The tip of the probe was 0.3 mm in height with an opening 0.15 mm in height, which measured the mean stagnation pressure of the flow (downstream of the shock wave of the probe). Given that the total pressure upstream of the nozzle was measured, flow properties such as Mach number, pressure, temperature, velocity and density (upstream of this shock wave around the probe) were determined using the Rayleigh Pitot formula and standard compressible flow equations (NACA, Ames Research Staff 1953). For Pitot measurements made inside the laminar boundary layer, it was assumed that the static pressure and the total temperature were constant.
3. Results
3.1. Upstream boundary layer
The boundary layer velocity profiles were measured at different streamwise locations on a simple flat plate geometry at the same Mach number. The geometry and set-up of the flat plate was identical for both the compression ramps.
Measurements using the Pitot probe were made every 0.05 mm in the wall-normal coordinate and are shown in figure 2 in similarity coordinates, with streamwise velocity scaled with the free-stream velocity ( $u_{\infty }$), and wall-normal distance scaled with the thickness of the boundary layer (
 $\delta _{99}$). The figure also shows the theoretical compressible Blasius boundary layer profile, obtained by solving the compressible boundary layer equations for the same Mach number.
Boundary layer velocity profiles at different Reynolds numbers. Solid black line indicates Blasius boundary layer; circles indicate  $Re_x = 0.65 \times 10^6$; crosses indicate
 $Re_x = 0.96 \times 10^6$; squares indicate
 $Re_x = 1.27 \times 10^6$.

Measurements of the boundary layer profile made at different Reynolds numbers exhibited a clear linear region and agreed very well with the theoretical Blasius profiles, thus validating the canonical nature of the laminar boundary layer for the Reynolds numbers (i.e.  $Re_c$) considered in the current experiments (table 1). The nature of the boundary layer was expected to be the same over both compression ramps, given the similarity of the geometrical models. Hence it was concluded that both compression ramps were interacting with a canonical laminar boundary layer.
3.2. Spatial organization
Figure 3 shows the Schlieren visualization of the transitional SBLI for the  $6^\circ$ compression ramp. The sensitivity of the Schlieren system was increased so that small density gradients may be observed more clearly. The shock wave from the leading edge of the model (annotated as ‘LE shock’ in figure 3) was weak (
 $\Delta M \approx 0.1$, based on Pitot measurements). Additionally, a Mach wave was seen originating from the ceiling of the test section, upstream of the leading edge. This Mach wave was due to a very small structural discontinuity between the end of the diverging section of the nozzle and the start of the test section. This Mach wave did not have a significant effect on the mean flow field of the interaction, based on Pitot probe and hot-wire measurements. The secondary flow (under the ramps) appeared to maintain supersonic conditions, indicating that the flow was not choked.
Schlieren visualization for  $\varphi = 6^\circ$ and
 $Re_c = 0.65 \times 10^6$.

Looking closely near the corner, it was seen that the boundary layer separated upstream of the corner, and subsequently reattached downstream of the corner. A separation bubble was visible between the points of separation and reattachment (identified by the small bright white region). Separation of the boundary layer was not characterized by a distinct shock wave, but rather weak compression waves that could not be seen by Schlieren imaging. However, stronger compression waves were observed at reattachment, that coalesced further away from the wall, and merged into a shock wave. The Schlieren visualization of the interaction involving the  $10^\circ$ compression ramp was similar and is not shown here to avoid repetition.
An illustration of the compression ramp SBLI is shown in figure 4, where  $C$ represents the corner of the ramp, with
 $S$ and
 $R$ representing separation and reattachment of the boundary layer (BL), respectively. The recirculating region was long and thin, shown by the grey region between the points
 $S$ and
 $R$. Such large aspect ratios of the separated region was also found by previous studies (Giepman et al. Reference Giepman, Schrijer and Van Oudheusden2018; Diop et al. Reference Diop, Piponniau and Dupont2019; Threadgill, Little & Wernz Reference Threadgill, Little and Wernz2021). Far downstream of reattachment, the boundary layer was expected to be fully turbulent. The streamwise distance between the points
 $S$ and
 $C$ was referred to as the length of interaction (
 $L$).
Illustration of the SBLI over the compression ramp.

Meanings of symbols for the current transitional SBLI experiments (Reynolds number ( $Re_c$) shown in millions).

Figure 5 shows the evolution of the static pressure coefficient over the interaction for the two compression ramps, determined from Pitot pressure measurements. Given the weak nature of the leading edge shock wave, and the nearly isentropic nature of the compression waves associated with separation of the laminar boundary layer (Chapman et al. Reference Chapman, Kuehn and Larson1958; Giepman et al. Reference Giepman, Schrijer and Van Oudheusden2018), the Rayleigh Pitot formula together with standard compressible flow equations was used to determine the static pressure of the flow. Measurements were made outside the boundary layer at a constant height from the wall, for every 1 mm along the streamwise coordinate. The height of the measurements was chosen such that there was minimal probe interaction effect on the flow. This was chosen to be  $y = 5$ mm and
 $y = 14$ mm for the 6
 $^\circ$ and 10
 $^\circ$ compression ramps, respectively. It is to be noted that all wall-normal and streamwise coordinates were measured with the leading edge of the model as origin. The streamwise coordinate was normalized according to (3.1), where
 $x_s$ corresponded to the mean location of separation, and
 $x_c$ was the location of the corner:
 \begin{equation} X^* = \frac{x - x_s}{x_c - x_s}. \end{equation}
Comparison of Pitot pressure evolution with inviscid pressure rise (for symbols, see table 3; solid black line represents the inviscid pressure step), for (a)  $6^\circ$ ramp, and (b)
 $10^\circ$ ramp.

The mean location of separation was associated with the inflection point in the streamwise pressure evolution. This inflection point was determined by identifying the peak in the streamwise gradient of the pressure (Larchevêque Reference Larchevêque2016; Sansica, Sandham & Hu Reference Sansica, Sandham and Hu2016). This inflection point outside the boundary layer was projected to the wall following the inviscid shock wave angle of separation (which was determined based on the pressure ratio at separation). Thus the mean location of separation was determined at the wall up to an accuracy  $\pm$1 mm.
The measurements showed a classical two-step pressure rise, characteristic of separated SBLIs, for all the operating conditions of the current experiments. Comparisons were also made with the inviscid pressure rise for each compression ramp, and reasonable agreement was found in both cases, with a small undershoot by the experiments. This was due to the non-trivial loss of total pressure across the reattachment shock, which was not taken into account in the data analyses. Additionally, it was observed that the reattachment compression was abrupt (corresponding to a focused shock wave) for the  $10^\circ$ ramp, as opposed to a smooth and gradual compression at reattachment for the
 $6^\circ$ ramp.
The non-dimensional pressure rise at separation was identical for both compression ramps, owing to the free interaction process of the boundary layer (Chapman et al. Reference Chapman, Kuehn and Larson1958). Figure 6 shows the evolution of the pressure across separation in terms of the coefficient of free interaction
 \begin{equation} F = \frac{p - p_1}{q} \sqrt{ \frac{( M^2 - 1 )^{1/2}}{2 c_f} }, \end{equation}
where  $p_1$ is the static pressure of the free-stream,
 $q$ is the dynamic pressure of the free-stream, and
 $c_f$ is the skin-friction coefficient. The theoretical skin-friction coefficient from an equivalent (attached) Blasius boundary layer was used to determine this coefficient. It is to be noted here that the theory of free interaction proposed another scaling for the streamwise coordinate based on the extent of the pressure rise at separation. This scaling was not used here as it was not possible to determine this streamwise length accurately and confidently. Hence figure 6 uses the scaling based on the length of interaction (see (3.1)). Nevertheless, the measurements confirmed the process of free interaction;
 $F_s \approx 0.8$ was reached at the mean location of separation, and the pressure reached
 $F_p \approx 1.5$ asymptotically downstream of separation, agreeing with standard values reported by various experiments in the literature (Babinsky & Harvey Reference Babinsky and Harvey2011). This confirmed the canonical nature of the current compression ramp SBLIs.
Pressure evolution across separation represented through the coefficient of free interaction (for symbols, see table 3; dashed black line corresponds to  $F_s = 0.8$, and dotted black line corresponds to
 $F_p = 1.5$).

The flow deflection at separation (corresponding to the pressure rise at separation) was found to be  $1.3^\circ \leq \varphi _s \leq 1.7^\circ$. It was observed that this flow deflection at separation decreased slightly with increasing Reynolds number, following the predictions of free interaction theory (Chapman et al. Reference Chapman, Kuehn and Larson1958). However, the exact difference in these flow deflections was within the uncertainty of the measurements, hence this result could not be concluded with confidence. Nevertheless, the global organization of the mean flow field was similar for the two compression ramps for all the Reynolds numbers considered in these experiments.
3.3. Length of interaction
Additionally, Pitot probe measurements provided quantitative insight into the upstream influence of the SBLI through the length of interaction, which was defined as the streamwise distance between the corner of the ramp and the mean location of boundary layer separation (measured at the wall). Figure 5 shows that the global organization of the mean flow was similar for both ramp geometries. However, it does not show how the length of interaction changed with Reynolds number as well as imposed flow deflection. Figure 7 compares the pressure evolution over the interaction between the two ramps, similar to figure 5. But instead of using the non-dimensional streamwise coordinate, the streamwise coordinate was projected to the wall (using the local Mach characteristic angles), and is shown in absolute units of millimetres. It was assumed that flow information propagated along characteristic lines in the potential region of supersonic flows (Agostini et al. Reference Agostini, Larchevêque, Dupont, Debiève and Dussauge2012). As these measurements were made at different heights for the two ramps, this procedure was chosen to make a fair comparison using absolute coordinates. It is also important to note that data markers are shown for only every fifth measurement point (corresponding to 5 mm between data markers, whereas measurements were made every 1 mm) to reduce clutter in figure 7.
Comparison of non-dimensional pressure evolution, projected to the wall (for symbols, see table 3; solid black line represents the inviscid pressure step), for (a)  $6^\circ$ ramp, and (b)
 $10^\circ$ ramp.

It was observed that the length of interaction decreased when the Reynolds number was increased, for both the ramps. And comparing between the two ramps, the length of interaction was larger for higher ramp angles (table 4). Additionally, it was observed that on the  $6^\circ$ ramp, the locations of both separation (corresponding to the first pressure rise) and reattachment (corresponding to the second pressure rise) moved when the Reynolds number was changed. However, only the location of separation moved and the reattachment point was nearly fixed at approximately the same location on the
 $10^\circ$ ramp.
Absolute lengths of interactions shown in millimetres (Reynolds number  $Re_c$ shown in millions).

Figure 8 highlights the evolution of the length of interaction ( $L$) normalized by the compressible displacement thickness (
 $\delta ^*$) at separation (the theoretical compressible displacement thickness for an attached Blasius boundary layer was used). The uncertainty in the determination of the length of interaction derived mainly from the determination of the mean location of separation, which was approximated to be accurate up to
 $\pm$1 mm. Therefore, an uncertainty in the experimental determination of the length of interaction was found to be between 6 % and 14 %, with larger uncertainty for shorter lengths of interaction. The symbols used in figure 7 are repeated in figure 8 for consistency. Here, the shock strength was defined as the non-dimensional inviscid pressure rise imposed by the ramp:
 \begin{equation} c_{p_3} = \frac{p_3 - p_1}{q} = \frac{2}{\gamma M^2} \left(\frac{p_3}{p_1} - 1\right), \end{equation}
where  $p_3$ is the theoretical inviscid pressure downstream of the reattachment (figure 9). A clear trend of the length of interaction was not observed for increasing Reynolds numbers (figure 8a). Nevertheless, the length scales for different Reynolds numbers fell on a vertical line for each ramp (figure 8b). However, it is important to note that the maximum variation of length scales (approximately 8 %) for this range of Reynolds number was within the uncertainty of experimental measurements. Therefore, a quantitative effect of Reynolds number could not be determined confidently from the current experiments.
Comparison of non-dimensional lengths of interaction between both compression ramps (for symbols, see table 3): (a) Reynolds number effect, and (b) shock strength effect.

Schematic of SBLI: (a) oblique shock reflection, and (b) compression ramp.

Further, for comparisons to be made between different geometries (e.g. oblique shock reflections and compression ramps), there was a need to utilize a common length scaling for both geometries. As the current experiments were made so that a direct comparison could be made with oblique shock reflection experiments of Diop (Reference Diop2017), an effective scaling for the length of interaction was necessary. Souverein et al. (Reference Souverein, Bakker and Dupont2013) developed a common length scaling for turbulent SBLIs, based on the mass flow deficit between the outgoing ( $\dot {m}_{out}$) and incoming (
 $\dot {m}_{in}$) boundary layers:
 \begin{equation} L^* = \frac{L}{\delta^*}\,G_3(M,\varphi) = \frac{L}{\delta^*}\left( \frac{\sin(\beta) \sin(\varphi)}{\sin(\beta - \varphi)}\right) = \left( \frac{ \dot{m}_{out} }{ \dot{m}_{in} } - 1 \right), \end{equation}
where  $\delta ^*$ was the compressible displacement thickness of the boundary layer at the mean location of separation,
 $\beta$ was the inviscid shock wave angle, and
 $\varphi$ was the imposed flow deflection (figure 9). This scaling was a common formulation for both oblique shock reflections and compression ramps. Although this scaling was developed for turbulent SBLIs, it should also be applicable to transitional SBLIs, given that this formulation was based on the mass conservation of the mean flow (Souverein et al. Reference Souverein, Bakker and Dupont2013). Further, (3.4) shows that the
 $ \dot{m}_{out}$ term could be affected by the mean velocity profile of the boundary layer at reattachment, and this provided a possible physical explanation for how the transitional state of the boundary layer at reattachment could have affected the length of interaction.
Figure 10 compares the length of interaction between the current experiments on compression ramps and oblique shock reflection experiments from Diop (Reference Diop2017). The meanings of the symbols used in this figure can be found in table 5. Here,  $Re_i$ refers to the Reynolds number based on the location of the inviscid shock at the wall (impingement shock for the oblique shock reflection, and location of the corner for compression ramps). This common notation of Reynolds number will be used from here onwards to avoid confusion.

Legend of symbols for transitional SBLI experiments of Diop (Reference Diop2017) (Reynolds number  $Re_i$ shown in millions).

It was observed that the classical normalization ( $L/\delta ^*$) resulted in nearly half the interaction lengths for the compression ramps compared to the oblique shock reflections (figure 10a). The use of ‘mass-balance’ length scaling (
 $L^*$) rectified this disagreement. Further, length scales for equivalent shock strengths nearly collapsed on each other, and the same linear relationship was obtained between the non-dimensional shock strength and the non-dimensional length of interaction (figure 10b), confirming that such a length scaling based on the mass-balance approach was also valid for transitional SBLIs.
However, the effect of Reynolds number on the length of interaction of transitional SBLIs was still not clear, as the oblique shock reflection experiments of Diop (Reference Diop2017) was performed for nearly the same range of Reynolds numbers as the current experiments. This again suggested that a variation of Reynolds number by a factor of two (as in the current experiments and the experiments of Diop Reference Diop2017) was not enough to confidently determine its effect, and a much larger variation of Reynolds number was required.
Hence an attempt was made to compile a number of experimental measurements of the lengths of interaction for transitional SBLIs. In particular, experiments of oblique shock reflections and compression ramps were collected. The current data set was limited to the supersonic regime and excluded hypersonic experiments. It was believed that the non-adiabatic wall conditions in hypersonic experiments might locally influence the pressure required to separate the boundary layer. Due to the complexity of this effect, hypersonic experiments were excluded in the current compilation. In general, transitional SBLIs with wall heat transfer effects were excluded from this compilation.
Therefore, this compilation was not meant to be exhaustive, and also did not include the length scales reported from the transitional SBLI experiments by Liepmann et al. (Reference Liepmann, Roshko and Dhawan1952), Gadd et al. (Reference Gadd, Holder and Regan1954), Gadd (Reference Gadd1958), Lewis, Kubota & Lees (Reference Lewis, Kubota and Lees1968), Roberts (Reference Roberts1970) and Polivanov, Sidorenko & Maslov (Reference Polivanov, Sidorenko and Maslov2015), as the published information was not enough to determine  $L^*$. Nevertheless, to the authors’ knowledge, such a compilation was made for the first time for transitional SBLIs, which included a collection of independent experiments performed over the past 70 years, in different wind tunnel facilities, and with a wide range of operating conditions:
 \begin{equation} \left.\begin{array}{@{}c@{}} 1.6 \leq M \leq 4.0, \\ 0.11 \leq Re_i ({\times} 10^6) \leq 2.5, \\ 1.2 \leq p_3/p_1 \leq 8.3. \end{array}\right\} \end{equation}
In addition to the mass-balance scaling, Souverein et al. (Reference Souverein, Bakker and Dupont2013) also proposed a non-dimensional separation criterion to classify the shock strength:
 \begin{equation} S^*_e = \frac{p_3 - p_1}{(\Delta p )_{sep}} = k\,\frac{2}{\gamma M^2} \left(\frac{p_3}{p_1} - 1\right). \end{equation}
Here, a constant ( $k$) was chosen to take into account the weak effect of Reynolds number as well as expressing the separation state of the boundary layer. In particular, the constant was chosen as
 $k = 3$ for
 $Re_{\theta } \leq 10^4$, and
 $k = 2.5$ for
 $Re_{\theta } > 10^4$, so that
 $S_e^* = 1$ at the onset of separation, with
 $S_e^* < 1$ corresponding to incipiently separated interactions, and
 $S_e^* >$ 1 corresponding to fully separated interactions. This was similar to the shock strength scaling used here (comparing (3.3) and (3.6)), but with an additional parameter (
 $k$).
If such a separation criterion had to be used for transitional SBLIs, then this constant had to be modified from what was typically used for turbulent SBLIs. In particular, the value of this constant had to be increased, as the pressure difference required to separate a laminar boundary layer ( $(\Delta p )_{sep}$) was much smaller compared to turbulent boundary layers. Giepman et al. (Reference Giepman, Schrijer and Van Oudheusden2018) estimated that the onset of separation for a laminar boundary layer was
 $\varphi \approx 1^\circ$ from oblique shock reflection experiments. The value
 $k \approx 9$ was approximated for transitional SBLIs using this estimation. Given that the onset of separation of a laminar boundary layer was not studied extensively for different Mach and Reynolds numbers, the choice of this constant was intended to be a first estimate (obtained purely from curve fitting), and thus did not have a physical basis for all Mach and Reynolds numbers.
Figure 11 shows the compilation of the experiments using the scaling ( $L^*$ and
 $S_e^*$) proposed by Souverein et al. (Reference Souverein, Bakker and Dupont2013). The symbols used in this compilation are shown in table 6. It was observed that different trends were exhibited in the data, and this variety in the trends was greater than the uncertainty associated with the measurement techniques. It is to be noted here that the data points with large values of
 $L^*$ and
 $S_e^*$ correspond to the high Mach number (
 $M > 3$) experiments of Chapman et al. (Reference Chapman, Kuehn and Larson1958), Pate (Reference Pate1964) and Threadgill et al. (Reference Threadgill, Little and Wernz2021), where large flow deflections could be imposed.
Length of interaction based on the mass-balance scaling by Souverein et al. (Reference Souverein, Bakker and Dupont2013) with  $k = 9$ (for symbols, see tables 3, 5 and 6).

Meanings of symbols for the compilation of transitional SBLIs. (The symbols for the experiments of Diop (Reference Diop2017) and the current experiments can be found in table 5.)

One of the possible reasons why this scaling did not collapse the data set of transitional SBLIs was due to the inability of the shock strength scaling to take into account the effect of Reynolds number. This was clear when looking at experiments where the Reynolds number was varied while keeping the shock strength constant. Such data points fell on a straight vertical line, with smaller lengths for higher Reynolds numbers (e.g. length scales reported by Threadgill et al. Reference Threadgill, Little and Wernz2021). Hence this compilation highlighted that there was a need for the shock strength parameter to consider the change in Reynolds number.
In order to introduce Reynolds number in the shock strength scaling, the concept of free interaction theory by Chapman et al. (Reference Chapman, Kuehn and Larson1958) was revisited. The main idea behind this formulation was that the non-dimensional pressure rise at separation showed universal behaviour for all SBLIs (apart from the constant being different for turbulent and laminar boundary layers). This universal behaviour has been proven many times for a number of experiments for different Mach numbers, Reynolds numbers and shock strengths (Babinsky & Harvey Reference Babinsky and Harvey2011). Moreover, this universal behaviour was also verified for the current set of experiments (figure 6).
The initial idea of Souverein et al. (Reference Souverein, Bakker and Dupont2013) for the non-dimensional shock strength scaling was to compare the overall increase in pressure across the interaction with the pressure rise across separation ( $\Delta p/(\Delta p)_{sep}$). Such a scaling did indeed collapse a subset of experimental data, in which the pressure rise needed to separate the boundary layer was explicitly reported (see p. 519, figure 7, of Souverein et al. Reference Souverein, Bakker and Dupont2013). However, to include other experimental data that did not measure the pressure rise needed to separate,
 $(\Delta p)_{sep}$ was replaced by a constant (see (3.6)).
The current compilation showed that Reynolds number had a significant effect on the pressure rise at separation for transitional SBLIs, and this behaviour could be described universally by free interaction theory (see (3.2)). If the pressure required to separate a boundary layer was approximated as the plateau pressure i.e.  $(\Delta p)_{sep} \approx p_2 - p_1$, then free interaction theory can be rewritten as
 \begin{equation} \frac{(\Delta p)_{sep}}{q} = F_p\,\sqrt{\frac{2 c_f}{(M^2 - 1)^{1/2}}}, \end{equation}
where  $F_p = 1.5$ was the value of the free interaction coefficient at plateau for laminar boundary layers (Babinsky & Harvey Reference Babinsky and Harvey2011). As the extent of the plateau in laminar and transitional SBLIs was quite large, the uncertainty in the determination of this coefficient at plateau would be lower than in determining the exact value needed to separate a laminar boundary layer (Giepman et al. Reference Giepman, Schrijer and Van Oudheusden2018). Consequently, the expression
 $\Delta p/(\Delta p)_{sep}$ was elaborated using (3.7) as follows:
 \begin{equation} S_d^* = \frac{p_3 - p_1}{(\Delta p)_{sep}} = \frac{1}{F_p}\,\sqrt{\frac{(M^2 - 1)^{1/2}}{2 c_f}}\,\frac{2}{\gamma M^2} \left(\frac{p_3}{p_1} - 1\right). \end{equation}
The subscript  $d$ in
 $S_d^*$ corresponded to expression being based on the difference in pressure. This expression was similar to (3.6), with an additional term (similar to
 $k$) that introduced the effect of Reynolds number through the skin-friction coefficient (
 $c_f$). However, the skin-friction coefficient was not reported by most of the experiments in this compilation due to its measurement complexity. Hence the theoretical skin-friction coefficient for a compressible Blasius boundary layer (at the mean location of separation) was used. This was done to remain consistent across all data sets. The compilation of the experimental data using the new shock strength scaling is shown in figure 12.


This new scaling did improve some of the problems found in the previous scaling, in particular, different Reynolds numbers resulted in different separation criteria, and consequently the length scales did not fall on vertical lines (compare figures 11 and 12). Nevertheless, there was still a large amount of scatter among the data points, hence proving that this was not the right scaling either.
Another way to scale the shock strength parameter was to compare the ratio of pressures, as opposed to comparing the pressure differences:
 \begin{equation} S_r^* = \frac{p_3/p_1}{(\,p/p_1)_{sep}} = \frac{p_3}{p_1}\left[ 1 + \frac{\gamma M^2}{2}\, F_p\,\sqrt{\frac{2\ c_f}{(M^2 - 1)^{1/2}}} \right]^{-1}, \end{equation}
where  $(\,p/p_1)_{sep}$ is again obtained from the free interaction theory of Chapman et al. (Reference Chapman, Kuehn and Larson1958), by rewriting (3.7). The subscript
 $r$ in
 $S_r^*$ corresponded to the expression being based on the ratio of pressures. This latest scaling seemed to collapse most of the data set, as shown in figure 13. The effect of Reynolds number appeared to be well captured by this new scaling as the data points did not fall on a vertical line as in the previous scaling (figure 11), and instead of the different trends observed in figure 12, nearly the same linear relationship (i.e. same slope) was obtained for most of the data points from the compilation in figure 13.


The non-dimensional nature of this scaling automatically adjusted the shock strength; for low shock strengths with no separation, the imposed adverse pressure ratio is lower than the pressure ratio required to separate the boundary layer, hence  $S_r^* < 1$. For incipient interactions involving intermittent separation, the imposed pressure ratio is close to the pressure ratio required to separate the boundary layer (
 $S_r^* \approx 1$). And finally,
 $S_r^* > 1$ corresponded to a typical separated SBLI. No empirical constant had to be adjusted for this auto-scaling, compared to (3.6).
Additionally, when the plateau pressure between separation and reattachment was approximated as  $p_2$, this separation criterion could be rewritten as
 \begin{equation} S_r^* = \frac{p_3/p_1}{(\,p/p_1)_{sep}} \approx \frac{p_3/p_1}{p_2/p_1} \approx \frac{p_3}{p_2}. \end{equation}
It is well known that separated SBLIs are characterized by a two-step pressure rise over the interaction, and the overall pressure rise ( $p_3/p_1$) across the interaction can be expressed as the combination of these two pressure jumps:
 \begin{equation} \frac{p_3}{p_1} = \frac{p_2}{p_1} \times \frac{p_3}{p_2}. \end{equation}
The first pressure rise ( $p_2/p_1$) at separation exhibited universal behaviour according to free interaction theory (Chapman et al. Reference Chapman, Kuehn and Larson1958). The second pressure rise (
 $p_3/p_2$) at reattachment did not show universal behaviour. The collapse of the experimental data in figure 13 suggested that the non-dimensional length of interaction was a function of only the second pressure rise (
 $p_3/p_2$), given that the first pressure rise at separation was universal. This could be a possible physical explanation as to why only this separation criterion was able to collapse the experimental data set.
It is important to note that as a consequence of this non-dimensional scaling, both the horizontal ( $S_r^*$) and vertical (
 $L^*$) axes of figure 13 were functions of Reynolds numbers:
 $$\begin{gather} \delta^* \propto \sqrt{\frac{x_s}{Re_u}}, \quad c_f \propto \frac{1}{\sqrt{Re_u\,x_s}}, \end{gather}$$
 $$\begin{gather}L^* \approx L\,\sqrt{\frac{Re_u}{x_s}}\,G_3(M,\varphi), \quad S^*_r \approx (Re_u\,x_s)^{1/4}\,f(M,\varphi). \end{gather}$$
Here,  $\delta ^*$ introduced a Reynolds number term through the Blasius reference length scale in
 $L^*$, while
 $(c_f)^{-1/2}$ introduced a Reynolds number term in
 $S_r^*$, where
 $Re_u$ is the unit Reynolds number, and
 $x_s$ is the mean location of separation of the boundary layer at the wall. Given that the Reynolds number was present on both axes, but with different exponents for the non-dimensional length (
 $L^*$) and non-dimensional shock strength (
 $S_r^*$), it was clear that Reynolds number played an important role to collapse the compilation.
Now that an effective scaling was found for the shock strength, a more detailed comparison was made between different transitional SBLI experiments. Looking closely at figure 13, it was observed that certain data sets from different wind tunnels exhibited the same slope, while being offset with respect to each other, along the vertical axis. Figure 14 shows the ‘zoom’ of the data points in the lower left corner of figure 13, to highlight the low Mach number experiments (i.e. the regime of the current experiments). In fact, nearly parallel lines could be drawn, where each line corresponded to a subset from different wind tunnel facilities (parallel dashed red lines in figure 14).

One of the major contributing factors for this nearly constant offset could be a difference in free-stream turbulence intensities across different wind tunnel facilities. The problem of background aerodynamic noise was found to be a major limitation in the study of high-speed laminar boundary layers since the very beginning of experiments in supersonic wind tunnels (Laufer Reference Laufer1954). Similar to low-speed flows, high free-stream turbulence intensities were linked to a rapid transition scenario that bypassed the linear growth of modes predicted by stability theory (Morkovin Reference Morkovin1959).
Even if the free-stream turbulence intensities were low enough for the growth of linear and modal mechanisms (i.e. not high enough to trigger bypass transition) of the laminar boundary layer, they could still accelerate the natural transitional mechanisms (Laufer Reference Laufer1961). The influence of free-stream turbulence intensity on the transitional mechanisms of a laminar boundary layer is a complex topic; in particular, the effect of amplitude and spectral content of the free-stream noise on the transition process (through receptivity), is not very well understood. Nevertheless, a qualitative understanding of this effect of free-stream noise on the transitional mechanisms of the laminar boundary layer is well known. A review of supersonic wind tunnels by Pate & Schueler (Reference Pate and Schueler1969) provided strong evidence linking the noise radiated by turbulent boundary layers on the tunnel walls to lower transition Reynolds numbers.
As discussed in § 1, the free-stream noise of the TST-27 wind tunnel at TU Delft was reported to be nearly four times higher (in terms of r.m.s. of mass-flux fluctuations) when compared to the current experimental facility at the IUSTI laboratory (Giepman et al. Reference Giepman, Schrijer and Van Oudheusden2015). While this free-stream noise was not high enough to trigger bypass transition of the boundary layer, it might have accelerated the transitional mechanisms of the laminar boundary layer, causing the separated boundary layer to reattach ‘earlier’, leading to a shorter length of interaction, and subsequently an offset in figure 14. Based on this qualitative understanding, perhaps the lower length scales of other experiments were possibly a consequence of higher free-stream noise of the wind tunnels. However, other wind tunnel facilities in this compilation have not reported their amplitude and spectral content of the free-stream noise, hence it was not possible to conclude its quantitative effect on the length scales of the interaction.
In order to understand the effect of noise radiated by side wall boundary layers in wind tunnels, NASA developed the so-called ‘quiet’ wind tunnel, which ensured that the boundary layers on all the tunnel walls were laminar. Experiments performed in this low-disturbance tunnel reported transition Reynolds numbers of  $O(10^7)$, one order of magnitude higher than conventional ‘noisy’ wind tunnels (Chen, Malik & Beckwith Reference Chen, Malik and Beckwith1989; Schneider Reference Schneider2004). Schneider (Reference Schneider2015) further highlighted that quiet tunnels were more representative of actual flight conditions, and emphasized the necessity to develop quiet wind tunnels to study the transition process, particularly at hypersonic speeds, where the boundary layer transitional mechanisms were more complex. Unfortunately, none of the experiments in this compilation were made in quiet wind tunnels. It would be very interesting to compare the length scales for laminar and transitional SBLIs from such facilities to the current compilation.
Another important factor to consider was leading edge bluntness. Potter & Whitfield (Reference Potter and Whitfield1962) showed that the bluntness of the leading edge had a significant effect on the transition process of the laminar boundary layer. It was found that the transition Reynolds number increased for increasing ‘bluntness’ of the leading edge, even when bluntness had a negligible effect on the mean pressure distribution. This delay or acceleration of the transition process (corresponding to a blunt or sharp leading edge, respectively) of the boundary layer could have affected the length scales of interaction, and consequently played a role in the observed offset in length scales in this compilation. Therefore, it could be speculated that model with ‘blunt’ leading edges delayed transition and corresponded to larger lengths of interaction. However, given that the degree of bluntness of the leading edge was not reported by many of the authors in this compilation of experimental data, it was difficult to determine what kind of effect this had on the transition process of their respective boundary layers.
Moreover, Lusher & Sandham (Reference Lusher and Sandham2020) showed that the lateral walls of the wind tunnel test section could dramatically change the length of interaction for transitional SBLIs. This confinement effect was particularly significant when the spanwise width of the test section was small compared to the length of the separated region. The current compilation in figure 14 contained experiments with a wide variety of test section sizes. The effect of this finite size of the test section and deviation from nominally two-dimensional interaction is a complicated relationship between the laminar boundary layer and the turbulent boundary layer on the side walls. This topic of three-dimensional effects in nominally two-dimensional SBLIs has received relatively more attention for turbulent interactions, with investigations from Dussauge, Dupont & Debiève (Reference Dussauge, Dupont and Debiève2006), Burton & Babinsky (Reference Burton and Babinsky2012), Wang et al. (Reference Wang, Sandham, Hu and Liu2015) and Xiang & Babinsky (Reference Xiang and Babinsky2019), to cite a few.
Also, Threadgill et al. (Reference Threadgill, Little and Wernz2021) showed that when the geometry did not span the entire width of the test section, ‘spillage’ of the flow in the spanwise direction reduced the length of interaction, compared to when end-plates were used. This could have been a contributing factor on the smaller length scales reported by the experiments of Degrez et al. (Reference Degrez, Boccadoro and Wendt1987), where the flat plate did not span the entire width of the test section. However, it is important to note that such effects can both increase or decrease the length scales of the interaction, depending on the secondary flow conditions underneath the main geometry. In fact, an overpressure underneath the geometry could restrict spillage and increase the length of interaction as well.
Additionally, figure 14 showed that some data points exhibited a different slope (shown as dashed blue lines) compared to the rest of the compilation (shown as a solid red line). The slope of this deviant subset of data was found to be reduced by 47 % (when compared to the slope of the red lines in figure 14). To understand this deviation, comparisons were made with individual experimental data sets in figure 15.
Reynolds number effect (for symbols, see tables 3, 5 and 6). (a) Comparison with the experiments of Barry et al. (Reference Barry, Shapiro and Neumann1951) (symbol  $\circ$) for different Reynolds numbers (solid black line for
 $Re_i = 0.11 \times 10^6$, dashed black line for
 $Re_i = 0.25 \times 10^6$, dotted black line for
 $Re_i = 0.6 \times 10^6$, dashed dotted black line for
 $Re_i = 1.2 \times 10^6$). (b) Comparison with the experiments of Giepman et al. (Reference Giepman, Schrijer and Van Oudheusden2018) (symbol ★) for a constant Reynolds number (solid black line for
 $Re_i = 1.8 \times 10^6$,
 $2^\circ \leq \varphi \leq 5^\circ$) and increasing Reynolds number (solid blue line for
 $\varphi = 3^\circ$,
 $1.8 \leq \ Re_i (\times 10^6) \leq 2.5$).

The current experiments were compared with one of the first parametric studies on transitional SBLIs from Barry et al. (Reference Barry, Shapiro and Neumann1951) in figure 15(a). It was observed that at low Reynolds numbers (i.e.  $Re_i = 0.11 \times 10^6$), the same slope was observed (compared to the current experiments), albeit with an offset (possibly due to a combination of factors mentioned before). However, as the Reynolds number was increased (i.e.
 $Re_i \geq 0.6 \times 10^6$), this slope reduced and the offset also increased (the change in offset is clearer at higher
 $S_r^*$). It is important to note here that the Reynolds number was changed by changing the total pressure of the free-stream, while the inviscid shock impingement location was kept constant.
Similarly, comparisons were made with the more recent parametric studies of Giepman et al. (Reference Giepman, Schrijer and Van Oudheusden2018) in figure 15(b). At ‘low’ Reynolds numbers (i.e.  $Re_i = 1.8 \times 10^6$), when the imposed flow deflection was increased, the measured length scales were offset with respect to the current experiments, and the slope was slightly lower. However, as the Reynolds number was increased (i.e.
 $Re_i > 1.8 \times 10^6$, corresponding to the solid blue line in figure 15b), the offset increased as well (in this case the Reynolds number was increased by moving the shock impingement location further downstream, while keeping the same total pressure of the free-stream).
Moreover, it is also imperative to note that there was an order of magnitude difference in Reynolds numbers between the experiments of Barry et al. (Reference Barry, Shapiro and Neumann1951) and Giepman et al. (Reference Giepman, Schrijer and Van Oudheusden2018). Hence the lowest Reynolds number of Giepman et al. (Reference Giepman, Schrijer and Van Oudheusden2018) was still higher than the highest Reynolds number of Barry et al. (Reference Barry, Shapiro and Neumann1951), while the offsets for both of these experiments were nearly the same, possibly suggesting that the free-stream noise of Giepman et al. (Reference Giepman, Schrijer and Van Oudheusden2018) was much lower than that of Barry et al. (Reference Barry, Shapiro and Neumann1951).
In essence, figure 15 suggested that when the free-stream noise was ‘high’, the transitional mechanisms of the laminar boundary layer were possibly accelerated, which could have changed the relationship between Reynolds number and the length of interaction. The modelling of this modified relationship would require insight into the complex interplay between free-stream noise, receptivity (for both the attached and separated boundary layers) and Reynolds number.
Moreover, the state of the boundary layer at separation was not qualified by many experiments in the compilation, and if the boundary layer was already transitional at separation, then it would lead to an accelerated transition process over the separated shear layer, and consequently lead to a shorter length of interaction. In such cases, the pressure required to separate such boundary layers might not be the same as a canonical laminar boundary layer, and hence would affect the normalized shock strength parameter ( $S_r^*$). Hence it seems that while the non-dimensional scaling
 $S_r^*$ was the right one for comparing different transitional SBLIs, different models might be needed to predict the pressure required to separate laminar boundary layer at high free-stream noise or high Reynolds numbers.
In the context of the current compilation of transitional SBLIs, it seems that there might be multiple sub-categories of interactions under the general term of transitional SBLIs. The difference between these sub-categories can be attributed to the extent to which boundary layer transitional mechanisms have an impact on the length of interaction. The experimental results from the European TFAST project also reported several differences in the mean flow properties of transitional SBLIs across different studies (Doerffer et al. Reference Doerffer, Flaszynski, Dussauge, Babinsky, Grothe, Petersen and Billard2020). Based on these findings, the following three sub-categories of transitional SBLIs are proposed within the context of the current compilation.
(i) Weakly transitional, corresponding to transitional SBLIs with low free-stream noise and/or relatively low Reynolds numbers. Given that the current experiments and the experiments of Diop (Reference Diop2017) from the IUSTI laboratory exhibit the highest non-dimensional length scales (at the same normalized shock strength) compared to the rest of the data in figure 14, it could be classified as weakly transitional. It seems that the influence of boundary layer transitional mechanisms on the length of interaction was minimal. This sub-category may be generally defined as: interactions where the boundary layer was laminar at separation, and became transitional near the vicinity of reattachment.
(ii) Moderately transitional, where the acceleration of boundary layer transitional mechanisms (through either free-stream noise or high Reynolds number) introduced a small (but significant) offset in the length of interaction. This corresponded to the data sets highlighted by the dashed red lines in figure 14. It is important to note that although an offset was observed in these length scales, the same slope (between
 $L^*$ and $S_r^*$) was obtained as ‘weakly transitional’ interactions, and hence referred to as moderately transitional interactions. A more general definition of this sub-category may be: interactions where the boundary layer was laminar at separation, and became turbulent near the vicinity of reattachment.
(iii) Strongly transitional, where the acceleration of boundary layer transitional mechanisms introduced an offset in the length of interaction, and changed the slope (between
$L^*$ and $S_r^*$) compared to other transitional SBLIs. This corresponded to the set of ‘deviant’ experiments highlighted by the dashed blue lines in figure 14. This sub-category may be generally defined as: interactions where the boundary layer was transitional near the vicinity of separation, underwent rapid transition over the separated shear layer, and became turbulent at reattachment.


Further experiments detailing the transitional state of the boundary layer along the interaction are needed to confirm this subdivision of transitional SBLIs. Additionally, a detailed parametric study on the influence of free-stream noise and high Reynolds number on transitional SBLIs is apparent.
3.4. Universal scaling
Notwithstanding the nonlinear effects of the transition process, it seemed that the new separation criterion scaling  $S_r^*$ was able to capture the relationship between the length of interaction and the imposed adverse pressure gradient, for transitional SBLIs. Building on these results, an attempt was made to extend this scaling for turbulent SBLIs as well.
However, it seems that there were several models that predict the pressure required to separate a turbulent boundary layer. In addition to laminar boundary layers, the free interaction theory of Chapman et al. (Reference Chapman, Kuehn and Larson1958), also predicted the increase of pressure following the separation of a turbulent boundary layer:
 \begin{equation} \left(\frac{p}{p_1}\right)_{sep} = 1 + \frac{\gamma M^2}{2}\,F_p\,\sqrt{\frac{2 c_f}{(M^2 - 1)^{1/2}}}, \end{equation}
with the constant  $F_p$ being different between laminar and turbulent boundary layers, taking values 1.5 and 6, respectively. However, Babinsky & Harvey (Reference Babinsky and Harvey2011) highlighted that this was not a universal law for all Reynolds numbers. While at low Reynolds numbers, the shock strength required to separate a turbulent boundary layer decreased as Reynolds number was increased, this trend was reversed for
 $Re_{\delta } > 10^5$, and eventually the Reynolds number dependence became very weak at much higher Reynolds numbers. This was due to the fact that the turbulent boundary layer becomes fuller at higher Reynolds number, consequently more resistant to separation.
Zukoski (Reference Zukoski1967) modelled the pressure required to separate a turbulent boundary layer as a function of only Mach number:
 \begin{equation} \left(\frac{p}{p_1}\right)_{sep} = 1 + \frac{M}{2}. \end{equation}
Similarly, Souverein et al. (Reference Souverein, Bakker and Dupont2013) expressed the pressure difference required to separate a turbulent boundary layer as a function of only the dynamic pressure of the free-stream (see (3.6)). This could be rewritten as
 \begin{equation} \left(\frac{p}{p_1}\right)_{sep} \approx 1 + \frac{\gamma M^2}{2}\,\frac{1}{k}, \end{equation}
where the empirical constant  $k$ had a weak dependence on Reynolds number. This expression is similar to (3.13), where the empirical constant
 $k$ was modelled using the skin-friction coefficient.
More recently, Xie et al. (Reference Xie, Yang, Zeng, Liao, Ding, Zhang and Guo2021) aimed to improve free interaction theory by proposing that the coefficient of free interaction ( $F_p$) in (3.13) could be modelled as
 \begin{equation} F_p = \frac{2.348\ln(3.872 + H^*_{sep}) - 0.492}{\sqrt{H_i^{1.2} - 1}}, \end{equation}
where  $H_i$ was the incompressible shape factor of the upstream boundary layer, and
 $H^*_{sep}$ was the non-dimensional height of the separation bubble (normalized by the displacement thickness of the upstream boundary layer). Therefore, this expression required knowledge about the shape of the separation bubble, making it an a posteriori analysis.
In contrast to free interaction theory, Touré & Schülein (Reference Touré and Schülein2023) proposed that the plateau pressure ( $p_p$) was dependent on both Reynolds number as well as the strength of the imposed shock:
 $$\begin{gather} \frac{p_p}{p_1} = 1 + \frac{M}{2}\,\text{tanh}(1.7 c_p^*), \end{gather}$$
 $$\begin{gather}c_p^* = k^* c_{p_3} = \left( \frac{Re_{\delta}}{2 \times 10^5} \right)^{-0.27(c_{p_3})^{1.41}} c_{p_3}, \end{gather}$$
where the empirical scaling factor  $k^*$ aimed to capture the nonlinear effects of the Reynolds number, and
 $c_{p_3}$ was the overall pressure applied over the interaction (see (3.3)). This expression for the pressure ratio at plateau has not been tested for a wide range of experimental data, and the effectiveness of this scaling remains to be seen. Further, while the use of this empirical scaling factor
 $k^*$ was able to collapse the experimental data sets of Settles, Bogdonoff & Vas (Reference Settles, Bogdonoff and Vas1976) and Touré & Schülein (Reference Touré and Schülein2020), different slopes (i.e. different power-law relationships) were obtained for each data set. Moreover, the relationship between
 $L^*$ and
 $c_p^*$ was different for oblique shock reflections and compression ramps. Nevertheless, the unique experimental set-up of Touré & Schülein (Reference Touré and Schülein2020) using blunt shock generators enabled them to reach much higher shock strengths compared to conventional oblique shock reflections on turbulent boundary layers. It was shown that the effect of Reynolds number was more pronounced at such high shock strengths.
Therefore, it seems that there are several ways to determine the pressure required to separate a turbulent boundary layer, and a universal expression might not exist that works for all Reynolds numbers and shock strengths. Additionally, there exist other expressions proposed for non-adiabatic wall conditions by Morgan et al. (Reference Morgan, Duraisamy, Nguyen, Kawai and Lele2013), Jaunet, Debieve & Dupont (Reference Jaunet, Debieve and Dupont2014) and Zuo et al. (Reference Zuo, Wei, Hu and Pirozzoli2022). This would further change the onset of separation, hence this additional complexity was not included in the current analysis. This also means that hypersonic SBLIs were not included as wall heat transfer effects become significant.
Hence it seems that while the same scaling law (expressed as the overall pressure ratio compared to the pressure ratio required to separate the boundary layer) could be used for turbulent SBLIs, different models have to be used for the pressure required to separate the boundary layer depending on each case. Touré & Schülein (Reference Touré and Schülein2020) showed that the scaling proposed by Souverein et al. (Reference Souverein, Bakker and Dupont2013) was not adequate to account for the Reynolds number effect observed at very large shock strengths. And as the exponents in the power scaling in (3.17) was optimized to account for these effects, it was appropriate to use this scaling for the large shock strength experiments of Touré & Schülein (Reference Touré and Schülein2020).
While  $c_p^*$ (see (3.17)) was derived from the expression of
 $S_e^*$ (see (3.6)), the empirical parameter
 $k^*$ (see (3.17)) was not adjusted such that
 $c_p^* \approx 1$ at the onset of separation, where
 $L^* \approx 1.8$ from the compilation of Souverein et al. (Reference Souverein, Bakker and Dupont2013). Therefore, a proportionality factor of approximately 2.25 was introduced to the expression for
 $c_p^*$ such that
 $L^* < 1.8$ corresponded to attached SBLIs, and
 $L^* > 1.8$ corresponded to separated SBLIs. Now the pressure ratio required to separate a turbulent boundary layer could be derived from the power-law scaling of Touré & Schülein (Reference Touré and Schülein2020) as
 $$\begin{gather} \frac{\Delta p}{( \Delta p )_{sep}} \approx 2.25 c_p^* = 2.25 k^* c_{p_3} = 2.25 k^*\,\frac{2}{\gamma M^2} \left( \frac{p_3}{p_1} - 1 \right), \end{gather}$$
 $$\begin{gather}\left(\frac{p}{p_1}\right)_{sep} = 1 + \frac{\gamma M^2}{2}\,\frac{1}{2.25 k^*}. \end{gather}$$
Hence the normalized shock strength based on this power-law scaling was written as
 \begin{equation} S_r^* = \frac{p_3/p_1}{(\,p/p_1)_{sep}} = \frac{p_3}{p_1}\left[ 1 + \frac{\gamma M^2}{2}\, \frac{1}{2.25 k^*} \right]^{-1}. \end{equation}
This expression was used to represent the data set of Touré & Schülein (Reference Touré and Schülein2020) corresponding to relatively large shock strengths. However, Touré & Schülein (Reference Touré and Schülein2023) mentioned that this scaling was not meant for low Reynolds number experiments, and further did not provide a better collapse at lower shock strengths (figure 14(b) in Touré & Schülein Reference Touré and Schülein2020). Therefore, for the compilation of experimental data at relatively lower shock strengths made by Souverein et al. (Reference Souverein, Bakker and Dupont2013), the pressure ratio required to separate a turbulent boundary layer was modelled purely on the dynamic pressure of the free-stream (see (3.15)), and the resulting normalized shock strength was written as
 \begin{equation} S_r^* = \frac{p_3/p_1}{(\,p/p_1)_{sep}} = \frac{p_3}{p_1}\left[ 1 + \frac{\gamma M^2}{2}\, \frac{1}{k} \right]^{-1}. \end{equation}
It can be seen that (3.19) and (3.20) are very similar, with the main difference being the use of different empirical parameters,  $k^*$ and
 $k$, respectively. The compilation made by Souverein et al. (Reference Souverein, Bakker and Dupont2013) was revisited in figure 16 using this new scaling (
 $S_r^*$). The data points are plotted with the same symbols as used by Souverein et al. (Reference Souverein, Bakker and Dupont2013), with the addition of the experimental data set of Touré & Schülein (Reference Touré and Schülein2020) (represented by the + symbol). The unique experimental set-up of Touré & Schülein (Reference Touré and Schülein2020) was used to study stationary and moving shock generators, and the data included here correspond only to the stationary shock generator cases. It is important to note here that the compilation of experimental data made by Souverein et al. (Reference Souverein, Bakker and Dupont2013) uses (3.20), while the experimental data set of Touré & Schülein (Reference Touré and Schülein2020) uses (3.19). Hence different models were used to predict the pressure required to separate a turbulent boundary layer, but the same normalized shock strength (
 $S_r^*$) was used.
Comparison of length scales of turbulent SBLIs using different separation criteria, where + indicates Touré & Schülein (Reference Touré and Schülein2020), and other symbols are taken from Souverein et al. (Reference Souverein, Bakker and Dupont2013).

It was clear that this new shock strength scaling did indeed work for turbulent SBLIs as well. Regardless of the use of different models for the separation criterion, figure 16 showed a smooth continuation of the length scales between the relatively low shock strength experiments ( $1 \leq S_r^* \leq 1.5$) and the relatively high shock strength experiments of Touré & Schülein (Reference Touré and Schülein2020) (
 $1.5 \leq S_r^* \leq 3$). As opposed to the power-law relationship proposed by Souverein et al. (Reference Souverein, Bakker and Dupont2013), a first-order (linear) polynomial fit was made in the current analysis, where two different slopes were identified, depending on whether the interaction was attached (
 $S_r^* < 1$) or separated (
 $S_r^* > 1$). This best fit line was based on the whole data set, including both the low and high shock strength experiments. The slope was nearly five times higher when a mean separation was found, when compared to an incipient separation (table 7). The best fit for separated turbulent SBLIs (
 $S_r^* > 1$) was found with coefficient of determination
 $R^2=0.99$, while the best fit for attached turbulent SBLIs (
 $S_r^* < 1$) was found with a lower coefficient of determination 0.63. This low value was possibly due to the large uncertainty in the experimental measurement of an attached length of interaction when the Reynolds number was varied.
Parameters  $(a,b,R^2)$ corresponding to the slope, intercept, and coefficient of determination respectively, of first-order polynomial fit
 $L^* = a\ S_r^* + b$.

Due to the universality of this scaling of the normalized shock strength (see (3.10)), transitional and turbulent SBLIs can now be compared directly, and figure 17 shows this comparison. The black and white symbols correspond to turbulent SBLI experiments (taken from figure 16), and the coloured symbols correspond to the current experiments and the experiments of Diop (Reference Diop2017) on transitional SBLIs (refer to tables 3 and 5). To the authors’ knowledge, this is the first time such a direct comparison has been made between transitional and turbulent SBLIs.
Comparison of turbulent and transitional SBLI length scales (see Souverein et al. (Reference Souverein, Bakker and Dupont2013) for black and white symbols, and tables 3 and 5 for coloured symbols).

The range of normalized shock strength ( $S_r^*$) corresponding to transitional SBLIs was very high compared to most of the turbulent SBLIs from compilation of Souverein et al. (Reference Souverein, Bakker and Dupont2013). This was mostly due to the fact that the pressure ratio required to separate a laminar boundary layer was much lower compared to a turbulent boundary layer, resulting in large separation criteria for transitional SBLIs. For a ‘conventional’ turbulent SBLI at
 $S_r^* > 1.2$, significant corner and/or three-dimensional effects have been reported (Dupont et al. Reference Dupont, Haddad, Ardissone and Debieve2005; Dussauge et al. Reference Dussauge, Dupont and Debiève2006; Dussauge & Piponniau Reference Dussauge and Piponniau2008; Burton & Babinsky Reference Burton and Babinsky2012; Wang et al. Reference Wang, Sandham, Hu and Liu2015; Xiang & Babinsky Reference Xiang and Babinsky2019). Moreover, large flow deflections probably resulted in a Mach stem over the turbulent SBLI, which could have saturated the imposed pressure jump across the interaction, and possibly resulted in an ‘unstart’ of the test section. However, the unique experimental set-up of Touré & Schülein (Reference Touré and Schülein2020), utilizing a blunt shock generator, was able to reach higher normalized shock strengths. Thus these experiments were key to making equivalent and ‘fair’ comparisons between transitional and turbulent SBLIs.
Figure 17 shows that the  $L^*$ scaling was able to reconcile large differences (nearly one order of magnitude) in the aspect ratios of the length scales (
 $L/\delta ^*$) between the different types of SBLIs, through the inviscid term
 $G_3$, and as
 $L^* = (L/\delta^*) \times G_3$, it follows that:
 \begin{equation} \left.\begin{array}{c@{}} (L/\delta^*)_{tran} \gg (L/\delta^*)_{turb} \\[2pt] (G_3)_{tran} \ll (G_3)_{turb} \end{array}\right\} \frac{(L^*)_{tran}}{(L^*)_{turb}} \approx O(1). \end{equation}
However, it was clear from figure 14 that most of the other ‘sub-category’ transitional SBLIs had lower length scales compared to the current experiments, hence would have non-dimensional length scales ( $L^*$) closer to those of turbulent SBLIs. This is highlighted in figure 18, where the data points are represented by their respective trend lines, to avoid clutter. Weakly transitional SBLIs from the current experiments are shown using a solid red line, moderately transitional SBLIs are shown in dashed red lines, strongly transitional interactions are shown using dashed blue lines, and turbulent SBLIs are shown using a solid blue line.
Comparison of turbulent and transitional SBLI length scales (solid red line for weakly transitional SBLIs, dashed red lines for moderately transitional SBLIs, dashed blue lines for strongly transitional SBLIs, solid blue line for turbulent SBLIs.)

It was observed that some of the data sets of transitional SBLIs that were believed to be strongly affected by boundary layer transition (by either high free-stream noise of the wind tunnel or high Reynolds number) had lower length scales compared to turbulent SBLIs (dashed blue lines in figure 18). This suggested that the separation criterion for these data points was incorrectly modelled (by assuming a canonical laminar boundary layer). The use of a separation criterion based on the actual state of the boundary layer at separation might possibly have shifted these data points to the left, and changed the slope, possibly aligning with the evolution of turbulent SBLIs. However, this information was not reported in those studies.
Similarly, table 7 compares the slopes of the three types of SBLIs observed in figure 18. It was observed that the slope of the current experiments of weakly transitional SBLIs, was more than twice that of turbulent SBLIs, while the transitional SBLIs that deviated away from the rest of the compilation exhibited slopes similar to those of turbulent SBLIs, again suggesting that this subset of transitional SBLIs possibly involved a laminar boundary layer that was strongly affected by its transition process. Figure 18 suggested that the relationship between  $L^*$ and
 $S_r^*$ was strongly dependent on the state of the boundary layer in the interaction (in particular, the state of the boundary layer at reattachment for transitional SBLIs). The slope decreased as the interactions changed from weakly transitional to strongly transitional, and further reduced for a turbulent interaction. This indicated that the ‘type’ of interaction may be determined by documenting the mean field and observing the relationship between
 $L^*$ and
 $S_r^*$.
Finally, this comparison does not include fully laminar SBLIs and/or experiments performed in ‘quiet’ wind tunnels. It remains to be seen whether such SBLIs would result in higher length scales compared to weakly transitional SBLIs. Considering the evolution of slopes from turbulent SBLIs to weakly transitional SBLIs, it would be of interest to determine whether such SBLIs would exhibit similar slopes compared to weakly transitional interactions. Moreover, SBLIs with wall heat transfer effects (and as a consequence, hypersonic SBLIs) have also not been included in this compilation. It is believed that while this set of scaling laws used in the analysis (i.e.  $L^*$ in (3.4) and
 $S_r^*$ in (3.10)) should be applicable to all type of SBLIs (hence being universal in nature), different models might be more appropriate to determine the pressure required to separate the boundary layer in such cases. There are already some studies that have tried to address the separation criterion for SBLIs with non-adiabatic wall conditions (Morgan et al. Reference Morgan, Duraisamy, Nguyen, Kawai and Lele2013; Jaunet et al. Reference Jaunet, Debieve and Dupont2014; Zuo et al. Reference Zuo, Wei, Hu and Pirozzoli2022), and it would be interesting to note how the evolution of the length scales in such SBLIs would compare to the current analyses.
4. Conclusion
Experiments on transitional SBLIs were made on nominally two-dimensional compression ramps. Two ramp geometries, with  $6^\circ$ and
 $10^\circ$ flow deflections, were studied at Mach number 1.65, and the unit Reynolds number was varied between 5.6 million per metre and 11 million per metre. The canonical nature of the transitional SBLI was verified with comparisons with free interaction theory.
The non-dimensional scaling of the length of interaction (originally proposed by Souverein et al. Reference Souverein, Bakker and Dupont2013), based on the mass-balance between the incoming and outgoing boundary layers, was found to reconcile the differences in absolute length scales between compression ramp SBLIs and transitional oblique shock reflection experiments of Diop (Reference Diop2017). Thus such a mass-balance scaling also worked for transitional SBLIs.
A compilation of lengths of interaction reported from various experiments on transitional SBLIs in the literature was made for the first time. The compilation showed that different trends were observed by subsets, and highlighted the effects of Reynolds number on the separation criteria.
A new non-dimensional scaling was developed for the shock strength that was based on the ratio of pressures across the interaction as opposed to the difference in pressures across the interaction (as originally proposed by Souverein et al. Reference Souverein, Bakker and Dupont2013). The pressure ratio across the interaction was normalized with the pressure ratio required to separate the boundary layer. For transitional SBLIs, this pressure ratio was determined using free interaction theory, and the use of such a scaling was able to collapse most of the data set, by obtaining a linear relationship between this new normalized shock strength and the length of interaction.
The current experiments on transitional SBLIs (performed at the IUSTI laboratory) were found to have the longest non-dimensional lengths of interaction compared to the rest of the compilation. And it was observed that some subsets exhibited an offset in non-dimensional length scales with respect to the current experiments. Many possible factors were identified that could have contributed to this offset, including higher free-stream noise, leading edge bluntness, and three-dimensional effects. However, a conclusive cause for this offset could not be found. Additionally, other subsets showed lower slopes, compared to the rest of the compilation. While a conclusive cause could not be identified, the most likely explanation was the combination of high free-stream noise and high Reynolds number, resulting in a non-canonical laminar boundary layer and SBLI. Based on these results, the compilation of transitional SBLIs was classified into three sub-categories, depending on the extent of influence on boundary layer transitional mechanisms on the length scales of the interaction.
The scaling of the separation criterion based on the ratio of pressures across the interaction was extended to turbulent SBLIs. Contrary to transitional SBLIs, several models were found that determine the pressure required to separate a turbulent boundary layer, and the differences mainly arose due to a Reynolds number effect. A universal model to predict the pressure required to separate a turbulent boundary layer was not found, and different models from literature were used when appropriate. Nevertheless, the new normalized shock strength using these models was able to collapse most of the experimental data on turbulent SBLIs.
Due to the common non-dimensional formulation of the length scales and normalized shock strength between transitional and turbulent SBLIs, a direct comparison was made between the different types of SBLIs for the first time. This comparison showed that the  $L^*$ scaling was able to reconcile large differences in the aspect ratios (
 $L/\delta ^*$) of different SBLIs. Similarly, the rate of increase of length scales with increasing normalized shock strength was found to be dependent on the state of the boundary layer over the interaction. The highest rate of increase of length scales was found for weakly transitional SBLIs, while turbulent interactions exhibited the lowest growth rates.
Therefore, the set of non-dimensional scalings  $L^*$ and
 $S_r^*$ is proposed as ‘universal’, given that direct comparisons could be made for all types of SBLIs. However, different models have to be used to determine the pressure required to separate different types of boundary layers. Further experiments and analyses are required to confirm and validate this hypothesis for different separation criteria, as well as to reaffirm the growth rates of the length scales for fully laminar interactions, experiments made in quiet wind tunnels, and SBLIs with wall heat transfer effects, including hypersonic interactions.
Acknowledgements
The authors would like to acknowledge the technical support of P. Lantoine while performing the experiments in the wind tunnel.
Funding
This work is part of the European TEAMAero project (Towards Effective Flow Control and Mitigation of Shock Effects in Aeronautical Applications). The authors would like to acknowledge the support from the European Union's Horizon 2020 research and innovation programme under agreement no. EC grant 860909.
Declaration of interests
The authors report no conflict of interest.
Author contributions
The experiments were performed by all three authors. The data analysis and writing was performed by N.M. The editing and corrections were performed by S.P. and P.D.



