Introduction
Cerebral small vessel disease (SVD) is a disorder affecting the small perforating vessels in the brain. Currently, small vessels cannot be visualized in vivo; therefore, the parenchyma lesions that are thought to be caused by these vessel changes have been adopted as the markers of SVD. These parenchyma lesions include both lacunar infarcts and white matter (WM) lesions (WMLs). Recently, cerebral microbleeds (CMBs) are also part of the SVD lesions, as referred in Neuroimaging standards for research into SVD and its contribution to ageing and neurodegeneration published in Lancet Neurology 2013 (Wardlaw, et al., Reference Wardlaw2013). SVD is a common cause of cognitive decline and stroke in the elderly (Pantoni, Reference Pantoni2010). Therefore, the objective of this study is to provide more information to reveal underlying mechanisms of cognitive impairment in SVD, especially at the early stage. Particularly, we try to shed light on whether CMB is an independent surrogate marker of cognitive dysfunction in SVD.
Lacunar infarcts and WMLs have been demonstrated to associate with cognitive dysfunction in various clinical settings, from cross-sectional to longitudinal, and from hospital-based to community population (Pantoni, Reference Pantoni2010). Diffusion tensor imaging (DTI), a direct MRI measurement of WM integrity, is found to be a more sensitive technique for detecting the cognitive impairment compared with the traditional ones (lacunes as well as WMLs on MRI) in SVD, especially at the early stage (Xu et al., Reference Xu2010). CMBs are increasingly recognized as another common manifestation of SVD, and its cognitive significance has brought much attention. CMBs might be an additional risk factor for vascular cognitive impairment (VCI). Initial study investigated the cognitive significance of CMBs in a group of stroke patients. The presence of CMBs was the only independent predictor of executive dysfunction. By the way, CMBs were predominantly located in the frontal lobes and basal ganglia in those individuals with impaired executive function in that study (Werring et al., Reference Werring2004). However, such researches on SVD patients are not only few but also with discordant results yet (van Norden et al., Reference van Norden, van den Berg, de Laat, Gons, van Dijk and de Leeuw2011; Gregoire et al., Reference Gregoire2013; Lawrence et al., Reference Lawrence2013; Patel et al., Reference Patel2013).
In this study, we investigated cognitive significance of parenchyma lesions in a cohort of post-stroke non-dementia SVD patients, by using the most sensitive MRI measurement of CMBs to date – Enhanced T2*-weighted angiography (ESWAN) three-dimensional gradient recalled echo (3D-GRE) sequence, along with the DTI for direct assessment of WM connectivity and volumetric MRI measurements of the brain.
Materials and methods
Participants
Consecutive SVD patients were recruited from the stroke clinic at the Department of Neurology, RenJi Hospital, which is affiliated with Shanghai Jiao Tong University School of Medicine, between May 2013 and July 2014. Those are lacunar stroke syndrome patients with evidence of an anatomically responsible lacunar infarct on MRI, as well as confluent leukoaraiosis (Fazekas grade 2 or more) on MRI (Fazekas et al., Reference Fazekas, Chawluk, Alavi, Hurtig and Zimmerman1987). The patients had experienced a clinical lacunar stroke at least three months prior to recruitment. The average time from stroke to research MRI is 105.6 days (from 92 to 128 days, with standard deviation of 10.7 days). All participants were examined physically and neuropsychiatrically after the recruitment. All patients underwent laboratory examinations to exclude systemic or other neurological diseases. Patients with the following diseases or conditions were excluded: cardioembolic source or large vessel disease (>50% stenosis in extra- or intra-cerebral arteries), severe systemic diseases or other diseases that may cause cognitive dysfunction (such as uncontrolled B12 deficiency or thyroid disease), cortical and/or cortico-subcortical non-lacunar infarct, WMLs of other specific causes, other major central neurological system disorders, and major psychiatric disorders (except depression). In addition, patients with less than six years of education, yet meeting the criteria of dementia, (American Psychiatric Association, 2000) were excluded. Those with severe claustrophobia or contraindications to MRI examination (e.g. pacemakers, metallic implants) were also excluded. A total of 91 SVD patients were screened, among which 73 volunteered to participate. Among the participants, five patients could not complete MRI, two patients were found with MRI protocol deviation, five patients did not finish the psychological testing, and six patients withdrew their consents afterwards. As a result, a total of 55 patients were recruited and completed the protocol. These patients were further divided into two groups based on their cognitive status, i.e. no cognitive impairment (NCI) (n = 23), vascular mild cognitive impairment (VaMCI) (n = 32). The research ethics committee of RenJi hospital affiliated to school of medicine of Shanghai Jiao Tong University approved the study protocol, and written informed consent was given by every subject.
Vascular risk factors
In this study, hypertension was defined as systolic blood pressure ≥140 mm Hg or diastolic blood pressure ≥90 mm Hg, or a history of hypertension as reported by the subject or indicated by anti-hypertensive therapy. Hypercholesterolemia was defined as total cholesterol ≥240 mg/dL or low-density lipoprotein cholesterol ≥160 mg/dL, and/or the use of a cholesterol-lowering medication for it. Diabetes mellitus was defined as fasting blood glucose ≥126 mg/dL (7.0 mmol/L), random blood glucose level ≥200 mg/dL (11.1 mmol/L), or reported treatment for diabetes mellitus. A current smoker was defined as a person who smoked ≥6 days per week in the last six months.
MRI protocol
All scans were acquired on a GE Signa HDxT 3.0T MRI scanner (General Electric Medical System, Milwaukee, WI, USA) with a standard 8-channel head coil with foam padding. The following MR images were obtained: (1) axial T1-weighted fast field echo sequences: TR = 331 ms, TE = 4.6 ms, FOV = 256 × 256 mm2, slice thickness = 4 mm, gap = 0, slices = 34, matrix = 512 × 512; (2) axial T2-weighted turbo spin echo sequences: TR = 3,013 ms, TE = 80 ms, FOV = 256 × 256 mm2, slice thickness = 4 mm, gap = 0, slices = 34, matrix = 512 × 512; (3) fluid attenuated inversion recovery (FLAIR) T2-weighted imaging: TE = 150 ms, TR = 9,075 ms, matrix = 256 × 256, FOV = 256 × 256 mm2, thickness = 2 mm, NEX = 1, gap = 0, FA = 90°, TI = 2,250 ms, slices = 66; (4) 3D-spoiled grass gradient recalled (3D-SPGR) images were acquired for anatomical reference with the following parameters: TR = 6.1 ms, TE = 2.8 ms, slice thickness = 1 mm, gap = 0, FA = 15°, FOV = 256 × 256 mm2, matrix = 256 × 256, slices = 166, and scan time = 334 s; (5) spin-echo single shot echo-planar pulse sequence: TR = 17,000 ms, TE = 85.5 ms, matrix = 128 × 128, FOV = 256 × 256 mm2, NEX = 1, slice thickness = 2 mm, gap = 0. The diffusion-sensitizing gradients were applied along 20 non-collinear directions with a b value of 1,000 s/mm2, together with an acquisition without diffusion weighting (b = 0); scan time = 374 s; and (6)ESWAN 3D-GRE: TE = 23.93 ms, TR = 53.58 ms, FA = 20°, matrix = 320 × 288, FOV = 240 × 240 mm2, slice thickness = 2 mm, NEX = 0.7, gap = 0, slice = 72.
MRI analysis
Dti analysis
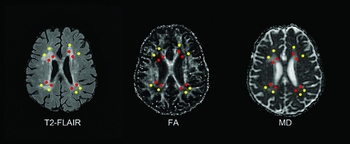
All diffusion parameters for the identified regions of the brain were initiated from a user-defined “seed” region of interest (ROI). The placement of the ROIs was chosen according to the structure that we investigated and guided by the knowledge coming from the previous studies (Huynh et al., Reference Huynh2008), by a trained neuroradiologist (X.C.). Briefly, equal-sized ROIs (3 × 3 pixels) were placed in pre-specified periventricular and central semiovale locations in every patient. The WM between the ventricle and the overlying cortex was bisected by an imaginary line. The half closer to the ventricle was defined as the “periventricular region,” the half lateral to the imaginary line was defined as the “central semiovale region.” The slice including the anterior horns and the posterior horns of the lateral ventricles was chosen based on those regions where WM changes were most frequently seen on T2 FLAIR image. A total of eight periventricular ROIs were placed around the lateral ventricles: four surrounding the frontal horns and four surrounding the posterior horns. Eight central semiovale ROIs were then placed within the adjacent WM lateral to the imaginary line on the same slice. ROI placements were located on T2 FLAIR lesions, further verified by the experienced neuroradiologist (Y.Z.) to ensure that no CSF or grey matter (GM) structures were included. To minimize partial volume effects, we placed ROIs at least 2 mm from tissue boundaries. Images were realigned to remove eddy current distortions. The placement of ROIs was shown in Figure 1, and the relevant stroke lesions (if existed) were avoided when we made the selection. Then, fractional anisotropy (FA) and mean diffusivity (MD) of the ROIs were studied using the “tract statistics” function of DTI Studio (Processing Tools and Environment for DTI, ver. 2; H. Jiang and S. Mori), which allows a statistical evaluation of the diffusion parameters of the ROIs. Finally, a further quantitative analysis (FA, MD) of the identified ROIs was performed.
Region-of-interest (ROI) technique for DTI determination. Positions of ROIs were placed on T2 FLAIR image (left). Four ROIs are drawn adjacent to each ventricle for a total of eight periventricular ROIs (marked as red dots). Four further ROIs were placed within the adjacent white matter lateral to an imaginary line between the ventricle and overlying cortex for a total of eight central semiovale ROIs (marked as yellow dots). ROIs were then superimposed in identical positions on fractional anisotropy maps (middle) and mean diffusivity map (right).

Next, the FA and MD values of periventricular as well as central semiovale were generated by averaging the measurements of eight respective ROIs. Finally, subcortical FA and MD values were computed by averaging the values of periventricular and central semiovale.
Test–retest reliability was rated in 15 random samples, which yielded an intra-class correlation coefficient (ICC) of 0.773 for periventricular FA, 0.727 for central semiovale FA, 0.738 for periventricular MD, and 0.837 for central semiovale MD.
Assessment of brain atrophy
In-house software based on a homemade program of Matlab was then used to calculate the total voxels of the intracranial volume (ICV).
T1-weighted structural images were segmented into tissue probability maps for GM, WM and cerebro-spinal fluid (CSF) components using the segment function of the Statistical Parametric Mapping (SPM) package (version 8; Wellcome Department of Cognitive Neurology, London; http://www.fil.ion.ucl.ac.uk/spm). The volume of the GM and WM were calculated by the Matlab. The parenchyma volume is the total volume of GM and WM. ICV was used for normalizing the volume of GM, WM, and parenchyma.
Assessment of CMBs
We used the ESWAN processing toolbox available with Functool software version 9.4.05a (GE workstation Advantage Windows 4.4).
CMBs were defined as rounded, hypointense homogeneous foci of up to 10 mm in size on ESWAN sequences. Lesions in sulci probably representing flow voids from vessels and lesions in the globus pallidus, supposedly representing iron or calcium deposits, were not considered. Choroid plexus and pineal calcifications were not considered either, as these were lesions suggestive of partial-volume effects. We adopted the Microbleed Anatomical Rating Scale (Gregoire et al., Reference Gregoire2009) for the measurement of CMBs. The assessment of CMBs was performed according to their anatomic location (lobar or non-lobar). Lobar CMBs were allocated to one of five lobes: frontal, parietal, occipital, temporal, and insular. CMBs in the basal ganglia, thalamus, internal/external capsule, corpus callosum, and deep and periventricular WM were scored as deep CMBs. CMBs in the brainstem and cerebellum were scored as infratentorial CMBs. The CMBs with the location of deep or infratentorial were defined as non-lobar CMBs. CMBs were rated by two trained raters (X.C and Y.W), in 15 random samples; intra- and inter-rater reliability yielded an ICC of 0.872 and 0.885 for total number of CMBs, 0.775 and 0.957 for lobar CMBs, 0.755 and 0.941 for infratentorial CMBs, and 0.870 and 0.813 for deep CMBs.
Neuropsychological assessment
Neuropsychological assessments were completed within one week after the MRI examination. None of the subjects suffered a new clinical stroke or TIA between the time of MRI examination and the assessment. A comprehensive battery of neuropsychological tests was designed to include tests of all cognitive domains. The battery consisted of the following assessments: Trail-making test, Stroop color-word test and category verbal fluency test for attention and executive function, Rey auditory verbal learning test short-delay and long-delay free recall for memory, 30 words of the Boston naming test for language, and Rey-Osterrieth complex figure test copy ability for visuo-spatial function.
Functional and psychiatric assessment
The National Institutes of Health Stroke Scale (NIHSS) was used to assess neurological status. Functional status was assessed by administering the Katz basic activities of daily living (ADL) and Lawton and Brody instrumental ADL scales to the patients’ primary caregivers. These scales included six basic items and eight instrumental items. Four levels of grading of ADLs were adopted (1 = independent; 2 = need for supervision; 3 = need for help, and 4 = unable) for assessment. The total scores ranged from 14 to 56. Depressive symptoms were assessed by the Hamilton Depression Rating Scale (HDRS) (17 items). Depression was defined as HDRS>7.
A cognitive diagnosis was assigned to each subject according to certain criteria. A diagnosis of NCI was made if a patient's scores for all neuropsychological tests were within the normal range. A diagnosis of VaMCI was based on the following: (1) basically normal ADL or impaired ADL that could not be attributed to cognitive disability, (2) failure to meet the criteria for dementia, and (3) mild quantifiable cognitive impairment within one or more domains (i.e. attention-executive function, memory, language, visuo-spatial function).The norms used were based on mean scores of each measurement from a sample of typical, elderly community members in Shanghai, China (Guo et al., Reference Guo, Sun, Yuan, Hong and Lu2007). We defined cognitive impairment as a score of 1.5 standard deviations below the mean on any neuropsychological test. Because some of the patients had a degree of disability due to stroke, we carefully determined which part of the disability was cognitive and which was due to the motor sequelae. Taking transportation as an example, if the subject is mobile outside of the home with only physical help (a walker, a wheelchair, or even a hand by a caregiver), he/she is cognitively independent; if the subject still needs help for orientation, he/she is rated as cognitively disabled. These determinations were based on patient history and clinical judgment, i.e. the degree of disability present at the onset of the cognitive impairment or the synchronicity of the cognitive impairment progression with the disability progression. In cases in which disability started at the time of appearance of cognitive impairment – and worsened synchronically with deterioration of cognition – it was determined that the disability was causally related to the cognitive impairment, and thus the patient could not be diagnosed as a case of VaMCI. The detailed protocol has been presented in our previous study (Xu et al., Reference Xu2010).
Data analysis of neuropsychological tests
To allow the direct comparison of different tests, we generated Z scores for the neuropsychological measures. A Z score defines where a score falls in the distribution of scores in norms (a Z score of +1.0 corresponds to a score of 1.0 standard deviation above the mean). Raw scores for each of the neuropsychological tests were Z transformed. Next, the Z scores for each domain were generated by averaging the Z scores of their respective tests.
Statistical analysis
The statistical analyses were performed with SPSS version19.0. Baseline characteristics were presented as means ± SD for normalized distribution parameters. For the skewed distributed parameters, the median and inter-quartile range was calculated. A one-way analysis of variance or nonparametric Mann–Whitney U test was used to examine the differences in MRI indices, age, education, HDRS scores, NIHSS, ADLs scores, neuropsychological Z scores between the groups, depending on nature of the data. Pearson's χ 2 test was used to determine the group differences for gender, depressive state, as well as for each of the vascular risk factors (VRFs). Age, sex, education, statistically significant VRF(s), and depressive state were introduced into regression analysis as the confounders. Models including each MRI measure and the confounders were analyzed first by forced introduction method to determine the significant MRI measures for cognition. Then, the significant MRI variables (site-specific, not including total subcortical DTI measurements and whole brain CMBs counts) together with the above five confounders for each cognitive domain were selected to enter the secondary stepwise regression model. We only choose site-specific MRI indices because they would show the direct associations between regions of the damage and cognitive impairment. Variables would also be selected based on their biological value. A two-tailed p value of < 0.05 was considered statistically significant for all analysis. Blom rank transformations were used to achieve normalized distribution of the skewed visuo-spatial cognitive Z scores in the regression analysis. For stepwise regression analysis, α = 0.05 was chosen for entry and β = 0.10 for exclusion. Intra-rater, inter-rater reliability of CMBs measurements, and test–retest reliability of DTI measurement were determined by means of ICC.
Results
Demographic and clinical characteristics
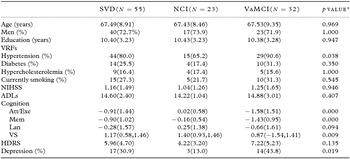
Participants’ demographic and clinical information is listed in Table 1. The average age of SVD participants was 67.49 years, and the majority of participants were male (72.7%). No significant difference was found between the two groups with respect to variables such as gender, years of education, NIHSS, HDRS, and ADLs scores. The prevalence of hypertension in VaMCI patients was higher than cognitively normal patients (p = 0.038), whereas no significant difference was found between the two groups among other VRFs. The two groups differed significantly on Z scores of all cognitive domains (p < 0.01 for attention/execution, memory and visuo-spatial function) despite language function (p = 0.094). There were more depressive patients in the VaMCI group compared with the NCI group (p = 0.019).
Demographic and clinical characteristics of patients with SVD

SVD: small vessel disease; VRFs: vascular risk factors; NCI: no cognitive impairment; VaMCI: vascular mild cognitive impairment; ADLs: activity of daily living scale; NIHSS: national institute of health stroke scale; HDRS: Hamilton depression rating scale; Att/Exe: attention/executive function; Mem: memory; Lan: language; VS: visuo-spatial function.
aComparison of Cognition (except for skew distributed visuo-spatial function) was controlled by age, sex, education, VRFs, and depression. Visuo-spatial Z scores were expressed as median (1st quartile, 3rd quartile), and use Mann–Whitney non-parametric examination for comparison. Analysis of NIHSS and ADLs were controlled for age, sex, and VRFs. Analysis of HDRS was controlled for sex, age, education, and VRFs.
Neuroimaging findings
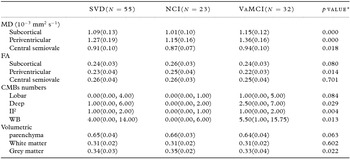
Group differences of neuroimaging parameters between NCI and VaMCI patients are listed in Table 2.
MRI parameters of patients with SVD

SVD: small vessel disease; NCI: no cognitive impairment; VaMCI: vascular mild cognitive impairment; MD: mean diffusivity; FA: fractional anisotropy; CMBs: cerebral microbleeds; WB: whole brain; IF: infratentorial.
aCMBs numbers were expressed as median (1st quartile, 3rd quartile), and use Mann–Whitney nonparametric examination. DTI indices were analyzed after controlled for age, sex, and vascular risk factors. Atrophic parameters were normalized by intracranial volume and analyzed after controlled for age, sex, and vascular risk factors.
Diffusion tensor imaging
Among SVD participants, MD revealed significant differences between the two groups either within periventricular (p < 0.01) or within the centrum semiovale (p < 0.05) WM. Higher MD within the subcortical region was found in VaMCI patients than in NCI patients (p < 0.01). However, as for FA, difference was only found within periventricular WM between the two groups (p < 0.05).
CMBs
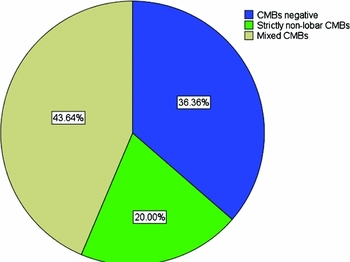
Distribution pattern of CMBs was shown in Figure 2. At least one CMBs was identified in 35 patients (63.6%). No patient had strictly lobar CMBs, 11 patients (31.4%) had strictly non-lobar CMBs, whereas 24 patients (68.6%) had mixed (lobar with non-lobar) CMBs. Among them, deep CMBs were found in 28 (80.0%) and infratentorial in 29 (82.6%). The whole brain CMBs count in VaMCI group was higher than those of the NCI group (p = 0.013). The significant group difference existed also topographically, in the infratentorial (p = 0.004), in the deep CMBs count (p = 0.029), but not within the lobes.
Presence with the distribution pattern of CMBs in SVD patients. The presence and the distribution characteristics of CMBs were expressed by the percentage rate of the total SVD participants. CMBs: cerebral microbleeds; SVD: small vessel disease; mixed CMBs: lobar with non-lobar CMBs.

Brain atrophy
The GM volume of VaMCI was lower than that of NCI patients (p = 0.022). However, there was no significant difference between the two groups in WM volume as well as in parenchyma volume (p = 0.602, p = 0.063).
MRI predictors for the cognition
-
1. Univariate predictor analysis
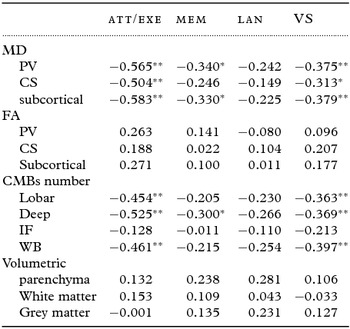
Standard regression coefficients between DTI measurements and the cognition are listed in Table 3. The stronger associations of MD with the cognition were for the attention-executive function, compared to that with the memory and the visuo-spatial function. However, no DTI measurements were related to language function, also FA did not show any relationship with any of the cognitive function.
Univariate predictor analysis between MRI indices and the cognition in SVD patients

Standard regression coefficients between MRI measurements and the cognition are listed in the table. SVD: small vessel disease; MD: mean diffusivity; FA: fractional anisotropy; CMBs: cerebral microbleeds; Att/Exe: attention/executive; Mem: memory; Lan: language; VS: visuo-spatial; PV: periventricular; CS: central semiovale; IF: infratentorial; WB: whole brain.
Z scores of visuo-spatial function is Blom rank transformed to achieve normalized distribution in regression analysis. Age, sex, education, hypertension, and depressive state were introduced into regression analysis as the confounders. Intracranial volume was used for normalization of atrophic indices. *p < 0.05, **p < 0.01.
Standard regression coefficients between CMBs numbers and the cognition are listed in Table 3. Either attention-executive function or visuo-spatial function was found to be correlated with the numbers of each location, except the infratentorial region, memory function was found to be correlated with the deep numbers. Likewise, language was not found to be correlated with the numbers within any of the cerebral regions.
No relationship was found between brain atrophic indices and the cognitive function.
-
2. Multivariate predictor analysis
Multivariate regression was not performed on language because no MRI index was found to be associated with it in single predictor analysis. By the way, although none of the atrophic variables were significant in the first regression (Table 3), we also choose GM volume (which showed significant difference in group comparison and is considered as an important factors in cognition in previous VCI studies) (Ritchie et al., Reference Ritchie2015) as one of the candidate variables into the second regression model. The regression models provided a significant fit for the rest of the cognitive domains (for attention-executive and visuo-spatial, p < 0.01; for memory, p < 0.05). Stepwise algorithm chose periventricular MD (β = −0.457, p < 0.01) and deep MBs numbers (β = −0.352, p < 0.01) as the predictors of attention-executive function, which explained 45.2% of the total equation variance. Periventricular MD was also found to be the independent predictor for either memory (β = −0.314, p < 0.05) or visuo-spatial function (β = −0.375, p < 0.01). However, only small proportion of variance could be accounted for (9.8% and 12.4%, respectively). Beta (β) is the standardized regression coefficient of the variables in the models (listed in Table 4).
Multivariate predictor analysis between MRI indices and the cognition in SVD patients

SVD: small vessel disease; DTI: diffusion tensor imaging; CMBs: cerebral microbleeds; MD: mean diffusivity; Att/Exe: attention/executive; Mem: memory; Lan: language; VS: visuo-spatial; NA: not applicable.
Z scores of visuo-spatial function is Blom rank transformed to achieve normalized distribution in regression analysis. Age, sex, education, hypertension, and depressive state were introduced into regression analysis as the confounders. Beta (β) is the standardized regression coefficient of the variables in the models. R 2 is the R square of the regression model.
Discussion
A typical phenotype cohort of SVD patients were recruited in this study. Only non-dementia SVD individuals were recruited and we did not include normal subjects as the control group. Instead, we compared the clinical aspects between two groups of SVD patients with different cognitive status. VCI associated with SVD is thought to be a progressive condition from normal cognitive status to frank dementia (Pantoni et al., Reference Pantoni, Poggesi and Inzitari2009), and the primary purpose of this study is to investigate the surrogate markers of early development of VCI in SVD subjects. A wide range of possible MRI substrates of cognition were considered: the numbers of CMBs in different cerebral locations, the DTI measurements of the WM, the volume of the parenchyma as well as segmentation to WM and GM. We did not include traditional MRI ischemic markers (such as lacunar infarcts and leukoaraiosis) because DTI is thought to be a more direct and sensitive MRI measurements of WM (Xu et al., Reference Xu2010).
A characteristic cognitive profile was seen in this cohort. Multiple domains of cognition (except for the language) were affected in early stage of VCI, particularly the attention-executive function. Hypertension and depression were detected more often in cognitive impaired patients. The predictors of the main cognitive domains were analyzed, respectively. Demographic (age, gender and education), significant VRF (hypertension), and depressive state were included as clinical confounders. It was found that deep CMBs counts and periventricular WM MD are the two independent predictors of attention-executive function in non-dementia SVD patients.
CMBs manifest as small, focal, homogeneous lesions on MRI sequences such as T2*-weighted GRE and T2*-weighted angiography (SWAN). There are two main types of CMBs vascular pathology: arteriolosclerosis and cerebral amyloid angiopathy (CAA) (Pantoni, Reference Pantoni2010). Evidence from clinicopathological and epidemiological studies indicated that different distribution patterns of CMBs may denote the underlying etiology. Lobar CMBs have been attributed to CAA, which is also known as a pathological hallmark of Alzheimer's disease (AD) (Pettersen et al., Reference Pettersen2008), whereas CMBs located in the deep/infratentorial regions (with or without lobar CMBS) have been associated with hypertensive microangiopathy (Poels et al., Reference Poels2010). As both entities are associated with age, they frequently coexisted in elderly individuals. In our study, a group of strictly defined SVD patients was recruited, among which 80% had a history of hypertension. CMBs were detected in more than 60% of the participants. All of them may be attributed to arteriolosclerosis, with pure (11/35) or mixed (24/35) etiology as judged by their distribution patterns.
Although CMBs is one of the MRI markers for SVD (Pantoni, Reference Pantoni2010), it has yet to be clarified whether or not CMBs can be regarded as an independent and direct substrate for cognitive impairment, which can be denoted by the correlation of the CMBs locations with the specific cognitive domains. Histopathologic studies have shown that CMBs may have a direct effect on surrounding or connected brain regions. This is supported by recorded tissue necrosis. However, other studies indicated that CMBs may be just the marker of co-existed SVD or degenerative lesions instead of the causal factor itself (Werring et al., Reference Werring, Gregoire and Cipolotti2010). Previously, Gregorie suggested an indirect link between CMBs and cognitive impairment (Gregoire et al., Reference Gregoire2013) because executive impairment was associated with strictly lobar (parieto-occipital lobes and insula, but not deep) CMBs in stroke or transient ischemic attack (TIA) patients. In another study, Van Norden found that CMBs were related to the cognition of multiple domains in non-dementia SVD patients (van Norden et al., Reference van Norden, van den Berg, de Laat, Gons, van Dijk and de Leeuw2011), and the relationship was mainly driven by lobar CMBs, but by deep located CMBs to a lesser extent. In Gregorie's study, only 35.9% (115/320) of the subjects are etiologically due to small-artery occlusion, whereas the Van Norden's study only recruited participants with mild SVD lesions. The MRI inclusion criteria are the presence of lacunar infarcts and/or WML. And 34.2% of the subjects had lacunar infarcts detected on MRI, and the median WML volume was only 7.1 ml per person in the latter study. However, in Patel et al. (Reference Patel2013) and this study, well-defined phenotype SVD patients were included by comparable MRI criteria. Whole brain CMBs counts was weakly associated with executive dysfunction and worked in a threshold mode in Patel's study, with the association driven by subjects with high CMBs counts, whereas a distinct linear correlation between deep CMBs counts and the attention-executive function was found in our cohort. Both studies have controlled for DTI parameters, which are better markers of WM damage. It has been suggested that the effect of CMBs may be masked by the advanced co-existing pathologic lesions damaging the cognitive network in Patel's studies (Patel et al., Reference Patel2013), which dementia patients may also include in, thus creates a threshold effect of CMBs. In another study, Seo et al. (Reference Seo2007) recruited a cohort of SVD dementia patients, and it was found that CMBs were most commonly distributed in the cortex, as well as that the number of CMBs was an independent predictor of cognitive impairment in multiple domains. This added the evidence that the mixed and advanced pathologies are common in SVD, especially in the late stage. In contrast, the exclusion of dementia patients may allow us to include patients with less co-existing pathology. In addition, more patients were detected with CMBs presence in our study (63.6%) compared to Patel's (39.7%). From these studies, we can infer that in the sporadic SVD population at various stages in a progressive course, CMBs cause cognitive dysfunction in a complex interplay pattern with coexisting vascular or degenerative lesions. For this reason, the relationship between cognition and CMBs was found to be discordant. Recently, the total MRI load (lacunes, leukoaraiosis, CMBs, and perivascular spaces) of SVD was measured by Staals using the semi-volumetric scale in healthy old participants (Staals et al., Reference Staals2015). It was found that the total MRI load score was associated with general cognitive state but not with executive processing speed, whereas an association was present between WM hyperintensities (WMH) (Fazekas score) separately and processing speed (results not shown). It suggested a more heavy reliance of executive ability on WMLs, and different SVD features may disrupt brain tissue and cognitive pathways in different extents. However, the distinct correlation between executive function with deep subcortical CMBs was demonstrated in this study, even controlled for WM DTI parameters. This may be attributable not only to the population settings but also to the investigating method. It should be mentioned that the ESWAN technique we adopted may improve the detection of CMBs, compared with T2*-weighted imaging in the previous studies (Guo et al., Reference Guo, Wang, Zhu, Liu and Cui2013). If CMBs are part of the same spectrum of disease, this may be way forward, as many of these will not only affect micro-architecture of subcortical WM, but also by other mechanisms independently.
In this study, another independent predictor for executive function was periventricular WM diffusivity, which is a more sensitive index than deep CMBs counts. This finding is consistent with the previous studies (Xu et al., Reference Xu2010). It added more evidence that WM tract damage results in a “dysexecutive syndrome” owing to disruption of cortical–subcortical and cortical–cortical connections in SVD (Tekin and Cummings, Reference Tekin and Cummings2002). As found in other studies, the associations with the cognition were stronger and more consistent for diffusivity than for FA (Lawrence et al., Reference Lawrence2013). Furthermore, periventricular diffusivity appears to be the independent predictor for memory or visuo-spatial function, although to a lesser extent. It has been suggested that the executive and memory dysfunctions in SVD patients were independently caused by the disruption of WM integrity (Xu et al., Reference Xu2010; van der Holst et al., Reference van der Holst2013). Recently, default mode network analysis suggested that abnormal EEG activity in the mapping of parieto-occipital, fronto-parieto-occipital may reflect early executive and visuo-spatial dysfunction in SVD (Sheorajpanday et al., Reference Sheorajpanday2013). Hence, it is reasonable to deduce that disruption of WM integrity, which causes the cerebral network disconnection, may contribute to the multiple domains of cognitive impairment in SVD. Another finding is that the cognitive function was associated with periventricular rather than centrum semiovale MD. It has been suggested that this may related to the fact that the periventricular area has a high density of long associating fibers, which connect the cortex with subcortical nuclei and other distant brain territories, whereas centrum semiovale contains more short associating fibers that link adjacent gyri (De Groot et al., Reference De Groot2002). In this study, language is not related to the integrity of subcortical structures and showed no difference between different cognitive states in this study, as found in previous studies (Votaw et al., Reference Votaw1999).The location of damage may be important for understanding of mechanisms in SVD (Smith et al., Reference Smith2010). Therefore, we adopted ROI rather than a whole brain measurement because it may help us focus on the primarily injured WM regions in SVD, especially in the early stage.
For cerebral atrophic measurements, only GM volume was found lower in cognitively impaired subjects. Brain parenchyma volume, WM, or GM volume was not related to cognition in SVD. Atrophy has been suggested as an important measure to assess the burden of vascular damage in the brain in imaging studies (Aribisala et al., Reference Aribisala2013). Recently, in a large cohort of community aged population, Ritchie et al. (2015) found that total grey and normal appearing WM volumes correlated positively with all cognitive factors, whereas a negative correlation was found for WMH. In our study, none of the global atrophy measurements was observed to be the early cognitive surrogate marker in SVD. Previous SVD study reported that hippocampal volume was most effective in differentiating normal and cognitively impaired cases, whereas GM volume was a more important determinant of impaired versus demented (Mungas et al., 2001). However, we did not investigate the focal atrophic parameters, such as hippocampal volume in this study.
Several limitations are worth of mention. First, the sample size is small and majority of our subjects are male, thus the findings of this study might not be generalized to the whole population. Second, we did not adjust for the presence of concomitant AD pathology in this study. Therefore, we cannot elucidate the complex interplay mechanism of cognitive impairment between vascular and degenerative lesions in SVD. Third, because it was a cross-sectional study, we are unable to conclude that deep CMBs and subcortical WM diffusivity predict cognitive impairment through a continuum of VCI progression in SVD patients. Fourth, the regression method may introduce bias into this small sample. Hence, longitudinal studies with larger sample, which account for both vascular and neurodegenerative pathological changes in patients, are needed for further investigation into the underlying mechanism of cognitive impairment in SVD.
Conclusions
In this study, deep CMBs numbers were found to be correlated with the attention-executive dysfunction independently in non-dementia SVD patients. Such anatomic correlation between the distribution of CMBs and the affected cognitive domains may suggest a potential detrimental mechanism of CMBs. The periventricular WM diffusivity seems to be responsible for a broad spectrum of cognitive impairment, particularly the attention-executive function. Our findings indicate that arteriosclerotic CMBs possibly cause disruption of subcortical neural networks relevant to attention-executive function itself, which is superimposed on the effects of co-existed lesions in the early stage of VCI in SVD. Therefore, CMBs may be regarded as one of the independent surrogate cognitive markers in SVD patients.
Conflict of interest
None.
Description of authors’ roles
Wen-wei Cao and Yao Wang were responsible for carrying out the statistical analysis and wrote the paper. Quan Dong, Xue Chen, Li Gao, Ye Deng collected the data. Yan-sheng Li assisted with writing the article. QunXu and Yan Zhou designed and carried out the study and supervised the article writing. Wen-wei Cao, Yao Wang, Qun Xu, and Yan Zhou contributed equally to this work.
Acknowledgments
This study was supported by grants from the National Key Research and Development Program of China (2016YFC1300600) and the Medical Guide Project of Shanghai City Committee of Science and Technology (14411964400).