I. INTRODUCTION
Large area solar energy conversion is possible using organic photovoltaic (OPV) cells due to the availability of low cost and sustainable energy materials sources. Blends of conjugated polymers and fullerene have been used to produce OPVs from low cost sustainable energy materials sources. Reference Darling, You, Veselka and Velosa1–Reference Yu, Gao, Hummelen, Wudl and Heeger7 OPVs with bulk heterojunction structures consisting of mixtures of P3HT polymers and fullerene based acceptors have recorded efficiency values ranging from ∼6 to 7%. Reference Li, Shrotriya, Huang, Yao, Moriarty, Emery and Yang4,Reference Reyes-Reyes, Kim and Carroll5,Reference Lee, Kim, Shim and Park8 However, these efficiencies degrade with time, making it challenging to adopt OPVs in practical applications. The relatively high hole mobilities of ∼10−4 cm2/(V s) (Refs. Reference Ray and Alam9 and Reference Pandey, Takashima, Nagamatsu, Endo, Rikukawa and Kaneto10) and high electric field mobilities [∼0.1–0.2 cm2/(V s)] Reference Bao, Dodabalapur and Lovinger11–Reference Akogwu, Akande, Tong and Soboyejo14 of bulk heterojunction OPVs have been attributed to improved charge hopping characteristics on the composite bulk-heterojunction structures, Reference Deibel and Dyakonov15 as well as the effects of active layer crystallinity. Reference Pavlopoulou, Kim, Lee, Chen, Facchetti, Toney and Loo16–Reference Shen and O'Carroll21 There is, therefore, a considerable interest in the development of a fundamental understanding of how the structure and morphology of P3HT:PCBM blends contribute to their electrical and optical properties. Reference Lee, Kim, Shim and Park8
Prior work has shown that the application of pressure during fabrication can have a significant effect on the performance of organic optoelectronic devices. These include studies of pressure effects on OPVs Reference Agyei-Tuffour, Rwenyagila, Asare, Oyewole, Zebaze Kana, O'Carroll and Soboyejo22 and organic light emitting devices (OLEDs) Reference Du, Anye, Vodah, Tong, Zebaze Kana and Soboyejo23–Reference Cao, Kim, Forrest and Soboyejo29 that show significant improvements in performance, following the application of pressure during the fabrication of devices on the soft and/or hard substrates. Reference Kim and Forrest28,Reference Guo, Ma and Su31,Reference Tong, Babatope, Admassie, Meng, Akwogu, Akande and Soboyejo32 The improvements in OLED performance have been attributed largely to increased surface contacts that enable improved charge and light transport across interfaces in these structures. Reference Du, Anye, Vodah, Tong, Zebaze Kana and Soboyejo23–Reference Du, Tong, Akande, Tsakiridou and Soboyejo30 Prior works by Loo et al. Reference Pavlopoulou, Kim, Lee, Chen, Facchetti, Toney and Loo16,Reference Hiszpanski, Baur, Kim, Tremblay, Nuckolls, Woll and Loo17,Reference Zhou, Shi, Lv, Chen and Chen33 and Freichet et al. Reference Germack, Chan, Kline, Fischer, Gundlach, Toney, Richter and DeLongchamp18,Reference Woo, Thompson, Kim, Toney and Freichet19 have also shown that the processing of bulk heterojunction layers with controlled crystallinity can be used to improve the efficiencies of bulk heterojunction solar cells. Reference Zhou, Shi, Lv, Chen and Chen33 However, we are not aware of prior work that relates pressure-induced changes in the structure of bulk heterojunction solar cells to their optoelectronic performance.
Hence, the objective of this paper is to relate the pressure-induced changes in the nano- and micro-scale morphologies of blends of P3HT/PCBM to the current–voltage characteristics of bulk heterojunction solar cells. Pressure is applied using soft poly-di-methyl-siloxane (PDMS) stamps to improve the surface contacts, following the fabrication of model bi-layered and multi-layered bulk heterojunction OPV structures. The pressure-induced changes in polymer microstructure are characterized using atomic force microscopy (AFM) and grazing incidence wide angle x-ray scattering (GIWAXS). The implications of the results are discussed for the fabrication of bulk heterojunction OPVs with improved efficiencies.
II. MATERIALS AND METHODS
A. OPV device fabrication and characterization
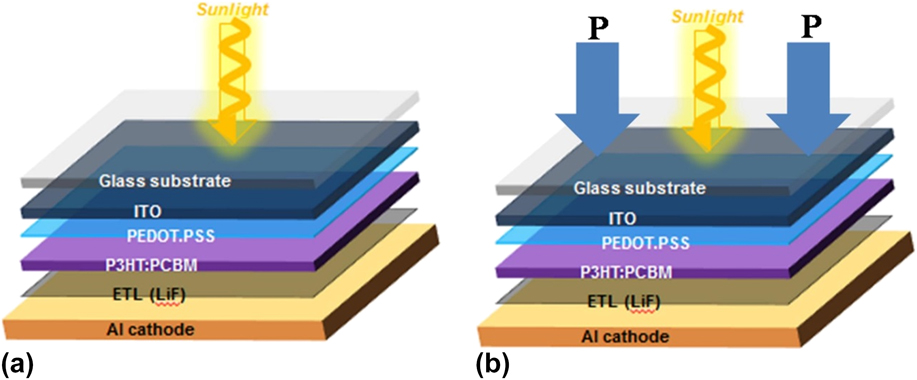
Single layer bulk heterojunction OPV devices (Fig. 1), with P3HT:PCBM active layers, were fabricated from patterned ITO/glass substrates, (Sigma Aldrich, St. Louis, MO, R s of 8–12 Ω/sq, and 120 nm thick). The ITO patterned substrate was washed for 10 min in a sparkleen detergent, in acetone, and in iso-propanol in succession using the ultrasonicator and finally in the ultra violet ozone cleaning systems (UVOCS: Lansdale, PA). Approximately 40 nm of poly (3,4-ethylenedioxythiophene):poly(styrene-sulfonate) (PEDOT:PSS) was deposited under the conditions of 3000 rpm spin speed for 3 min. The film was dried and baked at 110 °C for 3 min on a hot-plate.
OPV layered structures: (a) without pressure and (b) with pressure. Reference Agyei-Tuffour, Rwenyagila, Asare, Oyewole, Zebaze Kana, O'Carroll and Soboyejo22

P3HT:PCBM blend of concentration, 20 mg/mL (1:1 ratio) in chlorobenzene, was deposited (at 700 rpm spin speed for 3 min) onto the PEDOT:PSS/ITO patterned glass substrates (Rieke Metals Inc. and 1-Material Inc. Canada). The composite film (P3HT:PCBM/PEDOT:PSS/ITO/Glass) was then annealed at 140 °C for 4 min in an argon filled glove box in which the annealing temperature was monitored with a thermoresistor. About 0.2 nm of LiF was thermally evaporated unto the films before a back contact of aluminum films (with thickness of 150 nm) was thermally deposited. The device area of ∼0.105 cm2 was defined with the help of a shadow mask. The PDMS stamps were fabricated by blending the silicone elastomer base with a curing agent in a 10:1 weight ratio (Sylgard 184 Silicone, Dow Corning Corporation, Midland MI). The mixture was thoroughly mixed to ensure that air bubbles were removed and poured into a mold of 30 mm diameter and 5 mm thickness. The mixture was cured in an oven at 100 °C for 35 min. The devices were loaded with PDMS stamp/dead weights and allowed for 5 min and tested. This was repeated for the different pressure values (1, 3, 5, 8, 10, and 15 MPa). In all, eight (8) devices were fabricated for each applied pressure and the current–voltage (I–V) behavior of the devices was recorded before and after the application of pressure.
B. Nano- and micro-structural evolution and polymer chain alignment
The effects of pressure on the nano-/micro-structures of the polymer blends were studied in an argon filled glove box. The polymer blend films on the glass substrate were stacked with PDMS stamp/dead weights for 5 min. This was repeated for the different pressure values (1, 3, 5, 8, 10, and 15 MPa). The pressured films on glass substrate (1 × 1.25 cm) were annealed at 140 °C on a hot-plate.
The changes in the nano-/micro-structures of the films were characterized using the atomic force microscope (AFM: Dimension 3100, Digital Instruments, Nanoscope IV, Bruker, Plainview, NY, USA) and GIWAXS at the Brookhaven National Lab, Upton, NY, USA.
The surface morphological evolutions of the polymer blend films subjected to annealing and pressure was characterized with an AFM. The probes were made of silicon tips and the surface scans of the morphology were acquired over a 3 × 3 µm area in the tapping mode.
Finally, the polymer crystallinity, polymer chain alignments, and the changes in the morphologies of the structures formed were observed in the films that were subjected to annealing and pressure application, prior to GIWAXS experiments at the Synchrotron, X9 undulator. These experiments were conducted with x-ray beams; 13.5 keV of energy, wavelength (λ) of 0.918 Å and an incident angle of 0.12°. The scattering images in (two-dimensions) were captured with a charge coupled device and the GIWAXS detector positioned at 270 mm. Using silver behenate powder as the standard, the acquired data were converted to q-space. Reference Petoukhoff and O'Carroll20,Reference Shen and O'Carroll21
C. Optical characterization of P3HT and P3HT:PCBM films
Photoluminescence (PL), ultraviolet–visible (UV–vis), and Raman spectroscopy techniques were used for the optical characterization of the polymer thin films. The absorption spectra of the pressured and pressure-less films were collected using a UV–vis spectrophotometer (S.I. Photonics, Tucson-Arizona, USA). The (PL) characteristics of the thin films were also characterized using a Nd:YVO4 laser with an excitation wave length of 532 nm. The films were excited in the transmission mode through the glass substrate. An Andor Shamrock SR, 303i imaging spectrophotometer (Belfast, Northern Ireland) was used to collect the PL spectra. The PL spectrum from the glass substrate was subtracted from the measured spectra to obtain the actual PL responses of the deposited thin films. The glass substrate alone was used for control measurements.
The Raman features showing the electronic, morphological, and optical transformations in P3HT and P3HT:PCBM films were studied using a Renishaw InVia spectrometer (Renishaw Plc, Gloucestershire, UK). The films were excited with a 514.5 nm Ar+ laser with an excitation power of 5 mW. The laser exposure time was 10 s for each spectrum that was collected. This was done carefully to avoid laser soaking of the samples.
III. RESULTS AND DISCUSSION
A. Effects of pressure on surface roughness and morphology
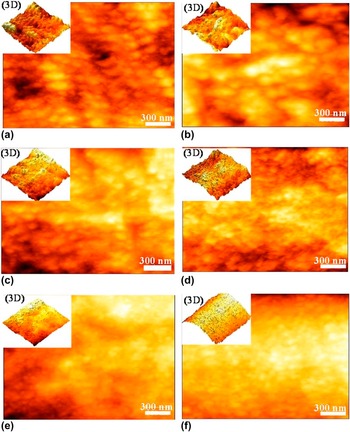
The effects of pressure on the surface morphologies of the films are presented in Figs. 2(a)–2(f) using AFM images of the surfaces subjected to different pressure levels. The images show that the film roughness generally decreased with increased applied pressure. Note that the pressure-less films [Fig. 2(a)] on a glass substrate had high surface roughness (R a) of ∼21.31 ± 0.2 nm. The R a for the pressured films (between 1 and 5 MPa) was ∼16.29 ± 0.5 nm, while that of the films with 8 and 10 MPa pressure were ∼8.25 ± 0.1 nm. Finally, the films produced with applied pressure values of 15 MPa or more had relatively smooth surfaces with R a values of ∼4.42 ± 0.2 nm.
Surface morphology of P3HT:PCBM annealed and pressure assisted films: (a) pressure-less film, (b) 1 MPa, (c) 3 MPa, (d) 5 MPa, (e) 8 MPa and (f) 10 MPa.

Observations from the AFM images show evidence of surface morphological changes with increasing applied pressure. The increased application of pressure appears to reduce surface roughness at the nano- and micro-scales and suggest that, the higher the pressure applied, the smoother the resulting films. The AFM results in Fig. 2 show that the surface contacts depend on the surface roughness and the applied pressures. In the case of rough contact surfaces, multiple surface contacts can occur, giving rise to possible layer sink-in and short circuiting in devices. Such layer sink-ins and partial contacts may degrade the charge transport between adjacent layers. In contrast, the surface morphologies at high applied pressures show relatively smooth surfaces. These should result in improved contacts between adjacent layers that will enhance charge transport across the interfaces. Reference Guo, Ma and Su31,Reference Tong, Babatope, Admassie, Meng, Akwogu, Akande and Soboyejo32
Therefore, the results indicate that, when the pressure applied is low, the morphology is coarser and higher pressures lead to smoother morphologies due to the fact that the polymer chains are stretched and they become orderly aligned. This results in improved crystallinity in the polymer blends.
B. Effects of pressure on absorption, PL, and Raman spectra
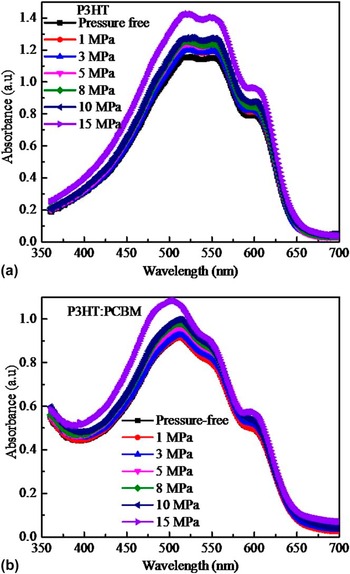
Figure 3 presents the absorbance of the annealed and pressure assisted films. The region of absorption was in the visible range (350 nm < λ < 650 nm) for P3HT and UV range for the PCBM (λ < 350 nm). The blended film (P3HT:PCBM), therefore, exhibited a wide absorption range between that of P3HT and PCBM.
The optical properties and UV–vis absorption spectra of pressure assisted films: (a) P3HT and (b) P3HT:PCBM films.

The absorbance profile gives an indication of the intermolecular arrangements related to the crystalline and amorphous regions of the P3HT polymer. According to Miller et al., Reference Miller, Fanchini, Lin, Li, Chen, Su and Chowolla2 peak positions of ∼515 nm can be linked to the π–π* transition, while peak position of ∼555 and ∼605 nm can be linked to the stacking sequence of the polymer chains. Furthermore, from the Spano's model, Reference Kim and Forrest28,Reference Cao, Kim, Forrest and Soboyejo29 the degree of interactions between the H-atoms in the conjugated polymer affects their crystallinity. Hence, crystalline regions form due to weak interactions and, therefore, the coupling of the polymer chains may produce bands in the absorption spectrum. These bands are a measure of the free exciton bandwidth. Inferences can also be made to determine the conjugation length of an individual polymer chain. Therefore, a reduction in the exciton bandwidth results in increases in the conjugation length and the chain order. The above arguments suggest that, the chain alignments and conjugation lengths of P3HT polymer increase with annealing and the application of pressure (higher crystallinity). However, when P3HT is blended with PCBM, the free exciton bandwidth increases and leads to a reduction in the P3HT conjugation length and ultimately to a quenching of the absorption spectra. Reference Miller, Fanchini, Lin, Li, Chen, Su and Chowolla2,Reference Tremel and Ludwigs34,Reference Bockmann, Schemme, de Jong, Denz, Heuer and Doltsinis35 This indicates that, the two components can interact actively upon blending. This reduces the absorbance of the P3HT/PCBM blend in the pressure-less condition [Figs. 3(a) and 3(b)].
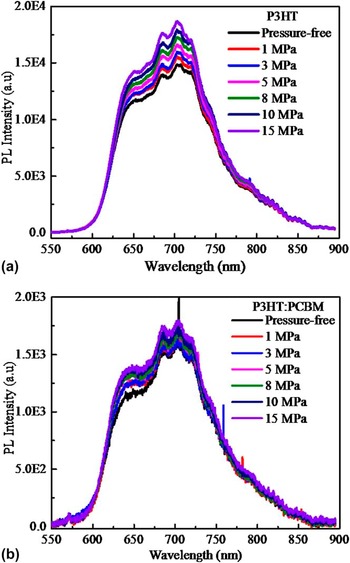
Furthermore, upon the application of pressure, the absorbance of the P3HT and the P3HT/PCBM polymer blends increased with increasing applied pressure [Figs. 3(a) and 3(b)]. Similar trends were also observed in the PL spectra.
P3HT and P3HT:PCBM films subjected to applied pressure is presented in Fig. 4. P3HT exhibits high PL intensity, while PCBM greatly diminishes the PL response [Figs. 4(a) and 4(b)]. The blend of P3HT with the PCBM shows the characteristics PL response of the two components. This is as a result of the increased interactions between the PCBM and the P3HT in the blend. Reference Shaheen, Brabec, Sariciftci, Padinger, Fromherz and Hummelen36,Reference Martens, D'Haen, Munters, Beelen, Goris, Manca, D'Olieslaeger, Vanderzande, De Schepper and Andriessen37 Clearly, the PL intensity for the pressured films increased with increasing pressure. However, the intensities of the polymer blends were weaker than those of pristine P3HT. This was due to the quenching effects of the PCBM.
PL spectra of the P3HT film, the blend film, and the blends with pressure applied films: (a) P3HT and (b) P3HT:PCBM films.

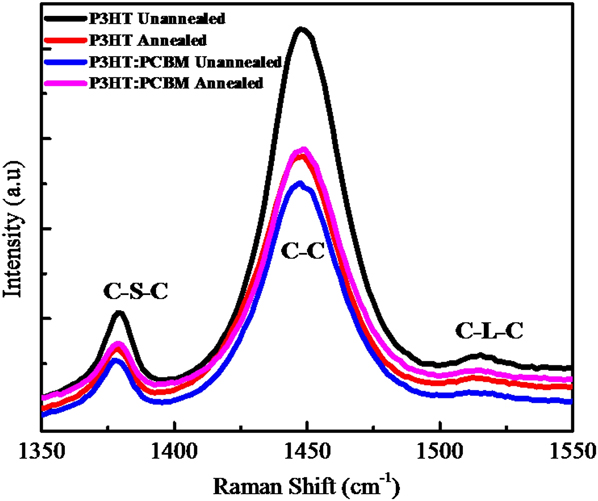
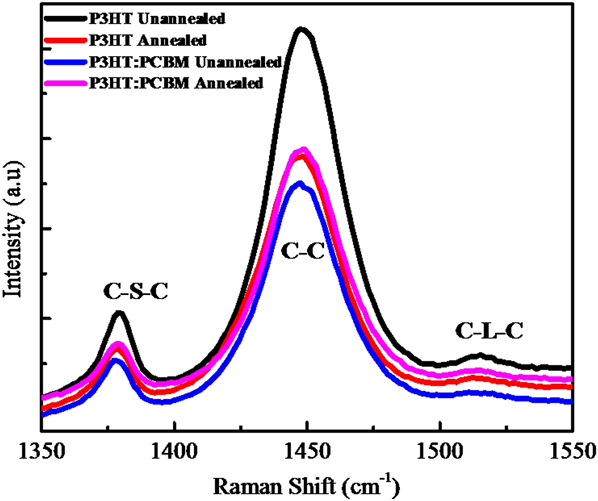
A number of Raman peaks were observed in Fig. 5. The 1380 cm−1 peak corresponds to C–S–C ring deformation, 1440 cm−1 corresponds to C–C bond stretching and 1520 cm−1 peak corresponds to C–L–C ring stretching, respectively. Reference Miller, Fanchini, Lin, Li, Chen, Su and Chowolla2 The scattering modes in the films before and after annealing could be estimated by Gaussian fitting the Raman spectra. Reference Baibarac, Lapkowski, Pron, Lefrant and Baltog38,Reference Klein and Cardona39 Hence, we can infer that annealing and pressure application increases the crystallinity of P3HT:PCBM. This is often observed in P3HT polymer stacking, where there is a segregation of the blend into PCBM-rich regions and the polymer stacking chains. Reference Akogwu, Akande, Tong and Soboyejo14,Reference Klein and Cardona39
Raman spectra of P3HT and P3HT:PCBM films with and without annealing.
C. Pressure effects on polymer chain alignment
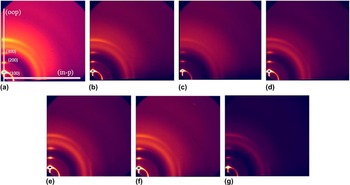
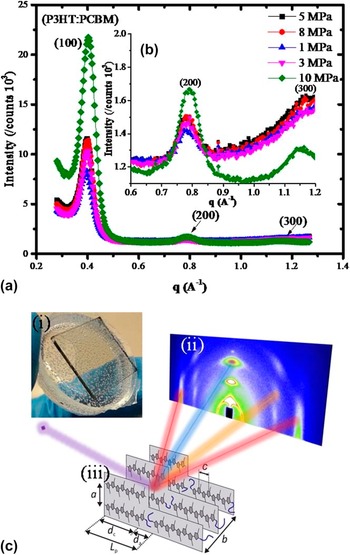
The GIWAXS results obtained from the polymer blends are presented in Fig. 6(a)–6(f) for the different applied pressures. These show three strong reflection spots of P3HT:PCBM blends displayed on the GIWAXS 2D pattern. The diffraction peaks are also shown in the out-of-plane [Fig. 7(a)], the (200) and the (300) peaks in an enhanced mode in Fig. 7(b) and the stacking of the polymer chain in the edge-on configuration in Fig. 7(c). The lattice spacing associated with the crystal orientations for the P3HT:PCBM blends (Fig. 7) show the polymer chain arrangements as well as the π–π* stacking distance in the dominant crystallographic directions; (100) in the out-of-plane and (010) in the in-plane. Reference Shaheen, Brabec, Sariciftci, Padinger, Fromherz and Hummelen36–Reference Chirvase, Parisi, Hummelen and Dyakonov41 The 1D line profiles of the out-of-plane direction identified three profound peaks at 0.408 Å−1, 0.806 Å−1, and 1.215 Å−1 and are assigned, respectively, to the (100), (200), and (300) oriented crystallites of P3HT. There were no identifiable peaks in the in-plane directions of the 1D line profiles.
Two-dimensional GIWAXS images of the P3HT:PCBM films with different pressure application, (a) no pressure, (b) 1 MPa, (c) 3 MPa, (d) 5 MPa, (e) 8 MPa, (f) 10 MPa and (g) 15 MPa.

Line Profiles of the GIWAXS analysis; (a) in-plane profile (b) enhancement in the out-of-plane peaks and (c) schematic representation of the P3HT chains adopting an edge-on orientation. Reference Shen and O'Carroll21,Reference Guo, Ma and Su31,Reference Zhou, Shi, Lv, Chen and Chen33 The inserts show the schematics of the x-ray scattering imaging, the P3HT unit structure and the thin films with PDMS stamps used in the pressure application.

There were no clear shifts in the positions of the reflection peaks with increasing pressure. However, enhanced intensities were observed and varied from ∼500 a.u. to ∼25,000 a.u. for the corresponding pressure range of 0 to ∼15 MPa. This clearly shows that the chains get steadily elongated in the pressure range between 0 MPa and ∼10 MPa. Pressures values greater than 10 MPa increased the intensity levels greatly, implying a higher degree of crystallinity. However, the onset of layer sink-in and device damage is high beyond 10 MPa pressure. Reference Du, Anye, Vodah, Tong, Zebaze Kana and Soboyejo23,Reference Zhou, Shi, Lv, Chen and Chen33
The diffraction patterns shown in the GIWAXS measurements indicate that the polymer chains would align in the edge-on configuration. This is due to the interfacial interactions between the P3HT and the substrate. Reference Shen and O'Carroll21,Reference Guo, Ma and Su31,Reference Tong, Babatope, Admassie, Meng, Akwogu, Akande and Soboyejo32 Therefore, with the relatively high adhesion energy between the substrate (PEDOT:PSS) and the polymer blend (P3HT:PCBM) of ∼2.9 J/m2, Reference Tong, Babatope, Admassie, Meng, Akwogu, Akande and Soboyejo32 our findings confirm that the polymer chains predominantly align in the edge-on orientations. Furthermore, since this chain configuration in the polymer promotes hole transport, Reference Guo, Ma and Su31,Reference Zhou, Shi, Lv, Chen and Chen33 the application of pressure can be adopted (during OPV fabrication) to improve the elongation of the polymer chains and current–voltage characteristics of the bulk heterojunction OPVs. The current–voltage characteristics are discussed in Sec. III. D.
D. Current–voltage characteristics of pressure assisted P3HT:PCBM-based OPVs
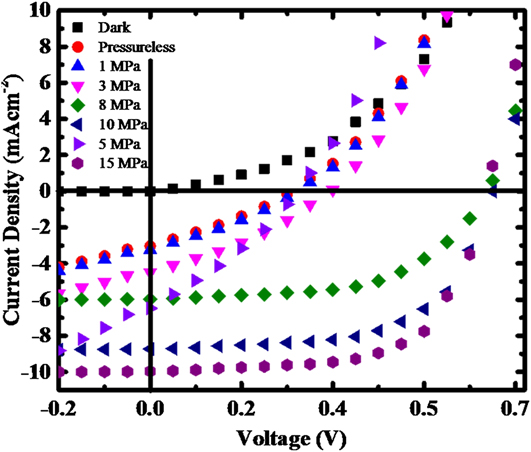
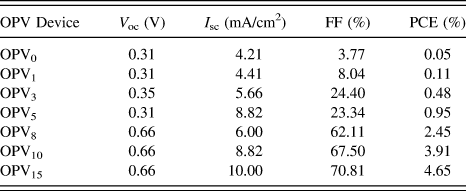
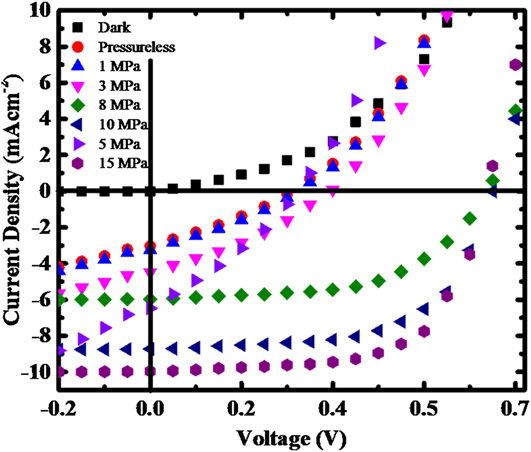
Plots of current density against voltage (I–V) are presented in Fig. 8 and Table I for photovoltaic cells subjected to annealing and pressure application (0–15 MPa). The results show that pressure application leads to a significant improvement in current–voltage characteristics of the OPVs. In the case of the devices with no pressure application (OPV0), the short circuit current (I sc) was ∼4.21 mA/cm2, while the V oc recorded was ∼0.30 V resulting in a power conversion efficiency (PCE) of 0.05%. However, upon pressure application, the I sc increased to ∼10.0 mA/cm2 with a corresponding increase in the V oc of 0.66 V. The devices (OPV1, OPV3, and OPV5) recorded marginal increases in PCEs. Pressures greater than 5 MPa thus (OPV8, OPV10, and OPV15) resulted in significant increases in the I–V characteristics. For example, OPV8, OPV10, and OPV15 recorded I sc of ∼6.0, ∼8.82, and ∼10.00 mA/cm2, respectively, with their V oc fairly constant at ∼0.66 V. These represent efficiencies of ∼2.45, ∼3.91, and ∼4.65%. A significant increase of ∼60% was recorded between OPV8 and OPV10 and ∼20% between OPV10 and OPV15 devices. The low performance of the control device stems from the fact that during the deposition of the solution based layers (PEDOT:PSS/P3HT:PCBM) through spin coating technique, the films usually result in uneven coverage and may form blisters. The blisters results in partial/reduced overall surface contacts between the layers. In this situation, charge hopping/tunneling mechanism dominates the performance of the device and because charge hopping/tunneling is an energy intensive process, the interfacial charge transport is limited. Upon pressure application, the voids are closed, the blisters are flattened and the total surface contacts increase tremendously to allow for improved charge transport across the interface.
Current–voltage characteristics of the pressure assisted P3HT:PCBM-based devices.
Short circuit current density (I sc), open-circuit voltage (V oc), fill factor (FF) and PCE of annealed and pressured assisted polymer-fullerene blend organic photovoltaic devices.

It is noteworthy that the improvements in photoconversion efficiencies were associated with significant increases in the contact lengths. Reference Agyei-Tuffour, Rwenyagila, Asare, Oyewole, Zebaze Kana, O'Carroll and Soboyejo22,Reference Du, Anye, Vodah, Tong, Zebaze Kana and Soboyejo23 The observed increases were due to the combination of pressure application, reduction in surface roughness, and the improvement in the edge-on orientations of the P3HT polymers interspersed with PCBM crystallites. The polymer chains were stretched in the direction of the applied pressure, which reduced the lamellae spacing between the polymer units. Hence, the high degree of crystallinity in the polymer led to enhancements in the current–voltage response.
E. Implications
The above results have significant implications on the design and fabrication of organic photovoltaic devices with improved photoconversion efficiencies. First, they suggest that the PL intensity of the pressured films increases with increasing applied pressure. There was also a significant reduction in the PL quantum response of the PCBM/P3HT blends. These occur due to improved charge mobility between P3HT polymers, and the fullerene molecules. The improved photoconversion efficiencies are also associated with changes in polymer crystallinity. Hence, the controlled application of pressure can be used to significantly improve the photoconversion efficiencies of OPVs with bulk heterojunction structures. Further work is needed to optimize the processing parameters for the fabrication of such structures. These are clearly the challenges for future work.
IV. SUMMARY AND CONCLUDING REMARKS
Organic Photovoltaic devices with enhanced efficiencies can be achieved by the manipulation of the nano- and micro-structures of the active layers in bulk heterojunction solar cells. The results of the current experimental study of the changes in the structure of the P3HT/PCBM blends suggest that annealing and pressure application can be used to control the surface morphology, crystallinity, and current–voltage characteristics of bulk heterojunction solar cells. Pressure application also results in the stretching of the polymer chains, predominantly in the edge-on configurations, with reduced lamellae spacing. The edge-on configuration induces polymer crystallinity, as well as significant enhancements in the current–voltage characteristics, and photoconversion efficiencies of the bulk heterojunction solar cells.
ACKNOWLEDGMENTS
BAT acknowledges the University of Ghana—Carnegie Corporation's Next Generation of African Academics program (UG-NGAA) for funding. We also appreciate the Nelson Mandela Institution, the African Development Bank, the World Bank STEP-B program, the World Bank African Centers of Excellence program and Rutgers University, USA. Dr Kevin Yager and BNL are acknowledged for the opportunity and assistance at the Synchrotron Facility. We again thank Christopher Petoukhoff, Zeqing Shen and Binxing Yu for the experimental assistance and useful discussions. Appreciations are finally extended to Professor Deidre M. O'Carroll, Professor Eric Garfunkel, and Professor Manish Chowolla for their assistance with the experimental techniques.