The theory of differential susceptibility has achieved a prominent role within developmental psychopathology and developmental science more broadly (Belsky, Reference Belsky1997, Reference Belsky, Ellis and Bjorklund2005; Belsky & Pluess, Reference Belsky, Pluess and Cicchetti2016; Boyce et al., Reference Boyce, Chesney, Alkon, Tschann, Adams, Chesterman and Wara1995; Bush & Boyce, Reference Bush, Boyce and Cicchetti2016; Del Giudice & Ellis, Reference Del Giudice, Ellis and Cicchetti2016; Ellis, Boyce, Belsky, Bakermans-Kranenburg, & van IJzendoorn, Reference Ellis, Boyce, Belsky, Bakermans-Kranenburg and van IJzendoorn2011). In a nutshell, the theory proposes that many of the same individual factors that determine increased sensitivity to the effects of negative environments (e.g., high levels of stress, danger, and adversity) also confer enhanced responsivity to positive environments (e.g., high levels of safety and emotional support). In other words, susceptible individuals respond to the quality of their environment “for better and for worse” (Belsky, Bakermans-Kranenburg, & van IJzendoorn, Reference Belsky, Bakermans-Kranenburg and van IJzendoorn2007; Boyce et al., Reference Boyce, Chesney, Alkon, Tschann, Adams, Chesterman and Wara1995). Differential susceptibility goes beyond the classic concept of vulnerability or diathesis–stress, whereby individual factors increase vulnerability in response to negative or stressful events (e.g., Gottesman & Shields, Reference Gottesman and Shields1972; Hankin & Abela, Reference Hankin and Abela2005; Monroe & Simmons, Reference Monroe and Simons1991; Sameroff, Reference Sameroff and Mussen1983; see Belsky & Pluess, Reference Belsky and Pluess2009, Reference Belsky and Pluess2013). Differential susceptibility can also be distinguished from vantage sensitivity, in which individual factors amplify the effect of positive environments but not that of negative environments (Pluess, Reference Pluess2015; Pluess & Belsky, Reference Pluess and Belsky2013).
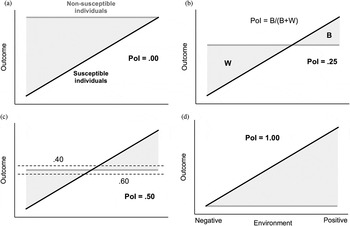
The factors that determine susceptibility can be examined at various levels of analysis: genetic, epigenetic, neurobiological, and temperamental. The shared outcome of these processes is the emergence of disordinal or crossover interactions involving an environmental variable (e.g., supportive parenting) and the individual moderator (e.g., physiological stress reactivity) that determines increased susceptibility at both extremes of the variable (Belsky et al., Reference Belsky, Bakermans-Kranenburg and van IJzendoorn2007). In short, crossover interactions are the empirical hallmark of differential susceptibility. Figure 1 illustrates some characteristic interaction shapes for the simplified case in which there are only two types of individuals, susceptible and nonsusceptible. Figure 1c shows the prototype of a crossover interaction reflecting differential susceptibility; Figure 1a shows an interaction consistent with a diathesis–stress model, whereas Figure 1d illustrates vantage sensitivity. Note that while the lines predicting developmental outcomes for low-susceptibility individuals are by definition flatter than those for high-susceptibility ones, they are not necessarily horizontal as in Figure 1. In addition, studies of differential susceptibility target both dichotomous moderators such as single-gene variants and continuous moderators such as temperamental traits, physiological reactivity, or graded genotypic scores computed from multiple genetic variants (for recent examples, see Beaver, Hartman, & Belsky, Reference Beaver, Hartman and Belsky2015; Dalton, Hammen, Najma, & Brennan, Reference Dalton, Hammen, Najman and Brennan2014; Davies, Cicchetti, & Hentges, Reference Davies, Cicchetti and Hentges2015; Elmore, Nigg, Friderici, Jernigan, & Nikolas, Reference Elmore, Nigg, Friderici, Jernigan and Nikolas2016; Gallitto, Reference Gallitto2015; Thibodeau, Cicchetti, & Rogosh, Reference Thibodeau, Cicchetti and Rogosch2015).
Interaction shape and the proportion of interaction (PoI) index. (a) The prototypical pattern predicted by diathesis–stress models (susceptibility only in response to negative conditions); (b) the calculation of the PoI index; (c) a symmetric interaction, highlighting the range of PoI values regarded as highly consistent with differential susceptibility according to Roisman et al.’s (2012) guidelines (PoI = .40–.60); and (d) the prototypical pattern associated with vantage sensitivity (susceptibility only in response to positive conditions).

Tests of Differential Susceptibility
While meta-analyses have found reliable evidence of differential susceptibility in some domains (e.g., van IJzendoorn & Bakermans-Kranenburg, Reference van IJzendoorn and Bakermans-Kranenburg2015; van IJzendoorn, Belsky, & Bakermans-Kranenburg, Reference van IJzendoorn, Belsky and Bakermans-Krananburg2012), the findings of individual studies remain considerably mixed. A likely contributing factor is the low power of tests for person–environment interactions (see below), including Genotype × Environment (G × E) interactions involving specific candidate genes (Visscher & Posthuma, Reference Visscher and Posthuma2010). Given the relatively small sample size of most studies in this area, pressing questions have been raised about the validity and replicability of candidate G × E findings (Dick et al., Reference Dick, Agrawal, Keller, Adkins, Aliev, Monroe and Sher2015; Duncan & Keller, Reference Duncan and Keller2011). Another problem in early research on differential susceptibility was the absence of formal criteria for discriminating between interaction patterns. Having detected a statistically significant interaction, researchers went on to visually inspect the interaction plot and compare it to the prototypes shown in Figure 1; however, this kind of subjective evaluation is not statistically robust and can easily generate unreplicable findings.
Partly in response to such criticism, a wave of methodological work (Belsky, Pluess, & Widaman, Reference Belsky, Pluess and Widaman2013; Lee, Lei, & Brody, Reference Lee, Lei and Brody2015; Roisman et al., Reference Roisman, Newman, Fraley, Haltigan, Groh and Haydon2012; Widaman et al., Reference Widaman, Helm, Castro-Schilo, Pluess, Stallings and Belsky2012) has sought to provide researchers with more rigorous methods to identify differential susceptibility and distinguish it from other types of interaction. In particular, Roisman et al. (Reference Roisman, Newman, Fraley, Haltigan, Groh and Haydon2012) offered detailed guidelines for identifying differential susceptibility and devised a series of “critical tests” that can be applied to significant interactions to determine whether they conform to the crossover pattern shown in Figure 1c. The guidelines proposed by Roisman et al. have been widely adopted, and have become a de facto standard in the differential susceptibility literature. In this paper I focus on the Roisman et al. approach because of its popularity with researchers. A notable alternative is the model comparison approach advanced by Widaman et al., in which a reparametrized regression equation is used to estimate the location of the crossover point (for details and examples see Belsky et al., Reference Belsky, Pluess and Widaman2013; Widaman et al., Reference Widaman, Helm, Castro-Schilo, Pluess, Stallings and Belsky2012).
The first critical test advocated by Roisman et al. (Reference Roisman, Newman, Fraley, Haltigan, Groh and Haydon2012) is based on regions of significance (RoS). RoS delimit values of the environmental variable for which the moderator is significantly associated with the outcome variable (Kochanska, Kim, Barry, & Philibert, Reference Kochanska, Kim, Barry and Philibert2011). A significant interaction is deemed consistent with differential susceptibility if RoS extend to both the low and high end of a conventional interval of ±2 SD from the mean of the environmental variable. In the dichotomous example of Figure 1, the difference in outcomes between susceptible and nonsusceptible individuals must be statistically significant, and not just visually detectable, at both the positive and the negative extremes of environmental quality.
The second critical test is not based on significance but on the shape of the interaction, quantified with an index called proportion of interaction (PoI). The PoI is the proportion of the total area between the lines of an interaction plot, bounded by ±2 SD of the environmental variable, that lies on the positive side of the crossover point, where “positive” refers to the quality of the environment (e.g., higher parental support and higher socioeconomic status). It is obtained by dividing the amount of change “for better” (area B in Figure 1b) by its sum with the amount of change “for worse” (area W).Footnote 1 A perfectly symmetric interaction with the crossover point located at the mean of the environmental variable would have PoI = .50; this is often assumed to be the prototype of differential susceptibility (Figure 1c). The prototypical shape predicted by diathesis–stress models has PoI = .00 (Figure 1a), whereas PoI =1.00 corresponds to prototypical vantage sensitivity (Figure 1d). Roisman et al. suggested that sample PoI values between .40 and .60 indicate an effect highly consistent with differential susceptibility (dashed lines in Figure 1c); they did not provide similar guidelines for diathesis–stress or vantage sensitivity.
As a variant of the PoI test, Roisman et al. proposed a test based on a different index of interaction shape, the proportion affected (PA). The PA is the proportion of individuals in the sample who fall on the positive side of the crossover point. Based on the assumption of approximate normality in the environmental variable, interactions are deemed consistent with differential susceptibility if PA > 16%. Although the 16% cutoff was presented as a tentative suggestion, most researchers have adopted it in conjunction with the .40–.60 window for PoI as a criterion for screening potential differential susceptibility interactions. Other guidelines proposed by Roisman et al. (Reference Roisman, Newman, Fraley, Haltigan, Groh and Haydon2012) deal with nonlinearity and multiple significance testing (e.g., in longitudinal studies) and have been applied less frequently than the three critical tests described here.
Distinguishing between different types of interaction patterns is an important goal, and the guidelines advanced by Roisman and colleagues have contributed to move the field away from subjective criteria and toward a more rigorous, quantitative approach to differential susceptibility (see Widaman et al., Reference Widaman, Helm, Castro-Schilo, Pluess, Stallings and Belsky2012). At the same time, there are reasons for concern that have not yet been addressed in the literature. The first potential problem stems from existing guidelines focusing on preventing the occurrence of false positives, that is, detecting crossover interactions when they are not present in the population. While raising the bar for differential susceptibility by performing additional tests reduces the risk of false positives, it is also likely to increase the rate of false negatives (i.e., failing to detect real crossover interactions). Until now, there have been no investigations of how the various criteria adopted by investigators affect the risk of false negatives, and how this reflects on sample size requirements for studies of differential susceptibility. It is quite possible that, under the most stringent criteria, reducing false negatives to an acceptable level may require much larger samples than researchers typically realize.
Another concern is that some of the existing tests of differential susceptibility go beyond statistical significance and implicitly make assumptions about the expected shape of interactions, as captured, for example, by the PoI index. As it turns out, some of those assumptions are theoretically problematic; this is the case of the “symmetry hypothesis,” the idea that the expected interaction shape for differential susceptibility is symmetric, with PoI = .50 (Figure 1c). Recent evolutionary models indicate that strictly symmetric interactions are unlikely to evolve, and that, all else being equal, crossover interactions are more likely to be biased toward lower PoI values, that is, shifted toward the prototype of diathesis–stress models (Del Giudice, Reference Del Giudicein press). A preliminary analysis of published studies supported this prediction and suggested that the distribution of PoI values might be centered on a value closer to .40 than .50, which is near the lower bound of the .40–.60 window proposed by Roisman et al. (Del Giudice, in press). In a more general sense, I am aware of no published work on the sampling distribution of the PoI index for different population values and sample sizes; current guidelines rely on implicit assumptions about the distribution of PoI values that may or may not turn out to be correct.
The Present Study
In this study, I used Monte Carlo simulations to investigate the performance, and potential pitfalls, of the critical tests of differential susceptibility proposed by Roisman et al. (Reference Roisman, Newman, Fraley, Haltigan, Groh and Haydon2012) and commonly employed in the empirical literature. I proceeded in two steps. First, I explored the sampling distribution of the PoI index by computing it from simulated samples of varying size, repeating the procedure for different values of interaction strength (effect size) and shape (PoI) in the population. Second, I applied the three critical tests to the simulated data sets, and tracked their ability to detect different types of interactions in a range of plausible conditions.
This straightforward approach revealed some notable and previously unreported limitations of existing tests. In part, these limitations concern sample size: to achieve sufficient detection rates, critical tests of differential susceptibility require considerably larger samples than standard power calculations would suggest. The critical test based on the .40–.60 PoI criterion is especially likely to produce false negatives. This test is also very sensitive to the assumption of interaction symmetry, so that even minor violations, which are not just possible but theoretically plausible, dramatically reduce its performance, particularly when samples are large.
As an initial response to the limitations of the standard .40–.60 criterion, I propose a simple revised criterion based on an expanded window of PoI values (.20–.80). I show that a test based on this revised criterion outperforms existing tests of differential susceptibility, considerably improving detection with relatively little effect on the rate of false positives. I conclude by noting the conceptual limitations of a purely statistical approach to differential susceptibility, and discussing the implications of the present results for the interpretation of published findings and the design of future studies in this area.
Method
Model and parameters
Simulations were performed in R™ 3.2.2 (R Core Team, 2013). Values of an environmental variable (X) and a moderator (Z) reflecting individual differences in susceptibility were generated from normal distributions. The distribution of X had M = 0 and SD = 1; the distribution of Z had M = 1 and SD = 0.2, effectively restricting the moderator to positive values. This was done to obtain the specific interaction shape postulated by differential susceptibility models, in which the slope of environmental effects in the population may become larger (higher susceptibility) or smaller (lower susceptibility), but does not change sign (Figure 1). Note that this assumption only applies to the population; in individual samples, it is entirely possible for the slope to change sign at different levels of susceptibility. The environmental variable X was assumed to reflect a positive dimension of the environment (see Footnote 1). Values of the outcome variable were obtained from the model:
 $$Y = -cZ + XZ + {\rm \varepsilon} \comma $$
where c is the location of the crossover point in the population and ε is a normally distributed residual term. This simple model reflects the assumption that the effect of the environment is fully moderated by individual susceptibility (i.e., individuals with zero susceptibility are not influenced by the environmental variable X). The variance of ε was adjusted to obtain the desired effect size for the interaction term XZ (see below). The location of the crossover point was adjusted to determine interaction shape (see below).
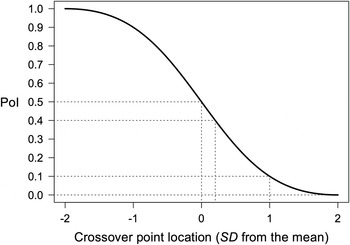
Relation between the proportion of interaction (PoI) index and the location of the crossover point for positive environmental variables (higher scores = more positive environment). Specific locations are shown for the four PoI values explored in the simulation (.00, .10, .40, and .50).

In each simulation run, individual values of X, Z, and Y were generated for a sample of size N. A linear regression model of the form
 $$Y = b_0 + b_1X + b_2Z + b_3XZ + {\rm\varepsilon} $$
was then fitted to the simulated data, and the coefficient of the interaction term (b 3) was tested for significance. If the test on b 3 was significant at p < .05 (two tailed), it was followed up with a sequence of critical tests of differential susceptibility, as detailed below. In each simulated sample, the crossover point, PoI value, and regions of significance were calculated from regression coefficients following the procedures described in Roisman et al. (2012). Simulations were repeated for 4 levels of population Po I (interaction shape), 3 levels of effect size, and 50 levels of sample size. For each combination of parameters, 10,000 independent samples were generated and analyzed, for a total of six million samples (4 × 3 × 50 × 10,000).
Interaction shape
Simulations were run for 4 levels of the population PoI: .50, .40, .10, and .00. The corresponding locations of the crossover point are shown in Figure 2. A PoI value of .50 corresponds to a symmetric interaction (Figure lc) with the crossover point at the population mean. A PoI value of .40 represents a deviation from symmetry in the direction of the diathesis–stress prototype. Note that this is not a large deviation, because the crossover point for PoI = .40 is located about 0.2 SD above the mean for “positive” environmental variables (Figure 2; for “negative” variables, the location would be 0.2 SD below the mean). Interactions with PoI = .00 match the prototype for diathesis–stress (Figure la); the corresponding crossover point is at 2 SD above the mean of the environmental variable (for positive variables; 2 SD below the mean for negative variables). Finally, PoI = .10 was chosen to explore the effects of deviations from the diathesis–stress prototype. Because of the nonlinear relation between crossover location and PoI (Figure 2), the crossover point for PoI = .10 is located midway between that of PoI =. 50 and that of PoI = .00, that is, 1 SD above the mean (for positive variables; 1 SD below the mean for negative variables). PoI values above .50 were not modeled in the simulations, because the results would have been exactly specular to those obtained for PoI values below .50. Thus, simulation results for the detection of diathesis–stress apply just as well to the detection of vantage sensitivity.
Effect size
The measure of effect size employed in the simulations was the semipartial ρ2 for the interaction (sρ2). This is the population equivalent of the semipartial R 2, which corresponds to the change in R 2 when the interaction term is added to the regression model (usually reported as ΔR 2). The value of sρ2 measures the unique proportion of variance in the outcome variable explained by the interaction term. The three values of sρ2 chosen for the simulations were .01, .02, and .03. Although these values may appear small at first, they span a realistic range of expected effect sizes for this area of research. Most studies of differential susceptibility are nonexperimental, and the environmental variables measured by researchers (e.g., parental sensitivity, socioeconomic disadvantage) follow distributions in which the cases are concentrated in the middle (or on one side for skewed distributions) rather than at the two extremes. The same applies to continuous moderators such as irritable temperament and physiological reactivity. This configuration of variables, which is typical of nonexperimental studies in psychology at large, dramatically reduces the maximum amount of unique variance that can be explained by the interaction term. As a result, even the strongest interactions typically end up accounting for no more than a few percent of the variance in the dependent variable (for details, see McClelland & Judd, Reference McClelland and Judd1993). This effect is further exacerbated by the particular interaction shape postulated by models of differential susceptibility, whereby the effect of the environment is amplified in high-susceptibility individuals but only attenuated (rather than reversed) in low-susceptibility ones. Under this assumption, the main effect of the environment can be expected to absorb a large amount of variance, further reducing the effect size associated with the interaction term. Candidate gene studies usually employ dichotomous moderators (e.g., two alleles of a gene), and thus suffer less severely from the reduction in sρ2 associated with continuous moderators (McClelland & Judd, 1993). However, genomic association studies consistently show that the effect sizes associated with common genetic variants tend to be very small, rarely accounting for even 1% of trait variance (Chabris, Lee, Cesarini, Benjamin, & Laibson, Reference Chabris, Lee, Cesarini, Benjamin and Laibson2015). In principle, experimental studies can potentially show larger effects because they allocate participants to distinct groups (see McClelland & Judd, 1993). However, the tests of differential susceptibility examined here were conceived for nonexperimental research, and interaction shape indices such as PoI and PA (as currently defined) are only meaningful in that context.
A survey of effect sizes in the empirical literature supports the present choice of values. In a large study that explored temperament as a potential moderator (Roisman et al., 2012), ΔR 2 values for significant interactions ranged from .004 to .044 (average = .009). A similar study by Beaver et al. (2015) reported ΔR 2 values ranging from .010 to .020 (average = .016). Large studies of candidate genes show effects of similar magnitude: significant G × E interactions had ΔR 2 values of .010 in a study by Zhang and colleagues, and ranged from .004 to .059 (average = .021) in a study by Belsky and colleagues (Reference Zhang, Cao, Wang, Ji, Chen and Deater-Deckard2015). Considering that these averages are based on significant interactions alone (and thus inflated by capitalization on chance), effect sizes between sρ2 = .01 and .02 can be regarded as realistic expectations in most nonexperimental scenarios. A population effect of sρ2 = .03 is unlikely to occur in practice, but can be useful for comparison as an upper bound on the plausible range of sρ2 values.
Sample size
Sample size was varied from N = 50 to 5,000 in 50 logarithmically spaced steps. In the recent literature on differential susceptibility, most published studies have samples between N = 200 and 700. Some studies employ larger samples, from about 1,000 to 2,500 participants (e.g., Gallitto, 2015; Kogan et al., 2014; Roisman et al., 2012; Thibodeau et al., 2015; Zhang et al., 2015). Researchers occasionally test differential susceptibility hypotheses in samples of about 100 participants (e.g., Brett et al., Reference Brett, Humphreys, Smyke, Gleason, Nelson, Zeanah and Drury2015; Montirosso et al., Reference Montirosso, Provenzi, Tavian, Morandi, Bonanomi, Missaglia and Borgatti2015; Sumner, McLaughlin, Walsh, Sheridan, & Koenen, Reference Sumner, McLaughlin, Walsh, Sheridan and Koenen2015), even if studies of this size lack the power to reliably detect interactions under most realistic conditions. The upper limit of N = 5,000 in the simulations is larger than any study of differential susceptibility to date.
Analysis of simulated data
Sampling distribution of the PoI index
For each combination of parameters, the distribution of PoI values was evaluated by computing its 5th, 25th, 50th, 75th, and 95th percentiles (based on 10,000 samples). Percentile curves with respect to sample size were obtained by smoothing the simulated outcomes with cubic splines (function smooth.spline; smoothing parameter = 0.7).
Tests of differential susceptibility
All the interaction terms in the simulated data sets were tested for significance at p < .05 (two tailed). The percentage of significant results (calculated on 10,000 samples for each combination of parameters) provided a Monte Carlo estimate of statistical power. Significant interactions were further probed with three critical tests, as recommended by Roisman et al. (2012). The first test (abbreviated as DS) assessed whether RoS (p < .05) included the extremes of a region of interest spanning ±2 SD from the mean of X. If RoS included both extremes of the ±2 SD region (and the crossover point was located within the same range), the interaction was regarded as consistent with differential susceptibility. If only the lower extreme (−2 SD) was included in the RoS, or if both extremes were included but the crossover point was located above 2 SD from the mean, the interaction was regarded as consistent with a diathesis–stress model (abbreviated as D-Str). The second test was based on the PoI index (abbreviated as DS+PoI) and required a PoI value between .40 and .60 in addition to the RoS criterion. The third and final test was based on the PA index (abbreviated as DS+PA) and required that at least 16% of cases lie above the crossover point in addition to the RoS criterion.
In total, the interaction in each simulated sample could pass or fail three tests of differential susceptibility, a less stringent test based on regions of significance (DS) and two more stringent tests based on indices of interaction shape in addition to the RoS criterion (DS+PoI and DS+PA). Interactions that failed these tests could be deemed consistent with a diathesis–stress model if they passed the relevant test (D-Str). The percentage of samples passing each test (calculated on 10,000 samples for each combination of parameters) provided a Monte Carlo estimate of detection rates under different criteria. Detection curves with respect to sample size were obtained by smoothing the simulated outcomes with cubic splines (smoothing parameter range = 0.5–0.7).
In all the simulations reported here, the moderator Z was modeled as a continuous, normally distributed variable (see above). Another set of simulations (not shown here) employed a dichotomous moderator and yielded virtually identical results for the same values of model parameters (all percentages within ±1.5%). Thus, the results discussed in this paper apply to both continuous (e.g., temperament) and dichotomous moderators (e.g., single genetic variants).
Results
Sampling distribution of the PoI index
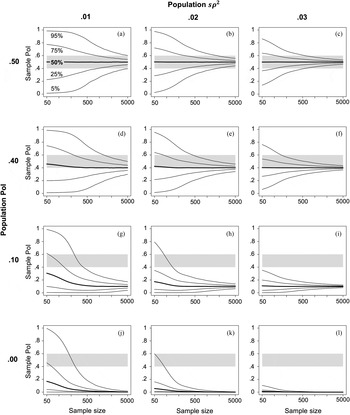
Simulation results for the sampling distribution of the PoI index are shown in Figure 3. The first row (Figure 3a–c) shows the results for a symmetric interaction in the population (PoI = .50). When sρ2 = .01 (Figure 3a), the central 90% of the distribution, that is, the range between the 5th and 95th percentiles, includes almost the full range of possible PoI values unless the sample size is larger than about N = 200. It is crucial that the .40–.60 window proposed by Roisman et al. (Reference Roisman, Newman, Fraley, Haltigan, Groh and Haydon2012) captures a relatively small portion of the sampling distribution. Samples larger than N ≈ 900 are required to make sure that at least 50% of the empirical PoI values will fall within the .40–.60 range, while 5,000 cases are still not enough to obtain a 90% capture rate. Figures are lower for sρ2 = .02 (Figure 3b), with N ≈ 300 for a 50% capture rate and N ≈ 1,700 for a 90% capture rate. Even with sρ2 = .03 (an improbably large effect in most nonexperimental contexts), about 600 cases are needed to obtain a 90% capture rate (Figure 3c).
Simulation results for the sampling distribution of the proportion of interaction (PoI) index. The semipartial effect size (sρ2) is the population equivalent of the change in R 2 when the interaction term is added to a regression model (ΔR 2). Lines show percentiles of the PoI distribution in simulated samples. Gray regions show the range of PoI values regarded as highly consistent with differential susceptibility according to Roisman et al.’s (Reference Roisman, Newman, Fraley, Haltigan, Groh and Haydon2012) guidelines. Each plot is based on 500,000 simulated samples.

If interactions in the population are not perfectly symmetric but shifted toward the diathesis–stress prototype, as in the second row of Figure 3 (Figure 3d–f), the capture rate of the .40–.60 window is bound to be less than 100% regardless of sample size. With PoI = .40, the maximum capture rate is 50%. In other words, if the population PoI is .40 (i.e., the crossover point is about 0.2 SD above the mean), empirical PoI values are going to fall within the .40–.60 window only half of the time even with very large samples. This scenario demonstrates how the .40–.60 criterion critically depends on the symmetry hypothesis being true at the population level.
The bottom row of Figure 3 (Figure 3j–l) shows the sampling distribution of PoI when the interaction in the population matches the diathesis–stress prototype. Again, the distribution is rather wide for small sample sizes; however, only a minority of cases is expected to fall inside the .40–.60 window. Outcomes are not substantially different if interaction shape is shifted toward a differential susceptibility pattern, as illustrated in Figure 3g–i for the case of PoI = .10. As discussed in the Methods section, simulations for vantage sensitivity would be specular to those for diathesis–stress; specifically, the results for PoI = 1.00, .90, and .60 would be identical to those for PoI = .00, .10, and .40, respectively.
Tests of differential susceptibility
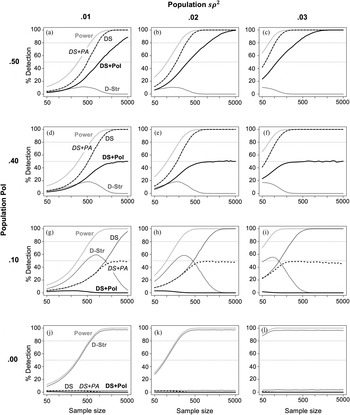
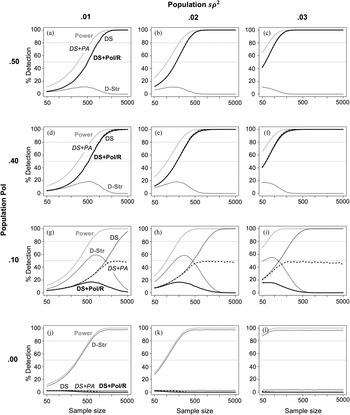
Simulation results for the performance of critical tests are shown in Figure 4. As expected, the DS test (based on RoS) was more conservative than a simple significance test on the interaction term (compare the black line for the DS test with the light gray line for power). With PoI = .50 and sρ2 = .01 (Figure 4a), the test requires N ≈ 500 to reach a 50% detection rate and N ≈ 900 for 80% detection. For comparison, the sample size required for 80% statistical power is about N ≈ 600. This means that, in a study designed to achieve 80% power, the DS test will detect a crossover interaction only about 60% of the time. With sρ2 = .03 (Figure 4c), the sample size required for 80% detection is N ≈ 100.
Simulation results for critical tests of differential susceptibility and diathesis–stress. The semipartial effect size (sρ2) is the population equivalent of the change in R 2 when the interaction term is added to a regression model (ΔR 2). DS (thin black line), differential susceptibility test based on regions of significance (RoS); DS+PoI (thick black line), DS test based on RoS and the .40–.60 criterion for proportion of interaction (PoI); DS+PA (dashed black line), DS test based on RoS and the 16% criterion for the proportion affected (PA) index; D-Str (dark gray line), diathesis–stress test based on RoS and/or the location of the crossover point. Each plot is based on 500,000 simulated samples.

When the interaction in the population was symmetric (or nearly so), adding the PA > 16% criterion to the RoS test did not make any difference in the results: the DS test and the DS+PA test always produced the same outcome. In contrast, the DS+PoI test turned out to be markedly more conservative than the DS test. With sρ2 = .01, the DS+PoI test requires N ≈ 1,000 just to achieve a 50% detection rate, and N ≈ 3,100 for 80% detection. Given these figures, even the largest differential susceptibility studies published to date (about 2,500 participants) have less than 80% probability of detecting a symmetric interaction of this size using the DS+PoI criterion. With sρ2 = .02 (Figure 4b), the DS and DS+PA tests reach 80% detection at N ≈ 300, whereas the DS+PoI test requires about 1,100 cases to perform at the same level. Even with an effect size of sρ2 = .03 (Figure 4c), the DS+PoI test still requires N ≈ 350 to achieve an 80% detection rate.
As expected from the sampling distribution of PoI, even small deviations from interaction symmetry reveal the limitations of the DS+PoI test. When PoI = .40 (second row in Figure 4d–f), the detection rate of this test can never be higher than 50%; moreover, the ceiling is only reached with large samples (around N ≈ 3,000 for sρ2 = .01, N ≈ 1,000 for sρ2 = .02, and N ≈ 400 for sρ2 = .03; Figure 4d–f). In the same conditions, the DS and DS+PA tests achieve 80% detection for N ≈ 100 to 1,000; these figures are close to those obtained with PoI = .50, indicating that the DS and DS+PA tests are robust to small deviations from interaction symmetry (compare Figure 4a–b and d–e). An interesting finding is that, even if interactions in the population are symmetric or nearly so, increasing sample size within the lower range increases the likelihood of detecting diathesis–stress patterns because of increased statistical power (see the lines for D-Str in the first and second lines of Figure 4). Minimizing the probability of a positive D-Str test with symmetric interactions requires large samples (around N ≈ 1,700 for sρ2 = .01, N ≈ 600 for sρ2 = .02, and N ≈ 300 for sρ2 = .03).
If the interaction in the population matches the diathesis–stress prototype (PoI = .00), predictions about test performance are very straightforward (bottom row of Figure 4). The detection rate of the diathesis–stress test closely tracks statistical power, while the likelihood of detecting a differential susceptibility pattern remains very low (<3%) regardless of the specific test employed (Figure 4j–l).
The results become considerably more complex if the interaction shape is shifted toward a differential susceptibility pattern. For example, if PoI = .10 (third row of Figure 4) the likely outcome of the critical tests changes dramatically depending on sample size. Consider the case of sρ2 = .01 (Figure 4g). With relatively small samples, the probability of detecting a diathesis–stress pattern increases with sample size and remains higher than that of detecting differential susceptibility. Past a certain point, however, the detection rate of the D-Str test begins to decrease; when sample reaches N ≈ 1,400, a given study is equally likely to detect a diathesis–stress pattern or a differential susceptibility pattern based on the DS test. As sample size increases further, the detection rate of the DS test keeps growing, while that of the DS+PA test plateaus at about 50%. As a result, both the DS and the DS+PA tests have the potential to generate contradictory findings when the interaction in the population has a PoI close (but not equal) to zero and studies are based on large samples. As expected, the DS+PoI test behaves in a more conservative fashion; with PoI = .10, it never exceeds a 3%–4% detection rate regardless of sample size (Figure 4g–i). However, the ability of the DS+PoI test to reject false positives at low PoI values coexists with a high risk of false negatives when interactions are symmetric or nearly so.
As discussed above, simulation results for the detection of vantage sensitivity would be exactly specular to those for the detection of diathesis–stress. For example, the probability of detecting a diathesis–stress pattern when PoI = .10 is identical to the probability of detecting a vantage sensitivity pattern when PoI = .90.
A revised PoI criterion
The results presented in Figure 4 indicate that the DS+PoI test has two major limitations: first, it produces a high rate of false negatives under most conditions; and second, it is very sensitive to deviations from interaction symmetry. A simple but potentially effective solution to these problems would be to expand the PoI window proposed by Roisman et al. to cover a broader range of values. Inspection of the sampling distribution of the PoI index presented in Figure 3 suggests .20–.80 as a promising alternative.
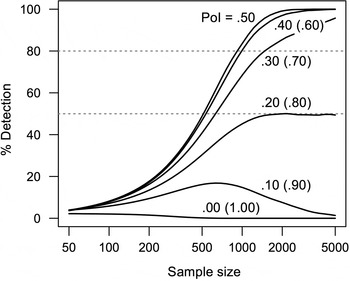
Simulation results using a revised critical test (DS+PoI/R) based on a .20–.80 window are shown in Figure 5. This test achieves detection rates almost as high as those of the DS and DS+PA tests when interactions are symmetric or nearly so, but much lower detection rates when interactions are close to the diathesis–stress prototype. If the goal is to separate prototypical patterns as cleanly as possible, the DS+PoI/R tests clearly outperforms both the DS test and the DS+PA test (Figure 5g–i). Moreover, and in contrast with the DS and Ds+PA tests, the detection rate for PoI = .10 decreases at large sample sizes and never exceeds that of the D-Str test. This attenuates the problem of contradictory findings when the interaction shape in the population is close to the diathesis–stress or vantage sensitivity prototype (see above). Figure 6 shows detection curves of the DS+PoI/R tests for various values of population PoI (with sρ2 = .01). Detection rates remain high from about PoI = .30 to .70, and drop off rapidly for values below .20 or above .80 (i.e., crossover points about 0.67 SD above/below the mean). While this test still has “gray areas” around PoI = .20 and .80, where contradictory findings can arise (Figure 6), it performs well in separating extreme forms of interaction shape while keeping the rate of false positives reasonably low for PoI values close to .00 or 1.00 (compare Figures 4g–l and 5g–l).
Simulation results for critical tests of differential susceptibility with the revised PoI criterion. The semipartial effect size (sρ2) is the population equivalent of the change in R 2 when the interaction term is added to a regression model (ΔR 2). DS (thin black line), differential susceptibility test based on regions of significance (RoS); DS+PoI/R (thick black line), revised DS test based on RoS and the .20–.80 criterion for proportion of interaction (PoI); DS+PA (dashed black line), DS test based on RoS and the 16% criterion for the proportion affected (PA) index; D-Str (dark gray line), diathesis–stress test based on RoS and/or the location of the crossover point. Each plot is based on 500,000 simulated samples.

Detection curves of the revised differential susceptibility test based on regions of significance and different values for the proportion of interaction (PoI; DS+PoI/R). Effect size (sρ2) = .01. Each line is based on 500,000 simulated samples.

In sum, the DS+PoI/R test achieves the desired goal (reliably discriminating between prototypical differential susceptibility and diathesis–stress/vantage sensitivity patterns) better than the existing alternatives. As can be seen from Figure 5, the benefits of using the DS test are minimal when the population PoI is close to .50, and are outweighed by the costs (false positives and contradictory findings) when PoI is close to .00. The DS-PA test adds no information when PoI is close to .50, and does not discriminate as well as the DS+PoI/R test when PoI is close to .00. Moreover, the DS+PoI/R test should be more robust than the DS-PA test to deviations from normality, as the interpretation of the PA index critically depends on the shape of the underlying distribution of X (see Roisman et al., Reference Roisman, Newman, Fraley, Haltigan, Groh and Haydon2012).
Discussion
Statistical tests of differential susceptibility have become standard in the empirical literature, and are routinely employed to adjudicate between alternative models of the underlying developmental processes. However, their performance and limitations have never been systematically investigated. In this paper, I employed Monte Carlo simulations to explore the functioning of three commonly used tests proposed by Roisman et al. (Reference Roisman, Newman, Fraley, Haltigan, Groh and Haydon2012). The first result was that critical tests of differential susceptibility require substantially larger samples than simple significance tests. This can be a major source of false negatives if investigators design their studies based on standard power analysis, but then rely on tests with low detection rates to interpret their main findings. Under the assumption of a nearly symmetric crossover interaction in the population (PoI ≈ .40–.60; Figure 1c), a useful rule of thumb is that tests of differential susceptibility based on RoS (DS) or the combination of RoS and the PA > 16% criterion (DS+PA) require approximately 50% more cases to achieve 80% detection than to achieve 80% statistical power. For example, if power analysis indicates that 500 participants are needed for 80% power, investigators planning to use these tests should increase sample size to about 750 participants (“add 50%”).
Of note, criteria for diathesis–stress do not suffer from this limitation when the interaction shape in the population matches the diathesis–stress prototype (PoI = .00; see the bottom row of Figure 4); their detection rate closely matches the statistical power of significance tests on the interaction term. The same applies to tests of vantage sensitivity when the interaction shape has PoI = 1.00. Moreover, if the population PoI is .00 or 1.00, the likelihood of detecting a differential susceptibility pattern is very low regardless of sample size and the specific test employed. In contrast, the likelihood of detecting diathesis–stress or vantage sensitivity patterns can be nontrivial even if the population PoI is .50 (first row of Figure 4). All else being equal, both of these effects tend to make diathesis–stress and vantage sensitivity findings more likely than differential susceptibility findings for purely statistical reasons. This potential distortion should be taken into account in reviews of the existing empirical literature.
Finally, simulation results showed that the critical test based on the combination of RoS and the .40–.60 PoI criterion (DS+PoI) has severe limitations and should be abandoned or revised. First, this test suffers from a high rate of false negatives even when the interaction shape in the population is symmetric. Second, it is very sensitive to deviations from strict interaction symmetry; if the PoI in the population is .40 instead of .50, the maximum detection rate drops to 50% regardless of sample size. This feature of the test is especially problematic, as recent theoretical findings suggest that the symmetry hypothesis is unlikely to be warranted in most scenarios (Del Giudice, in press). Published empirical studies that rely on this test to interpret interaction findings should be reevaluated in light of these limitations.
To overcome the problems of the DS+PoI test, I proposed a simple revision based on a .20–.80 window of PoI values. This revised test (DS+PoI/R) turned out to perform better than existing tests in separating prototypical diathesis–stress/vantage sensitivity and differential susceptibility interaction patterns, while achieving good detection rates and being robust to minor deviations from symmetry. Another convenient feature of the DS+PoI/R test is that researchers can use the “add 50%” rule of thumb to determine sample size if they anticipate a symmetric or nearly symmetric interaction shape in the population. (Under this assumption, detection rates for the revised test are very close to those of the standard DS test; see Figure 5.) Replacing existing tests of differential susceptibility with the DS+PoI/R test would improve accuracy and simplify the interpretation of empirical findings, without increasing the complexity of the procedure.
Conceptual issues
To conclude, it is important to consider what statistical tests of interactions can and cannot reveal about the nature of the underlying developmental processes. For simplicity, throughout this paper I have referred to ordinal and disordinal interactions as representative of differential susceptibility versus diathesis–stress/vantage sensitivity, respectively. However, the correspondence is only partial and can be misleading if applied mechanically. For example, the core assumption of diathesis–stress models is that susceptible individuals are vulnerable to negative environmental conditions such as stress and lack of resources. A diathesis–stress scenario in which vulnerable individuals suffer more severe damage in negative environments does predict the appearance of ordinal interactions, with PoI = .00 as the prototypical case (Figure 1a). However, the converse is not necessarily true. Ordinal interactions with the exact same shape can evolve, not as a result of vulnerability in susceptible individuals, but rather as a result of adaptive developmental processes that match the child's trajectory to the expected characteristics of the environment. Models suggest that PoI = .00 is an evolutionary attractor in a broad range of conditions, including scenarios that do not involve vulnerability as traditionally conceived (for extended discussion, see Del Giudice, in press). Another problem with mechanical interpretations of the tests is that interaction shape depends on the range of the environmental variable included in a given study. When the range of a variable showing differential susceptibility is restricted to one side of the distribution (e.g., studies of high-risk children or middle-class samples), the resulting interaction may match a diathesis–stress or vantage sensitivity prototype.
In short, low PoI values provide only weak support for diathesis–stress hypotheses that involve dysregulation as opposed to adaptive developmental plasticity; conversely, high PoI values are only weakly supportive of vantage sensitivity. Distinguishing between these alternatives requires in-depth consideration of the functions and constraints of the relevant developmental mechanisms and, ideally, evidence bearing on the biological costs and benefits of different phenotypes in different contexts. Statistical tests of interactions shape can be informative, but they cannot substitute for theory and should never be interpreted in isolation.
In the absence of clear theoretical predictions, tests of interaction shape inevitably involve arbitrary distinctions between patterns. For example, the revised criterion I proposed here operates a relatively clean discrimination between interactions with PoI < .20 and PoI > .20 and between interactions with PoI < .80 and PoI > .80 (Figure 6). While these values may align reasonably well with researchers’ intuitions about the shape of different interaction patterns, there is nothing intrinsically special about the .20 and .80 thresholds, which correspond to crossover points located about 0.67 SD above/below the mean. Formal models of differential susceptibility may well predict crossover points above that value, depending on the characteristics of the environment and the costs and benefits associated with different behavioral profiles (for examples, see Del Giudice, in press). It is crucial to understand that, in this context, statistical tests work as surrogates for detailed theory: potentially useful but necessarily provisional. As theoretical models grow more sophisticated, it should become possible to make a priori predictions about interaction shape without the need to rely on conventional thresholds. In this perspective, Bayesian methods seem especially promising, as they naturally permit the integration of empirical data and theory-driven expectations. The challenges faced by differential susceptibility research have prompted creative responses and led to the development of sharper and more sophisticated methodological tools; this trend will surely continue in the future, and the whole discipline stands to benefit as a result.