





%20--%3e%3c!DOCTYPE%20svg%20PUBLIC%20'-//W3C//DTD%20SVG%201.0//EN'%20'http://www.w3.org/TR/2001/REC-SVG-20010904/DTD/svg10.dtd'%3e%3csvg%20version='1.0'%20id='Layer_1'%20xmlns='http://www.w3.org/2000/svg'%20xmlns:xlink='http://www.w3.org/1999/xlink'%20x='0px'%20y='0px'%20width='64px'%20height='64px'%20viewBox='5.5%20-3.5%2064%2064'%20enable-background='new%205.5%20-3.5%2064%2064'%20xml:space='preserve'%3e%3cg%3e%3ccircle%20fill='%23FFFFFF'%20fill-opacity='0'%20cx='37.785'%20cy='28.501'%20r='28.836'/%3e%3cpath%20fill='%23595959'%20d='M37.441-3.5c8.951,0,16.572,3.125,22.857,9.372c3.008,3.009,5.295,6.448,6.857,10.314%20c1.561,3.867,2.344,7.971,2.344,12.314c0,4.381-0.773,8.486-2.314,12.313c-1.543,3.828-3.82,7.21-6.828,10.143%20c-3.123,3.085-6.666,5.448-10.629,7.086c-3.961,1.638-8.057,2.457-12.285,2.457s-8.276-0.808-12.143-2.429%20c-3.866-1.618-7.333-3.961-10.4-7.027c-3.067-3.066-5.4-6.524-7-10.372S5.5,32.767,5.5,28.5c0-4.229,0.809-8.295,2.428-12.2%20c1.619-3.905,3.972-7.4,7.057-10.486C21.08-0.394,28.565-3.5,37.441-3.5z%20M37.557,2.272c-7.314,0-13.467,2.553-18.458,7.657%20c-2.515,2.553-4.448,5.419-5.8,8.6c-1.354,3.181-2.029,6.505-2.029,9.972c0,3.429,0.675,6.734,2.029,9.913%20c1.353,3.183,3.285,6.021,5.8,8.516c2.514,2.496,5.351,4.399,8.515,5.715c3.161,1.314,6.476,1.971,9.943,1.971%20c3.428,0,6.75-0.665,9.973-1.999c3.219-1.335,6.121-3.257,8.713-5.771c4.99-4.876,7.484-10.99,7.484-18.344%20c0-3.543-0.648-6.895-1.943-10.057c-1.293-3.162-3.18-5.98-5.654-8.458C50.984,4.844,44.795,2.272,37.557,2.272z%20M37.156,23.187%20l-4.287,2.229c-0.458-0.951-1.019-1.619-1.685-2c-0.667-0.38-1.286-0.571-1.858-0.571c-2.856,0-4.286,1.885-4.286,5.657%20c0,1.714,0.362,3.084,1.085,4.113c0.724,1.029,1.791,1.544,3.201,1.544c1.867,0,3.181-0.915,3.944-2.743l3.942,2%20c-0.838,1.563-2,2.791-3.486,3.686c-1.484,0.896-3.123,1.343-4.914,1.343c-2.857,0-5.163-0.875-6.915-2.629%20c-1.752-1.752-2.628-4.19-2.628-7.313c0-3.048,0.886-5.466,2.657-7.257c1.771-1.79,4.009-2.686,6.715-2.686%20C32.604,18.558,35.441,20.101,37.156,23.187z%20M55.613,23.187l-4.229,2.229c-0.457-0.951-1.02-1.619-1.686-2%20c-0.668-0.38-1.307-0.571-1.914-0.571c-2.857,0-4.287,1.885-4.287,5.657c0,1.714,0.363,3.084,1.086,4.113%20c0.723,1.029,1.789,1.544,3.201,1.544c1.865,0,3.18-0.915,3.941-2.743l4,2c-0.875,1.563-2.057,2.791-3.541,3.686%20c-1.486,0.896-3.105,1.343-4.857,1.343c-2.896,0-5.209-0.875-6.941-2.629c-1.736-1.752-2.602-4.19-2.602-7.313%20c0-3.048,0.885-5.466,2.658-7.257c1.77-1.79,4.008-2.686,6.713-2.686C51.117,18.558,53.938,20.101,55.613,23.187z'/%3e%3c/g%3e%3c/svg%3e)
%20--%3e%3c!DOCTYPE%20svg%20PUBLIC%20'-//W3C//DTD%20SVG%201.0//EN'%20'http://www.w3.org/TR/2001/REC-SVG-20010904/DTD/svg10.dtd'%3e%3csvg%20version='1.0'%20id='Layer_1'%20xmlns='http://www.w3.org/2000/svg'%20xmlns:xlink='http://www.w3.org/1999/xlink'%20x='0px'%20y='0px'%20width='64px'%20height='64px'%20viewBox='5.5%20-3.5%2064%2064'%20enable-background='new%205.5%20-3.5%2064%2064'%20xml:space='preserve'%3e%3cg%3e%3ccircle%20fill='%23FFFFFF'%20fill-opacity='0'%20cx='37.637'%20cy='28.806'%20r='28.276'/%3e%3cg%3e%3cpath%20fill='%23595959'%20d='M37.443-3.5c8.988,0,16.57,3.085,22.742,9.257C66.393,11.967,69.5,19.548,69.5,28.5c0,8.991-3.049,16.476-9.145,22.456%20C53.879,57.319,46.242,60.5,37.443,60.5c-8.649,0-16.153-3.144-22.514-9.43C8.644,44.784,5.5,37.262,5.5,28.5%20c0-8.761,3.144-16.342,9.429-22.742C21.101-0.415,28.604-3.5,37.443-3.5z%20M37.557,2.272c-7.276,0-13.428,2.553-18.457,7.657%20c-5.22,5.334-7.829,11.525-7.829,18.572c0,7.086,2.59,13.22,7.77,18.398c5.181,5.182,11.352,7.771,18.514,7.771%20c7.123,0,13.334-2.607,18.629-7.828c5.029-4.838,7.543-10.952,7.543-18.343c0-7.276-2.553-13.465-7.656-18.571%20C50.967,4.824,44.795,2.272,37.557,2.272z%20M46.129,20.557v13.085h-3.656v15.542h-9.944V33.643h-3.656V20.557%20c0-0.572,0.2-1.057,0.599-1.457c0.401-0.399,0.887-0.6,1.457-0.6h13.144c0.533,0,1.01,0.2,1.428,0.6%20C45.918,19.5,46.129,19.986,46.129,20.557z%20M33.042,12.329c0-3.008,1.485-4.514,4.458-4.514s4.457,1.504,4.457,4.514%20c0,2.971-1.486,4.457-4.457,4.457S33.042,15.3,33.042,12.329z'/%3e%3c/g%3e%3c/g%3e%3c/svg%3e)
1. Introduction
Hutchins & Marusic (Reference Hutchins and Marusic2007) first reported amplitude modulation (AM)-type behaviour between large- and small-scale filtered signals in wall-bounded turbulence. They decomposed the fluctuating streamwise velocity,  $u$, into a large-scale signal,
 $u_L$, and a small-scale signal,
 $u_S$, and noted that large variations in the large scale tended to correspond to changes in the envelope of the small scales. Mathis, Hutchins & Marusic (Reference Mathis, Hutchins and Marusic2009) then introduced a correlation coefficient,
 $R(y)$, to quantify this AM as a function of wall-normal distance,
 $y$, by defining the large-scale filtered envelope of small-scale fluctuations,
 $\mathcal {E}(u_S)$, and then calculating
 \begin{equation} R(y) = \frac{\left\langle u_L \mathcal{E}(u_S) \right\rangle }{\sqrt{\left\langle u_L^2 \right\rangle} \sqrt{\left\langle \mathcal{E}(u_S)^2 \right\rangle \vphantom{\left\langle u_L^2 \right\rangle}}}. \end{equation}
Their AM coefficient was based on the cross-correlation analysis developed by Bandyopadhyay & Hussain (Reference Bandyopadhyay and Hussain1984), but provided a simpler way to observe the variation in AM across the wall region. Mathis et al. (Reference Mathis, Hutchins and Marusic2009) noted that the profile of  $R(y)$ appeared surprisingly similar to the profile of streamwise skewness, and Schlatter & Örlü (Reference Schlatter and Örlü2010) subsequently demonstrated that the AM coefficient is not independent of the skewness. Mathis et al. (Reference Mathis, Marusic, Hutchins and Sreenivasan2011) then showed how
 $R(y)$ is analogous to one of the cross-terms found inside a scale-decomposed skewness. Since then, versions of the coefficient have been widely used, including for very-high-Reynolds-number flows in the atmospheric surface layer (Guala, Metzger & McKeon Reference Guala, Metzger and McKeon2011) and for cases of skin-friction drag reduction (Deshpande et al. Reference Deshpande, Chandran, Smits and Marusic2023).
The term ‘amplitude modulation’ can describe the empirical observation of signals that are correlated in the specific way reported by Hutchins & Marusic (Reference Hutchins and Marusic2007), or it can imply an actual dynamical mechanism that generates the observed correlation via turbulent scale interactions. Most authors have assumed that these two usages are interchangeable, and thus amplitude modulation, in the sense of (1.1), was explained by Mathis et al. (Reference Mathis, Hutchins and Marusic2009) to mean that the large-scale velocity signal,  $u_L$, modulates some small-scale carrier signal to produce the observed small-scale signal,
 $u_S$. In this view,
 $R$ should detect quadratic interactions between the large and small scales in the velocity signal,
 $u$. Duvvuri & McKeon (Reference Duvvuri and McKeon2015) rewrote
 $R$ in spectral form as a summation of real-valued Fourier modes over a region of wavenumber space corresponding to large and small scales that are triadically related. They showed that
 $R$ does, in fact, measure the energy associated with large- and small-scale velocity triads.
However, the fact that three velocity modes are triadically linked does not mean that they are the result of a nonlinear interaction. The standard way to establish that members of a triad are likely the result of a nonlinear interaction is to show that the phases of the modes are also consistent with the nonlinearity (Kim & Powers Reference Kim and Powers1979). As Duvvuri & McKeon (Reference Duvvuri and McKeon2015) derived, phase information in  $R$ appears as a weighting factor, such that triads associated with nonlinear interactions are weighted more than triads without. However, the particular phase weighting factor in
 $R$ captures only quadratic interactions between velocity modes, of the form
 $\boldsymbol {u} \boldsymbol {\cdot } \boldsymbol {u}$, and not the convective nonlinear interactions between velocity modes,
 $\boldsymbol {u} \boldsymbol {\cdot } \boldsymbol {\nabla } \boldsymbol {u}$, that are anticipated from the Navier–Stokes equations (NSEs). Indeed, it will be shown that the weighting factor inherent in
 $R$ suppresses the signature of convective nonlinearities in turbulence, and thus cannot measure the presence of turbulent scale interactions. This is consistent with recent work by Andreolli et al. (Reference Andreolli, Gatti, Vinuesa, Örlü and Schlatter2023) questioning whether perceived amplitude modulation behaviour is actually associated with triadic scale interactions.
In this study, we decompose the AM coefficient,  $R$, based on the biphase,
 $\beta$, and show how the definition of
 $R$ excludes the convective nonlinearities that are responsible for inter-scale energy exchange, but instead includes linear interactions with the mean flow. We then propose a modified coefficient,
 $R_T$, that is compatible with detecting convective scale interactions and can also be interpreted in terms of turbulent kinetic energy transport.
2. Interpretation of  $R$

2.1. Bispectral decomposition of $R$

Duvvuri & McKeon (Reference Duvvuri and McKeon2015) showed that the AM coefficient,  $R$, can be expressed as a sum of purely triadic modal energies. However, they used sine functions as their Fourier basis, which slightly obscures the true phase-weighting embedded in
 $R$. Therefore, we begin by rewriting
 $R$ in terms of complex Fourier modes, where the phases can be compared more easily, after which we will examine how to interpret the weighting. The streamwise velocity fluctuation,
 $u$, can be written as a Fourier series over streamwise wavenumber,
 $k$, with time-dependent, complex-valued Fourier coefficients,
 $\hat {u}(k,t)$, according to
 \begin{equation} u(x,t) = \sum_{{\substack{\forall k \, |\\ |k|<\infty}}} \, \hat{u}(k,t) {\rm e}^{{\rm i}kx}. \end{equation}
Then, following the procedure of Mathis et al. (Reference Mathis, Hutchins and Marusic2009), the low-pass filtered large-scale signal,  $u_L(x)$, and the remainder signal,
 $u_R(x)= u(x,t)-u_L(x,t)$, can be written in terms of the filter cutoff wavenumber,
 $k_f$, as
 \begin{equation} u_L(x,t) = \sum_{{\substack{\forall k \, | \, \\ |k| < k_f}}} \, \hat{u}(k,t) {\rm e}^{{\rm i}kx}, \quad u_R(x,t) =\sum_{{\substack{\forall k \, | \, \\ k_f < |k|<\infty}}}\, \hat{u}(k,t) {\rm e}^{{\rm i}k x}. \end{equation}
We employ the simple quadratic envelope (Jacobi & McKeon Reference Jacobi and McKeon2013) to define the magnitude of the small-scale fluctuations as  $u_R^2(x,t)$. Then, filtering with the same low-pass filter above, we obtain an envelope signal:
 \begin{equation} \mathscr{E}(x,t)=\sum_{{\substack{ \forall k', k'' \, | \\|k'|, |k''|>k_f \\ |k'+k''|< k_f}}}\, \hat{u}\left(k',t\right) \hat{u}\left(k'',t\right) {\rm e}^{{\rm i}\left(k'+k''\right) x}. \end{equation}
The spectral definitions for  $u_L$ and
 $\mathscr {E}$ can then be substituted into (1.1). Ensemble averaging, denoted
 $\langle {\cdot } \rangle$, with the assumption of stationarity then yields
 \begin{equation} R(y) = \frac{1}{\varOmega} \sum_{\substack{\forall k \, |\\ \left| k \right|< k_f } } \quad \sum_{{\substack{ \forall k', k'' \, | \\ |k'|, |k''| > k_f \\ k' + k'' ={-}k}}}\, \text{Re} \left\{ \left\langle \hat{u}(k') \hat{u}(k'') \hat{u}^*(k'+k'') \right\rangle \right\}, \end{equation}
where the normalization factor is defined as  $\varOmega = \sqrt {\langle u_L(x)^2\rangle } \, \sqrt {\langle \mathscr {E}(x)^2\rangle }$ and the real part is denoted
 $\text {Re}\{ {\cdot } \}$. (The real part is the result of the summation over positive and negative wavenumber pairs, which results in a sum of complex conjugate Fourier mode pairs that were simplified due to the conjugate symmetry of the Fourier transform for the real-valued velocity signal.) We have written
 $R$ explicitly in terms of a double sum in wavenumber space, first over all the individual small scales,
 $(k',k'')$, that form triads with the large scale,
 $k$, and then over all of the large scales,
 $k$, that are within the wavenumber filter cutoff,
 $k_f$. This result is consistent with Duvvuri & McKeon (Reference Duvvuri and McKeon2015), except for the use of complex Fourier basis functions.
We note that the bispectrum for the velocity signal is defined as  $B(k',k'') = \langle \hat {u}(k') \hat {u}(k'') \hat {u}^*(k'+k'') \rangle$, and thus
 $R$ is just the real part of the bispectrum summed over a range of wavenumbers that demarcate the triadic relation between two small scales,
 $k',k''$ and a large scale,
 $k$. In terms of the magnitude
 $|B|$ and phase
 $\beta$ of the complex bispectrum,
 $R$ is given by
 \begin{equation} R(y) = \frac{1}{\varOmega} \sum_{\substack{\forall k \, |\\ \left| k \right|< k_f } } \quad \sum_{{\substack{ \forall k', k'' \, | \\ |k'|, |k''| > k_f \\ k' + k'' ={-}k}}}\, |B(k',k'')| \cos\left[\beta(k',k'') \right]. \end{equation}
The sum of the bispectrum over all wavenumbers, when normalized, is just the skewness of the velocity signal (Kim & Powers Reference Kim and Powers1979) and, therefore, this partial sum is also consistent with the decomposition of the skewness performed by Mathis et al. (Reference Mathis, Marusic, Hutchins and Sreenivasan2011), where it was shown that  $R$ constitutes the part of the total skewness associated with large- and small-scale modes.
To identify what is actually being measured by  $R$, we need to interpret the bispectrum magnitude and biphase. The bispectrum is often described as a measure of the energy density associated with nonlinear, triadic interactions, but to see what it represents in the context of turbulence, we develop a simplified model problem based on the NSE and calculate
 $B$ and
 $\beta$. Then, we relate the scale interactions from the NSE to the value of
 $R$.
2.2. Convective triadic interaction model problem
Consider a unidirectional, instantaneous velocity signal that contains a large-scale, streamwise velocity mode with streamwise wavenumber,  $k$, and phase-speed,
 $c_k$. We are interested in modelling the interactions between this large-scale mode and other modes in the flow, including the mean. The relative mean flow felt by this large scale is just the difference between the local mean velocity,
 $\bar {u}$, and the phase speed of the mode itself. Since the NSEs are Galilean invariant, we can simply shift to the moving frame of the large-scale mode. Then the large-scale mode will exhibit a velocity discrepancy with the mean flow: very near the wall, where large-scale motions (LSMs) tend to advect faster than the mean,
 $\bar {u} - c_k < 0$, and far away from the wall, where the large scales tend to advect at speeds slower than the mean,
 $\bar {u} - c_k > 0$, as reported by Del Álamo & Jiménez (Reference Del Álamo and Jiménez2009). This Galilean shift means that the DC component of the Fourier-transformed instantaneous velocity signal is not zero,
 $\hat {u}(k=0,t) = \bar {u} - c_k$, and depends on wall normal location.
Considering the simplest possible case of mean and fluctuating interactions, we assume that the large-scale mode,  $k$, is involved in two triadic interactions: one linear interaction where it is advected by the mean flow, i.e. with a triad containing the zero wavenumber
 $(0,k,-k)$; and one nonlinear interaction, where it advects a smaller fluctuating mode denoted
 $k'$, given by the triad
 $(k,k',k'')$. We assume that each interaction is governed by the convective term in the instantaneous NSE, written in spectral form as
 \begin{equation} \frac{\partial}{\partial t}\hat{u}(-{q}, t) ={\rm i} {q} \sum_{{m+n={-}{q}}}\, \hat{u}\left(m, t\right) \hat{u}\left(n, t\right) \end{equation}
for a general triad  $(m,n,{q})$, where
 $m+n=-{q}$. (We necessarily neglect the pressure gradient term for this unidirectional flow case, since it can only be retained through considering other velocity components. Neglecting the pressure gradient should not affect the qualitative behaviour of the nonlinear transport terms on which we are focusing here, as noted by Girimaji & Zhou (Reference Girimaji and Zhou1995). We also neglect the viscous term for simplicity, although we will comment on its possible effect below.)
Each complex Fourier coefficient can be written in terms of a magnitude and phase as  $\hat {u}({q},t) = |\hat {u}({q},t)|{\rm e}^{{\rm i}\phi _q}$, where
 $\phi _q$ are assumed to be uniformly distributed, random phases. Then, we substitute the two interactions of interest to obtain the coupled system:
 $$\begin{gather} \frac{\partial}{\partial t}\hat{u}(k, t) ={-}{\rm i} k \, \hat{u}\left(0, t\right) \hat{u}\left(k, t\right), \end{gather}$$
 $$\begin{gather}\frac{\partial}{\partial t}\hat{u}({-}k'', t) ={\rm i} k'' \, \hat{u}\left(k', t\right) \hat{u}\left(k, t\right). \end{gather}$$
We want to describe the Fourier coefficients after the interaction,  $\hat {u}({q},t+\Delta t)$, in terms of the inputs to the interaction,
 $\hat {u}({q},t)$, so we discretize the time derivative for each wavenumber:
 $$\begin{gather} \hat{u}(k, t+\Delta t) = \hat{u}(k, t) -{\rm i}k \Delta t \, \hat{u}\left(0, t\right) \hat{u}\left(k, t\right), \end{gather}$$
 $$\begin{gather}\hat{u}({-}k'', t+\Delta t) =\hat{u}({-}k'', t) + {\rm i}k'' \Delta t\, \hat{u}\left(k', t\right) \hat{u}\left(k, t\right), \end{gather}$$
 $$\begin{gather}\hat{u}(k', t+\Delta t) = \hat{u}(k', t), \end{gather}$$
where  $\Delta t$ represents the interaction time between the large scale and other modes in the system. (In a numerical implementation, this discretization time would typically be much smaller than the relevant interaction time scale to fully resolve the interaction, but for analytical purposes, here we assume that it is the interaction time scale, itself.) We also assume that the
 $k'$ component is unchanged with time, as it is only an input to one of the interactions. Finally, we write the post-interaction complex Fourier coefficients:
 $$\begin{gather} \hat{u}(k, t+\Delta t) = |\hat{u}(k, t)| \sqrt{1+k^2 \Delta t^2 \hat{u}(0, t)^2} {\rm e}^{{\rm i}(\phi_{k} + \phi_0)}, \end{gather}$$
 $$\begin{gather}\hat{u}({-}k'', t+\Delta t) = |\hat{u}(k'', t)|\exp({-{\rm i}\phi_{k''}}) + k'' \Delta t |\hat{u}\left(k', t\right) ||\hat{u}\left(k, t\right)| {\rm e}^{{\rm i}( \pi/2 + \phi_{k'} + \phi_{k})}, \end{gather}$$
 $$\begin{gather}\hat{u}(k', t+\Delta t) = |\hat{u}(k', t)| {\rm e}^{{\rm i}\phi_{k'}} , \end{gather}$$
where the additional phase contribution associated with the mean flow interaction is given by  $\phi _0 = \tan ^{-1}{[-k \Delta t \, \hat {u}(0, t) ]}$.
The phase,  $\phi _0$, represents the strength of the modal interaction with the mean flow. Because this phase will be important in the subsequent analysis, we briefly consider its limiting values by considering the argument of
 $\phi _0$ as a ratio of time scales. Recall from above that
 $\hat {u}(0, t)$ represents the difference between the mean velocity and the convective velocity of the large scale,
 $\bar {u}-c_k$. Then,
 $\Delta t_0 = -1/k \hat {u}(0, t)$ is the time scale of the large-scale interaction with the background mean flow. The other time scale,
 $\Delta t$, came from the discretization of the time derivative, and we interpreted it to represent the interaction time between the large-scale and other modes. In terms of these two time scales,
 $\phi _0 = \tan ^{-1}{[\Delta t / \Delta t_0 ]}$. When the mean flow interaction is dominant (i.e. its interaction is very rapid): with
 $\bar {u}-c_k < 0$, near the wall,
 $\phi _0 \to +{\rm \pi} /2$; for
 $\bar {u}-c_k > 0$, far from the wall,
 $\phi _0 \to -{\rm \pi} /2$. When the mean flow interaction is weak and the scale interactions are dominant (and thus very rapid), then
 $\phi _0 \to 0$.
Including the effect of kinematic viscosity,  $\nu$, and defining a viscous time scale as
 $\Delta t_\nu = 1/k^2 \nu$, we can write a more general expression for the phase shift,
 $\phi _0 = \tan ^{-1}{[\Delta t / \Delta t_0 (1- \Delta t/\Delta t_\nu )^{-1} ]}$. Therefore, when the viscous time scale is similar in magnitude to the interaction time scale, i.e. when viscosity is dominant and the viscous time scale is relatively short, then
 $\phi _0 \to \pm {\rm \pi}/2$ and the viscous effects simply amplify the effect of the mean flow interaction.
Having calculated the spectral energies for the three triadic components in the instantaneous velocity signal  $u$, we calculate the bispectrum and biphase to interpret
 $R$ for this model problem. The bispectrum is given by
 \begin{equation} B(k', k'' ; t+\Delta t) = \left\langle \hat{u}(k', t+\Delta t) \hat{u}^*({-}k'', t+\Delta t) \hat{u}(k, t+\Delta t) \right\rangle. \end{equation}
Substituting (and dropping the explicit time notation) and ensemble averaging over velocity modes with the random phases defined above yields
 \begin{align} B(k', k'') = k'' \Delta t
\sqrt{1+(k'+k'')^2 \Delta t^2 |\hat{u}(0)|^2} \langle
|\hat{u}(k')|^2 |\hat{u}(k'+k'')|^2 \rangle
\exp({{\rm i}( -{\rm \pi}/2 + \phi_0)}),
\end{align}
and the biphase  $\beta = -{\rm \pi} /2 + \phi _0$. Therefore, we see that in the absence of mean flow interactions, the biphase for the convective nonlinearity of turbulence is
 $-{\rm \pi} /2$. (More generally, it is
 $\pm {\rm \pi}/2$, but this model problem considered the triad
 $k'+k''=-k$ and not
 $k'+k''=k$.) The
 $\phi _0$ contribution to biphase appears only as a result of a coupled mean flow interaction and does not appear due to simply including additional triadic interactions.
Now we use the bispectrum from the model problem to examine how the nonlinear convective interactions of turbulence influence the value of the AM coefficient,  $R$.
2.3. Model $R$ for pure convective scale interactions

In the limit of pure convective interactions between fluctuating scales with no mean interaction, the bispectrum in (2.16) can be simplified to
 \begin{equation} B(k', k'') \approx k'' \Delta t \langle |\hat{u}(k')|^2 |\hat{u}(k'+k'')|^2 \rangle {\rm e}^{{\rm i}( -{\rm \pi}/2)}. \end{equation}
For a given triad, the more energy that appears in the convectively interacting components,  $k',k''$, the higher the value of
 $|B|$. Most importantly, the biphase for the convective interaction is
 $\beta = -{\rm \pi} /2$. Plugging these results into the definition of
 $R$ in (2.5), we see that the cosine weighting of the biphase in
 $R$ means that
 $R=0$ for pure convective scale interactions. In other words, convective scale interactions in turbulence cannot contribute to
 $R$.
Of course,  $R$ could detect interactions with
 $\beta =0$, which can result from other dynamical systems that exhibit pure quadratic nonlinearity, like classical AM. However, because the NSE contains only a convective nonlinearity and not a purely quadratic term, we do not expect interactions with
 $\beta = 0$ to be significant in turbulence. It is worth noting that signals produced by quadratic AM or by a convective nonlinearity are almost completely indistinguishable by visual inspection, although totally different in biphase.
Despite the model implication that  $R=0$ for turbulence, the actual reported values of
 $R$ are not equal to zero across most of the wall region. If convective scale interactions cannot contribute to
 $R$, what physical processes are then responsible for its non-zero value? To answer this, we can use the summation definition of
 $R$ in (2.5) to decompose
 $R$ into contributions from different values of biphase
 $\beta$ (irrespective of wavenumber) by binning the biphase into discrete bins denoted
 $\beta _i$, with uniform width
 $\Delta \beta$, according to
 \begin{equation} R(y) = \sum_{\beta_i} \overbrace{ \frac{2}{\varOmega} \frac{1}{\Delta \beta}\,\sum_{{\substack{ \forall \beta \, | \\ \beta_i < |\beta| \leqslant \beta_i + \Delta \beta}}}\, |B(\beta)| \cos{(\beta)}}^{\Delta R/\Delta \beta}\Delta \beta, \end{equation}
where the quantity in the brace is the  $R$-density with respect to biphase,
 $\Delta R/\Delta \beta$. The
 $R$-density map was calculated from streamwise velocity fields from a direct numerical simulation (DNS) of a turbulent channel at
 $\text {Re}_\tau = 5200$ by Lee & Moser (Reference Lee and Moser2015), with non-dimensional filter cutoff
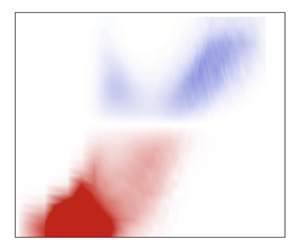
 $k_f = 2{\rm \pi}$ (non-dimensionalized by the channel half-height) and is shown in figure 1(a). The integral of the
 $R$-density yields the classical profile of
 $R$ shown in figure 1(b).
(a)  $R$-density,
 $\Delta R/\Delta \beta$, with respect to discrete biphase bins,
 $\beta _i$, according to (2.18), with
 $\Delta \beta = 0.04 {\rm \pi}$. The map was calculated from ensemble-averaging 84 480 streamwise/wall-normal snapshots of channel flow DNS data from Lee & Moser (Reference Lee and Moser2015). (b) The classical
 $R$ profile is the integral of the
 $R$-density over all biphase bins. The grey region denotes the logarithmic layer.

As expected, there is no contribution to  $R$ from convective scale interactions with
 $\beta = \pm {\rm \pi}/2$, due to the weighting. However, there appears to be a significant positive contribution from triads with
 $\beta \approx 0$ in the viscous sublayer, and then a smaller negative contribution from triads with
 $3{\rm \pi} /4 < |\beta | < {\rm \pi}$ far from the wall. If these contributions are not associated with pure convective interactions, what do they represent? To answer this, we can return to the simplified model, but now consider the effect of the mean flow interaction.
2.4. Model $R$ in the presence of mean convection

Consider the model problem bispectrum when the interaction between the large scale and the mean is dominant. The biphase  $\beta = -{\rm \pi} /2 + \phi _0$ and
 $\phi _0 \to +{\rm \pi} /2$ near the wall, where the large scales convect faster than the local mean; and
 $\phi _0 \to -{\rm \pi} /2$ far from the wall, where the large scales convect slower than the mean. In other words, near the wall, we expect the strong mean interactions to shift the biphase towards zero and, away from the wall, we expect the mean interactions to shift the biphase to
 $\pm {\rm \pi}$, which is exactly what we observe in figure 1(a). The particularly high intensity of the
 $\beta = 0$ contributions in the viscous sublayer may also be a result of amplification by viscous effects, noted above.
Ultimately, because there is no pure AM in the NSE, the spectral decomposition of  $R$ suggests that what
 $R$ really detects is interactions between large-scale features and the mean flow, and thus measures the difference between the velocity of the LSMs and the local mean velocity. The
 $\beta$-decomposed map of
 $R$ combined with the simplified model also allows us to consider a new interpretation for the zero-crossing location of
 $R$ that was somewhat unclear in previous analyses. Here,
 $R$ crosses zero when the
 $R$-density is anti-symmetric about
 ${\rm \pi} /2$, which occurs when the convective velocities of the large scales are distributed symmetrically about the local mean. By contrast, when the distribution of convection velocities is skewed towards velocities slower than the local mean, in the outer flow, then
 $\beta$ is skewed towards
 $\pm {\rm \pi}$, and
 $R$ becomes negative. When the distribution of convection velocities is skewed towards velocities higher than the local mean, in the inner flow, then
 $\beta$ is skewed towards
 $0$, and
 $R$ becomes positive. So we suggest that the zero-crossing location of
 $R$ in the middle of the log layer indicates that the dominant LSMs advect at the local mean velocity in this location, consistent with the proposal of Chung & McKeon (Reference Chung and McKeon2010).
Although this simplified model suggests that linear advection by the local mean velocity is a significant contributor to  $R$, it does not exhaust all of the possible contributions to
 $R$. In particular, three-dimensional effects (including enforcement of incompressibility), pressure-gradient effects and body forcing could all result in modifications to
 $R$, either by modifying the convective velocities of large scales, or via independent mechanisms that cannot be captured analytically in our one-dimensional (1-D) model.
Whatever might contribute to  $R$, the model shows that convective scale interactions cannot, due to the cosine weighting of the biphase. Therefore, if we want to measure the relative importance of convective,
 $\beta = \pm {\rm \pi}/2$, interactions, we must define a new diagnostic that is weighted by
 $\sin {(\beta )}$.
3. A coefficient designed for detecting convective scale interactions
3.1. Definition and spectral decomposition of $R_T$

To incorporate a  $\sin {(\beta )}$ weighting in the scale interaction analysis, we need to shift one of the two signals in the
 $R$ cross-correlation defined in (1.1) by
 ${\rm \pi} /2$ in phase. The simplest way to do this, assuming the spatial signals can be decomposed in a complex Fourier basis, is to differentiate one signal with respect to
 $x$. We apply this differentiation to the large-scale signal and define a new correlation coefficient
 $R_T$:
 \begin{equation} R_T(y) = \frac{\left\langle \dfrac{\partial u_L}{\partial x} \mathcal{E}(u_S) \right\rangle }{\sqrt{\left\langle \left({\partial u_L}/{\partial x}\right)^2 \right\rangle} \sqrt{\left\langle \mathcal{E}(u_S)^2 \right\rangle \vphantom{\left\langle \left({\partial u_L}/{\partial x}\right)^2 \right\rangle}}}. \end{equation}
As before, we rewrite this coefficient in spectral form to obtain:
 \begin{equation} R_T(y) = \frac{1}{\varOmega_T}\sum_{\substack{\forall k \, | \\ \left| k\right|< k_f }} \quad \sum_{{ \substack{\forall k', k'' \, | \\ \left| k' \right|, \left| k'' \right|>k_f \\ k'+k''={-}k }}} (k'+k'') \left| B(k', k'') \right| \sin{[\beta(k', k'')]}, \end{equation}
where the new normalization factor is defined as  $\varOmega _T = \sqrt {\langle ({\partial u_L (x)}/{\partial x} )^2 \rangle } \, \sqrt { \langle \mathcal {E}{u_S}(x)^2 \rangle }$. (Using the derivative of the large-scale signal to better correlate with small-scale activity was also suggested by Chung & McKeon (Reference Chung and McKeon2010), although for different reasons.)
Contrasting  $R_T$ with the definition of
 $R$ in (2.5), we see that the new coefficient involves a similar summation of bispectral magnitude over the region of wavenumbers for scale interactions, but it is weighted by the sine of the biphase, instead of the cosine, and thus it is weighted towards capturing convective nonlinear interactions with biphase
 $\beta = \pm {\rm \pi}/2$. We can confirm this by decomposing
 $R_T$ with respect to
 $\beta$, like we did for
 $R$ in (2.18), as
 \begin{equation} R_T(y) = \sum_{\beta_i} \overbrace{ \frac{2}{\varOmega_T} \frac{1}{\Delta \beta}\,\sum_{{\substack{ \forall \beta \, | \\ \beta_i < |\beta| \leqslant \beta_i + \Delta \beta}}}\; (k'+k'') | \, B(\beta) | \sin{(\beta)} }^{\Delta R_T/\Delta \beta}\Delta \beta. \end{equation}
Figure 2(a) shows the density  $\Delta R_T/\Delta \beta$ and figure 2(b) shows the profile of the new coefficient across the channel. We see that the contribution to
 $R_T$ from nonlinear convective triads with biphase
 $\beta = \pm {\rm \pi}/2$ is not suppressed; in fact, it seems to be the dominant contribution in the buffer and log layers, and that is where the profile of
 $R_T$ also reaches its maximum amplitude. By isolating a narrow region of
 $\beta$ around
 $\pm {\rm \pi}/2$, we construct a profile of the contribution to
 $R_T$ from only these convective scale interactions, and compare that with the total
 $R_T$ obtained via cross-correlation. Both profiles appear nearly identical in shape, except for a translation in magnitude, which means that the
 $R_T$ profile obtained from simple cross-correlation captures the relative distribution of convective scale interactions across the channel, without the need for performing the tedious bispectral summation.
(a)  $R_T$-density,
 $\Delta R_T/\Delta \beta$, with respect to discrete biphase bins,
 $\beta _i$, according to (3.3). The dominant
 $R_T$ density for
 $|\beta | \approx {\rm \pi}/2$ occurs in the log and buffer layers. (b)
 $R_T$ profile (solid line) is the integral of the
 $R_T$ density over all biphase bins, and can be calculated directly from the cross-correlation in (3.1), using simple finite differences for evaluating the derivative of the filtered signal. The partial
 $R_T$ profile (dashed line) is the integral of the
 $R_T$ density between the two dashed lines in panel (a) at
 $|\beta | = {\rm \pi}/2 \pm 0.3$.

The  $R_T$ coefficient therefore provides a tool for comparing the relative strength of convective, nonlinear interactions between large and small scales across turbulent wall-bounded flows. Unlike the
 $R$ coefficient,
 $R_T$ does not suppress convective interactions. The location of the peak
 $R_T$ amplitude occurs in the log layer, indicating that inter-scale interactions are most dominant there. The choice of filter cutoff tends to shift this location slightly: as
 $k_f$ decreases, the large-scale signal concentrates on even larger scales which are presumably centred farther from the wall, and thus the peak amplitude of
 $R_T$ shifts away from the wall. However, the qualitative shape of the profile is relatively robust to the choice of filter cutoff, as was true for
 $R$ reported by Mathis et al. (Reference Mathis, Hutchins and Marusic2009).
Because  $R_T$ also depends on
 $\beta$, it too can be affected by mean interactions. However, unlike
 $R$, where the mean interactions induced spurious evidence for nonlinearity, for
 $R_T$, the mean interactions merely suppress some of the evidence for true convective nonlinearity by reducing the biphase away from
 $\pm {\rm \pi}/2$. However, because
 $R_T$ is weighted against the resulting
 $\beta =0$ quadratic nonlinearities, this suppression should have a minimal effect on the shape of the
 $R_T$ profile.
3.2. Relationship between $R_T$ and TKE transport

The reason that the location of maximal scale interactions, as detected by  $R_T$, appears in the lower part of the log layer can be explained in terms of turbulent kinetic energy (TKE) transport across the near-wall region. The wall-parallel form of the turbulent spectral transport,
 $\hat {T}$, is related directly to
 $R_T$. Neglecting wall-normal gradients, the turbulent spectral transport is given by
 \begin{equation} \hat{T}(k_x,k_z;y) ={-}\frac{1}{2} \left\langle \hat{u}_i^* \widehat{\frac{\partial u_i u_j}{\partial x_j}} + \hat{u}_i \widehat{\frac{\partial u_i u_j}{\partial x_j}}^*\right\rangle, \end{equation}
where  $i,j$ are indices for the streamwise (
 $x$) and spanwise (
 $z$) coordinates. Simplifying for the case of unidirectional (
 $i,j=x;k=k_x$) flow, and substituting for the complex Fourier modes defined in (2.1), we rewrite the transport in terms of the bispectrum as
 \begin{equation} \hat{T}(k;y) = \sum_{{ \substack{\forall k', k'' \, |\\ k'+k'' ={-}k }}} (k'+k'') \, |B(k',k'')| \sin{\left[\beta(k',k'') \right]} \end{equation}
and we see that  $R_T$ is just a sum of a high-pass filtered version of the transport, denoted
 $\hat {T}_f$:
 \begin{align} R_T(y) = \frac{1}{\varOmega_T}\sum_{\substack{\forall k \, | \\ \left| k\right|< k_f }} \hat{T}_f(k;y), \quad \hat{T}_f(k;y) = \sum_{{ \substack{\forall k', k'' \, | \\ k'+k''={-}k \\ \left| k' \right|, \left| k'' \right|>k_f}}} (k'+k'') \left| B(k', k'') \right| \sin{[\beta(k', k'')]}. \end{align}
Empirically, we find that  $\beta (k',k'') > 0$ for
 $(k'+k'')<0$, and therefore
 $\hat {T}_f < 0$ for
 $k > 0$. By symmetry of the bispectrum, it follows that
 $\hat {T}_f < 0$ also for
 $k < 0$, and thus we observe that the transport is negative for all triads, i.e. the transport is always in the direction of the classical energy cascade, from large scales
 $k$ to the small scales
 $k',k''$. This corresponds to the
 $R_T$ profile being negative across the channel.
The spectral transport term,  $\hat {T}(k)$, has previously been used to provide evidence for the classical cascade, although not in a triadically decomposed format. Lee & Moser (Reference Lee and Moser2019) showed that
 $\hat {T}(k)$ indicates a general trend of net energy transfer from large-scale streamwise velocity modes to small-scale modes in the streamwise direction, while cautioning that an inverse cascade also appears when other directions and velocity components are considered. However, even for the 1-D streamwise analysis of
 $\hat {T}(k)$, they did not consider the specific triads involved in the energy transfer, i.e. whether the classical cascade occurs locally between neighbouring scales or whether it also indicates spectrally non-local transport, between widely separated scales. The present analysis considers only the contributions to
 $\hat {T}(k)$ from triads that involve significant scale separation and thus provides specific evidence for energetically important, nonlinear interaction between large scales and small scales that are distributed on opposite sides of the filter cutoff, supporting the general belief that large scales apply a footprint directly onto smaller scales, without layers of mediating scale interactions.
The fact that the profile of  $R_T$ shows a maximum amplitude in the buffer and log layers is likely a consequence of the intense, non-local turbulent transport in these regions. Therefore, this new scale interaction coefficient,
 $R_T$, provides a simple way of examining the relative distribution of TKE transport associated with widely separated, inter-scale energy exchange.
4. Conclusions
The AM coefficient,  $R$, cannot measure convective-type, nonlinear interactions between different scales, and therefore should not be interpreted as a measure of interactions between large- and small-scale motions in wall-bounded turbulence. Based on a biphase decomposition of
 $R$ and a simple model of triadic scale interactions, we suggest that
 $R$ is mostly influenced by linear interactions between LSMs and the mean, and is therefore a metric for local deviations from Taylor's hypothesis for LSMs. To measure the nonlinear scale interactions, we proposed a new coefficient
 $R_T$ that is weighted to appropriately capture convective scale interactions, and we showed how it can be interpreted as a measure of turbulent TKE transport between large- and small-scale motions, which was found to show evidence for the classical energy cascade between velocity modes with widely separated scales.
Funding
The authors gratefully acknowledge the support of Israel Science Foundation grant 219/21 and the Wenner-Gren Foundations grant GFOh2023-0014. The authors also thank the anonymous referees for helpful comments, particularly regarding the classical cascade.
Declaration of interests
The authors report no conflict of interest.


 Open access

