I. INTRODUCTION
Graphene is a single-layer planar sheet of sp2-bonded carbon atoms that are packed in a two-dimensional honeycomb lattice. Intrinsic graphene behaves like a semi-metal or zero-gap semiconductor. One problem with graphene is that it cannot be dispersed in water, preventing any practical applications that utilize aqueous coating or deposition technology. Graphene oxide (GO), sometimes referred to as graphite oxide, is generated by treating graphite with strong oxidizers (Dreyer et al., Reference Dreyer, Park, Bielawski and Ruoff2010). GO retains the layer structure of graphite but with a larger and irregular basal plane spacing (Blanton and Majumdar, Reference Blanton and Majumdar2012). The name ‘GO’ does not completely describe this material chemically. Besides oxygen epoxide groups, other functional groups observed to be present are carbonyl, phenol, and hydroxyl groups. It is the presence of the hydroxyl groups that allows GO to be dispersed in water.
Unfortunately, as a material GO does not have some of the attractive properties of graphene, such as high electrical conductivity. Aqueous dispersions of GO, however, allow one to formulate these materials into waterborne compositions which can be coated onto various substrates by conventional coating methods, such as dip, slot die, gravure, rod or knife coating, often at relatively high speed. Therefore, a post-coating method to convert GO into a graphitic structure has been deemed to be a practical alternative to creating graphene layers at an industrial scale. Although a complete conversion of GO to graphene has proven to be difficult, a partially reduced GO (r-GO) with improved electrical conductivity has been obtained in some cases (Gilje et al., Reference Gilje, Han, Wang, Wang and Kaner2007; Yang et al., Reference Yang, Velamakanni, Bozoklu, Park, Stoller, Piner, Stankovich, Jung, Field, Ventrice and Ruoff2009).
Most methods of converting GO to r-GO are chemical or thermal processes. For example, Gilje (Reference Gilje2010) discloses the use of hydrazine as a reducing agent for GO. The choice of such a chemical has some health and safety related issues that need to be addressed especially in a manufacturing environment. The use of thermal energy for reduction of GO (Wang et al., Reference Wang, Zhi and Mullen2008) also suffers from some limitations in terms of choice of substrate and addenda in the GO layer, which can be polymeric materials with limited thermal stability. Cote et al. (Reference Cote, Cruz-Silva and Huang2009) have reported the use of a xenon light source, to reduce GO to a conductive form, using a common digital camera flash. While this process may have advantages over chemical and thermal reduction methods, it may have some inefficiency in terms of penetration depth, especially if the GO is distributed in a binder or buried under a layer in a composite structure.
In this work, we describe the use of X-rays as a source of radiation for converting GO to r-GO with improved electrical conductivity. Characterization of the resulting material using XRD, XPS, and AFM is also provided in detail.
II. EXPERIMENTAL
A. Sample preparation
A dispersion of 0.5 wt% GO in water (N002PS) and graphene powder (N008-100-N) was obtained from Angstron Materials. Neat GO coatings were formed by depositing a few drops of GO dispersion solution onto gold foil or glass disk followed by drying in ambient air. A small amount of graphite (G) was observed to be present in this GO dispersion. The (002) G peak was used as an internal peak position standard for X-ray diffraction (XRD) analysis. Dried GO films were analyzed as made, or after one of two methods of processing: (1) in vacuum or helium (He) exposed to X-rays (4.02 kW) using a Bruker S8 X-ray fluorescence spectrometer or (2) in vacuum exposed to X-rays (0.3 kW) and in situ thermally annealed (400 °C) using a Thermo Electron Vacuum Generator ESCA-LAB 250 X-ray photoelectron spectroscopy (XPS) spectrometer.
B. XRD
XRD data were collected using a Rigaku D2000 Bragg–Brentano diffractometer, equipped with a copper rotating anode, diffracted-beam monochromator tuned to Cu Ka radiation, and a scintillation detector. All the data were collected using reflection mode geometry.
C. XPS
XPS analyses were performed using a thermo electron vacuum generator ESCA-LAB 250 equipped with a monochromatic Al Ka source.
D. Atomic force microscopy (AFM)
AFM data were collected in conductive AFM (cAFM) mode using a Veeco Metrology Nanoscope Dimension 3100 scanning probe microscope. cAFM was performed using an applied DC bias of 500 mV. The bias voltage was swept from −5 to +5 V, and the resulting current versus voltage spectrum was an average of 64 spectra.
III. RESULTS AND DISCUSSION
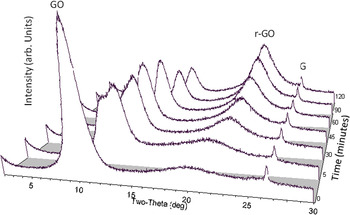
The reflection mode geometry XRD pattern for a neat GO film has a strong (001) diffraction peak indicating preferred orientation of GO basal planes parallel to the sample plane. The 2θ position of the (001) GO diffraction peak can show a range of ~7–12° 2θ (Cu Kα radiation) depending on the amount of residual water intercalated between basal planes in a GO film (Blanton and Majumdar, Reference Blanton and Majumdar2012). In addition, there is a broad peak at ~19° 2θ owing to a disordered component(s) generated during the chemical processing of graphite to make GO. To study the effect of high energy radiation on GO, a GO film coated on glass was irradiated in a wavelength dispersive XRF spectrometer, using a rhodium X-ray tube operating at 60 kV, 67 mA (4.02 kW). Exposures were additive starting with 5 min and ending with a total exposure of 120 min. An XRD pattern was collected after each XRF exposure, and all are shown in Figure 1.
XRD patterns of GO coated on glass, after 4.02 kW X-ray irradiation in He ambience. (GO, graphene oxide; r-GO, reduced GO; G, graphite.)

After the 5-min exposure, the (001) GO peak shows a decrease in peak height intensity, and two peaks are now observed. The XRF X-ray irradiation started to remove residual water from the surface of the GO film resulting in the additional higher 2θ (smaller d-spacing) diffraction peak, whereas below the surface the GO film still has residual water. After 45 min exposure a single (001) peak is observed suggesting all the water has been removed. The extended time required for water removal is an indication of the tortuous pathway the water molecules must travel, both horizontally and vertically, before reaching the GO film surface. Also observed in Figure 1 is the growth of a broad diffraction peak in the range of 23–24° 2θ with increasing X-ray irradiation of the GO film. This peak, at a lower 2θ than bulk graphite, is identified as r-GO (Cote et al., Reference Cote, Cruz-Silva and Huang2009).
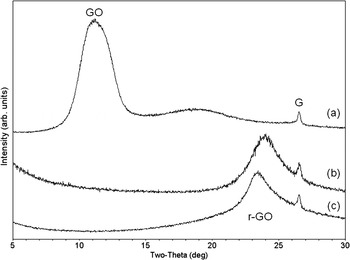
The XRD pattern for an as-deposited GO film on gold foil [Figure 2(a)] has a low angle (001) diffraction peak, as expected for a dried GO film sample. After 4.02 kW X-ray irradiation in vacuum for 2 h, the XRD pattern [Figure 2(b)] for this sample does not show the presence of a GO diffraction peak, but does show a diffraction pattern indicating r-GO is present. A similar result [Figure 2(c)] is observed in the XRD pattern for a GO film on gold after 24 h simultaneous 0.3 kW X-ray irradiation and in situ 400 °C thermal annealing in vacuum. X-ray exposure in vacuum facilitates the removal of water from a GO film and appears to be more efficient in converting GO to r-GO.
XRD patterns for (a) as-deposited GO on gold foil, (b) sample 2(a) GO on gold foil after 4.02 kW X-ray irradiation for 2 h in vacuum resulting in the formation of r-GO, and (c) GO coated on gold foil after 24 h 0.3 kW X-ray exposure and in situ 400 °C thermal annealing in vacuum resulting in the formation of r-GO. (GO, graphene oxide; r-GO, reduced GO; G, graphite.)

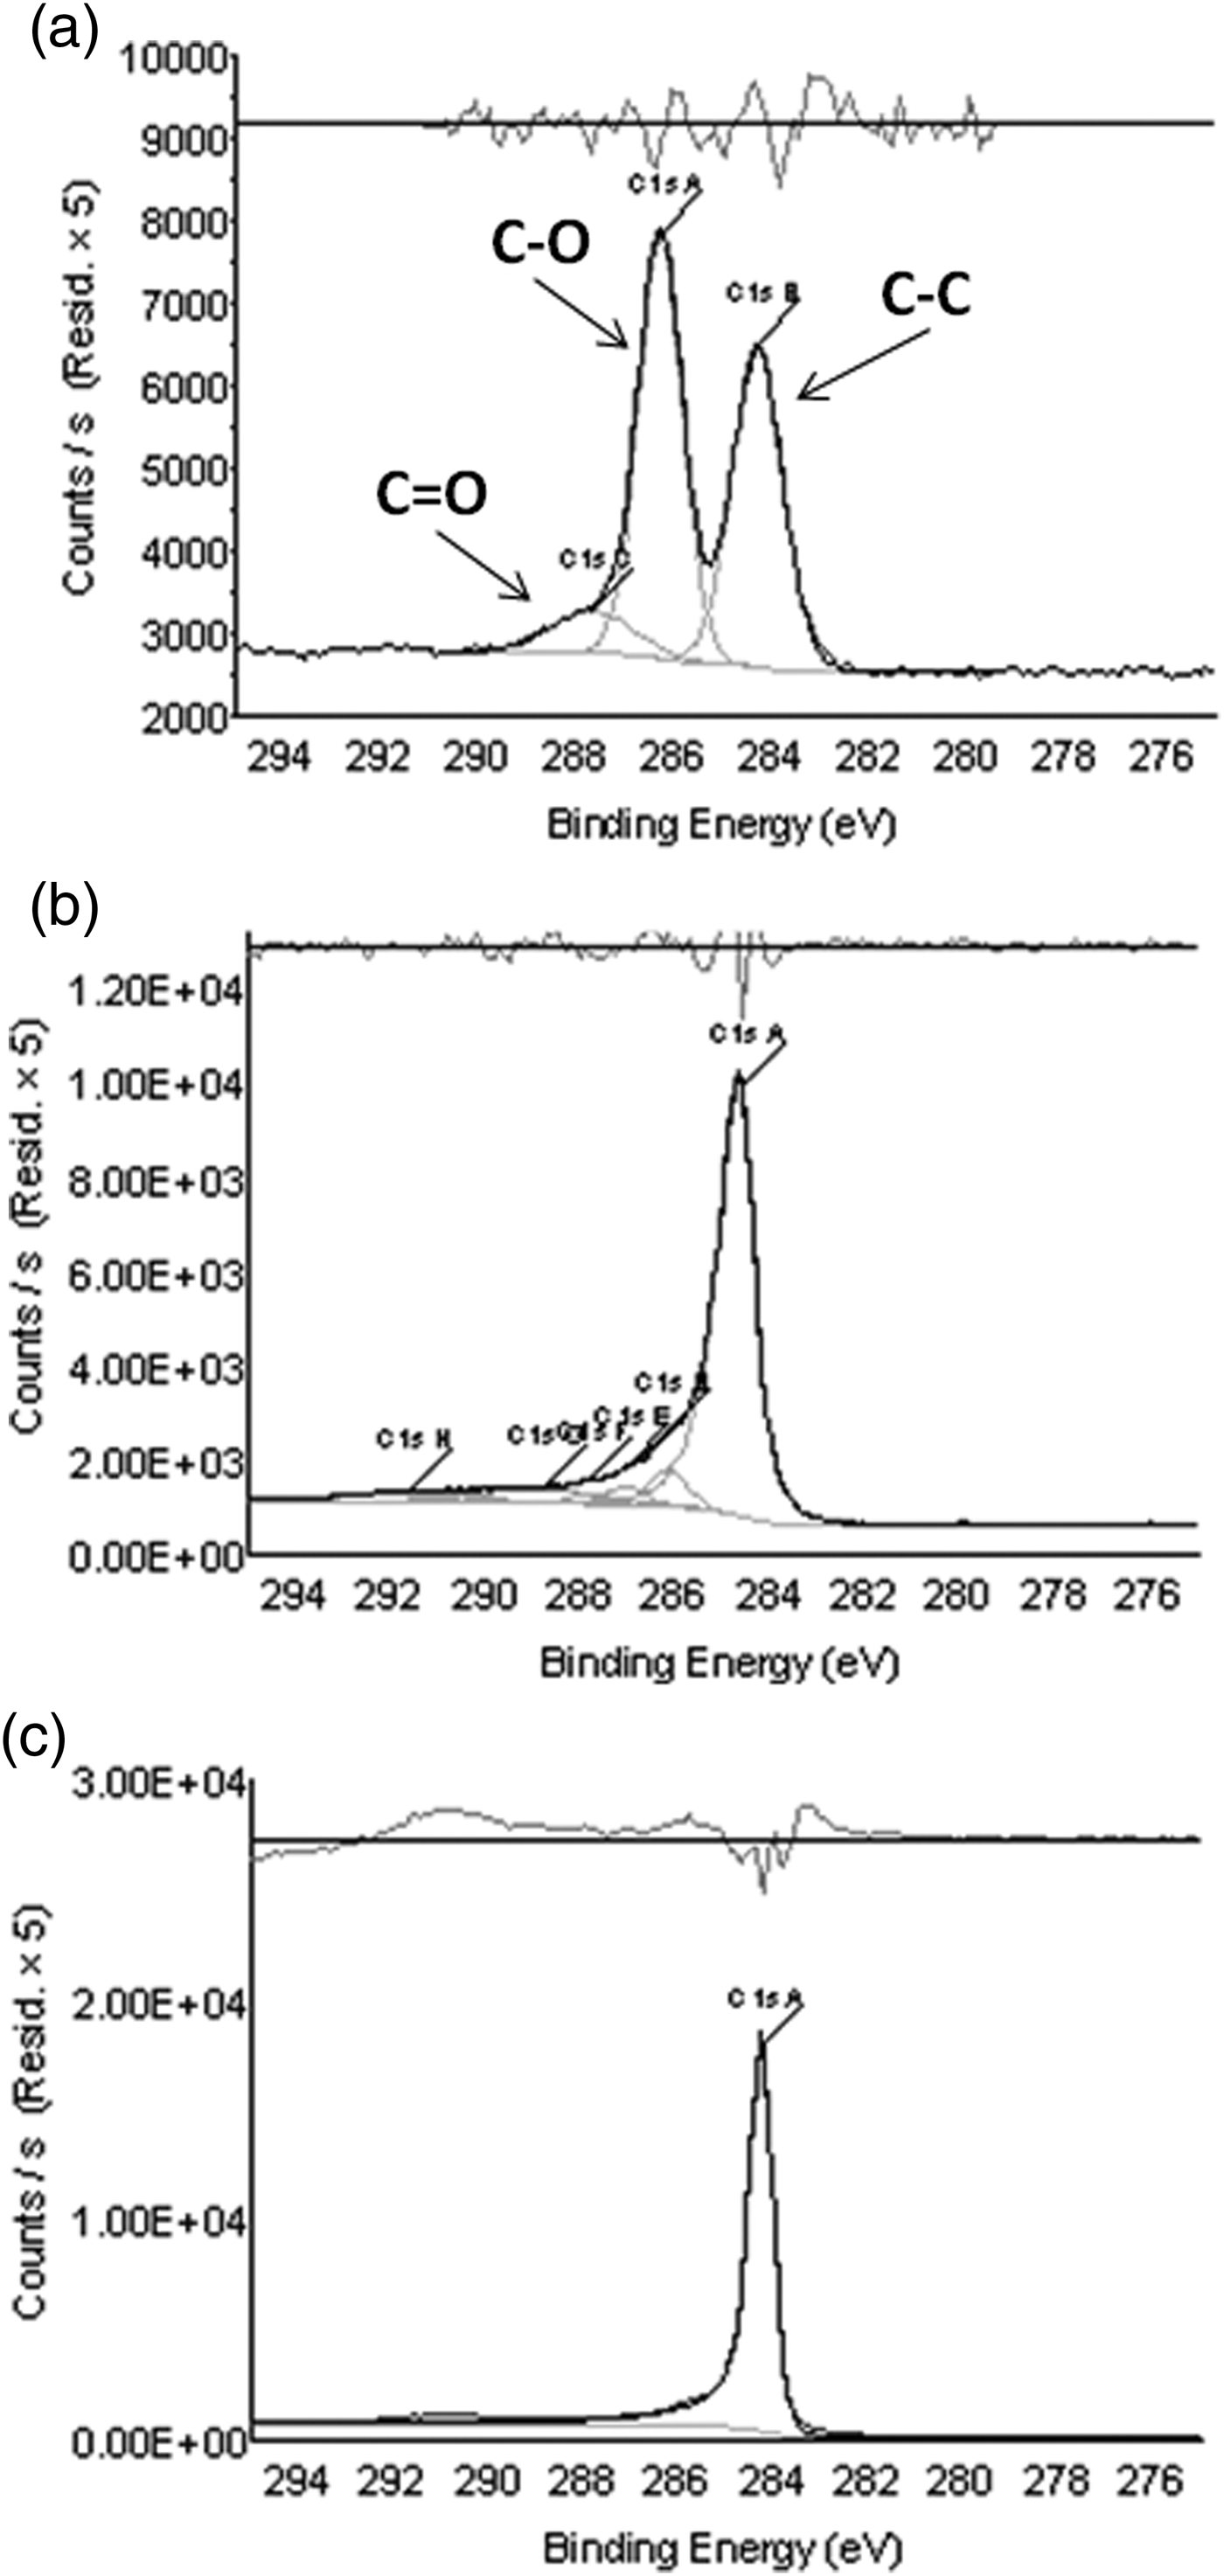
XPS was used to understand the effect of X-ray irradiation on GO chemistry. In Figure 3, XPS C1s binding energy peak spectra for as-deposited GO on gold foil [Figure 3(a)], r-GO [Figure 3(b)] on gold foil (identified after XPS analysis as being r-GO by XRD, Figure 2(c) and graphene powder on gold foil [Figure 3(c)] are shown. All XPS spectra show the presence of a C–C peak. The GO XPS spectrum also shows a prominent C–O and less intense C = O peak, consistent with GO chemistry (Yang et al., Reference Yang, Velamakanni, Bozoklu, Park, Stoller, Piner, Stankovich, Jung, Field, Ventrice and Ruoff2009). The graphene XPS spectrum has a single C–C peak with a very small higher binding energy tail, indicating this sample is nearly all carbon. In Figure 3(b), the C–O and C = O peaks in the r-GO sample are significantly reduced in intensity when compared to GO, but are not completely absent. Based on the area of the XPS peaks in Figure 3, the percent carbon in GO, r-GO, and graphene is 64, 92, and 97%, respectively. These data indicate that the conversion of GO to r-GO is the result of the loss of oxygen.
XPS spectra, C1s binding energy peaks, for (a) as-deposited GO on gold foil, (b) GO on gold foil after 24 h 0.3 kW X-ray exposure and in situ 400 °C thermal annealing in vacuum resulting in the formation of r-GO and (c) neat graphene powder on gold foil.

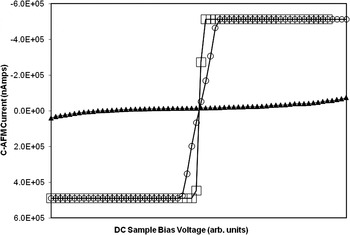
Using cAFM, the conductivity of r-GO was investigated to determine whether r-GO has the potential to be used as a conductive film. The cAFM conductivity curves for GO, r-GO, and graphene are presented in Figure 4. On opposite ends of conductivity, GO is found to be essentially non-conductive and graphene, as expected, is highly conductive. The conductivity of r-GO is observed to be close to graphene. The resistance of GO, r-GO, and graphene can be calculated from cAFM current–voltage curves and was found to be 1.54 × 10⁶, 7.66 × 10³, and 2.09 × 10³ nΩ, respectively (for highly ordered pyrolytic graphite, resistance was measured to be 2.00 × 10³ nΩ).
Conductive AFM conductivity curves for (▴) GO deposited on gold foil, (○) GO on gold foil after 24 h 0.3-kW X-ray exposure and in situ 400 °C thermal annealing in vacuum resulting in the formation of r-GO and (□) neat graphene powder on gold foil.

Structure changes observed by XRD, chemical changes detected by XPS, and conductivity data measured by cAFM demonstrate that X-ray irradiation of GO results in the generation of an r-GO phase that has good conductivity. It may be possible to drive the GO to r-GO conversion further by exposure of GO to even higher energy or higher flux radiation.
IV. SUMMARY
• A novel method for converting aqueous coatable GO to r-GO has been presented.
• XRD results demonstrate that upon high energy X-ray exposure or high energy X-ray exposure plus moderate thermal annealing, GO has a change in structure to r-GO.
• XPS results show GO loses oxygen during X-ray exposure, and that r-GO has a similar chemistry as graphene.
• Conductive AFM results indicate r-GO is significantly more conductive than GO, and approaches the conductivity of graphene.
• Owing to its coatability and the conversion methods described in this study, GO could be used in functional printing applications to ultimately produce conductive films.
ACKNOWLEDGEMENTS
The authors would like to thank Steve Brandt for collection of XPS data and Jill Fornalik for collection of AFM data.