




No CrossRef data available.
Article contents
The impact of host starvation on parasite development and population dynamics in an intestinal trypanosome parasite of bumble bees
Published online by Cambridge University Press: 17 February 2005
Abstract
Host nutrition plays an important role in determining the development and success of parasitic infections. While studies of vertebrate hosts are accumulating, little is known about how host nutrition affects parasites of invertebrate hosts. Crithidia bombi is a gut trypanosome parasite of the bumble bee, Bombus terrestris and here we use it as a model system to determine the impact of host nutrition on the population dynamics and development of micro-parasites in invertebrates. Pollen-starved bees supported significantly smaller populations of the parasite. In pollen-fed bees the parasite showed a temporal pattern in development, with promastigote transmission stages appearing at the start of the infection and gradually being replaced by choanomastigote and amastigote forms. In pollen-starved bees this developmental process was disrupted, and there was no pattern in the appearance of these three forms. We discuss the implications of these results for parasite transmission, and speculate about the mechanisms behind these changes.
Information
- Type
- Research Article
- Information
- Copyright
- © 2005 Cambridge University Press
INTRODUCTION
The nutritional status of host animals has an important impact on the dynamics of host-parasite interactions. Hosts suffering from malnutrition may have increased susceptibility (e.g. Ing et al. 2000; Koski & Scott, 2001; Pedersen et al. 2002), and may suffer more severely from parasitism (e.g. Holmes et al. 2000; Anstead et al. 2001; Coop & Kyriazakis, 2001; Koski & Scott, 2001; Pedersen et al. 2002). From the parasite perspective, host nutritional status may determine growth, of both individuals and populations, within the host, with obvious implications for transmission and parasite fitness (e.g. Keymer, Crompton & Walters, 1983; Shi et al. 1995; Sudati, Rivas & Fried, 1997; Petkevicius et al. 2001; Neves et al. 2001; Oliveira et al. 2003; Ezenwa, 2004; but see Simoes et al. 2002). In the natural world, hosts frequently undergo nutritional stress due to a lack of, or competition for resources. Consequently, understanding the interaction between host nutrition and the host-parasite dynamics is essential if we are to unravel complex host-parasite relationships.
Studies of gut parasites in vertebrates have suggested three main mechanisms by which host nutritional status might influence parasites (Bundy & Golden, 1987), (i) nutritionally mediated changes in host defences, (ii) malnutrition of the parasite, and (iii) nutritionally mediated changes in the environment of the parasite. These mechanisms may act singly or synergistically. For example, suppression of the host immune response due to malnutrition (e.g. Shi et al. 1994; Scott & Koski, 2000) is likely to lead to increased numbers of infective stages successfully establishing, maturing and reproducing themselves in the host. Concomitant changes in the environment, perhaps through changes in the physiology of the host-gut, may have the opposite effect, with infective stages failing to establish themselves (Ongele et al. 2002). Finally, a general lack of resources may either have no effect on parasite population establishment and growth, or lead to its reduction, depending upon how the parasite obtains its own nutritional needs from the host. While a number of studies in vertebrates have assessed the impact of these various mechanisms (see references above), so far too little is known to predict general patterns in the relationship between host nutrition and parasite success.
Our understanding of the impact of host nutrition in invertebrate host-parasite systems is even more limited. To the best of our knowledge, only Kollien & Schaub's work (reviewed in 2000, 2002, 2003), which quantified the impact of feeding and starvation of the hemimetabolous bug Triatomine infestans on its heteroxenous and homoxenous trypanosomes (Trypanosoma cruzii and Blastocrithidia triatomae, respectively), has examined the role of host nutrition in invertebrate host-parasite systems. In starving bugs, parasite populations decrease and show potentially adaptive changes in the relative proportion of different developmental stages. The mechanism behind these changes is unclear, although it is likely to be due to parasite malnutrition, changes in host gut physiology, or both. However, starvation is a normal part of the life-cycle of this host species, and thus the impact of starvation on parasites in invertebrate hosts where it is an abnormal agent of stress remains unclear. Here we investigate the impact of host nutrition on the population dynamics of the gut trypanosome Crithidia bombi in its holometabolous host, the bumble bee Bombus terrestris.
The Crithidia/Bombus system has become a model invertebrate host-parasite system (Schmid-Hempel, 2001). The parasite infects its adult host per os and then develops in the gut, before transmission stages are passed out in the host faeces from about 2 days after infection (Schmid-Hempel & Schmid-Hempel, 1993; Imhoof & Schmid-Hempel, 1998). Previous work has shown that there are strong genotypic and physiological interactions between the host and parasite (Shykoff & Schmid-Hempel, 1991a,b; Schmid-Hempel et al. 1999; Brown, Moret & Schmid-Hempel, 2003). While generally benign and highly prevalent (Shykoff & Schmid-Hempel, 1991c,d; Imhoof & Schmid-Hempel, 1998, 1999), under conditions of host-stress the parasite has a significant impact on its host's survival and reproduction (Brown, Loosli & Schmid-Hempel, 2000; Brown, Schmid-Hempel & Schmid-Hempel, 2003). In the current study we address 2 questions: (1) how does host starvation affect parasite population growth and potential for transmission and (2) does host nutrition impact on the presence of different developmental forms of the parasite?
MATERIALS AND METHODS
Bees for the experiment were taken from 2 colonies of B. terrestris supplied by Hortico Industries, Ireland. Twenty bees were taken from each colony and randomly assigned to one of two treatments, ‘Pollen’ and ‘No Pollen’. Prior to the experiment, the bees were fed pollen and sugar water (Apiinvert®) ad libitum. In addition, their faeces were checked to make sure that the bees were parasite-free.
To prepare the inoculum, faeces were collected from 17 B. terrestris workers infected with C. bombi taken from 2 naturally infected B. terrestris queens caught in the spring of 2003 in Dublin, Ireland. The faeces were mixed and cell counts were made using an improved Neubauer slide. The faeces were then mixed with sugar water to produce an inoculum concentration of 2500 parasite cells/μl.
Prior to inoculation, bees were deprived of all food for 3 h to facilitate infection. Each bee was then presented with a 10 μl drop of inoculum and observed until the inoculum was drunk. Thus, each bee ingested a total of 25000 parasite cells. Post-inoculation, bees were kept separately in plastic boxes (10·5×13×6 cm). Pollen bees were provided with ad libitum pollen and sugar water, while No Pollen bees were provided only with sugar water. In the absence of sugar water, bees die within about 12 h (Brown et al. 2000). The bees were kept in a dark room at 30 °C and 50% relative humidity for the duration of the experiment.
For the following 15 days, faeces were collected from each of the 40 bees and parasite cells were counted using an improved Neubauer slide. In addition, for each count we determined the presence or absence of the 3 morphological forms of the parasite – promastigote, choanomastigote and amastigote. By using faecal counts, rather than dissections, we were able to track directly the development of the infection in individual bees.
Prior to the main experiment described above, we ran a pilot experiment using 20 bees from one of the two colonies. In this experiment, faecal parasite counts were only made for days 10 to 15, and morphotypes were not recorded, but in all other respects the experimental design was the same.
A repeated-measures ANOVA was used to determine the effects of pollen treatment, colony, time and their interactions on the growth of the parasite population. Because the data did not meet the assumption of sphericity, Greenhouse-Geisser values were used to determine significance. Mann-Whitney U-tests were used to examine differences between the pollen treatments on each day of the experiment. To determine whether the parasite morphotypes appeared asynchronously we used paired t-tests (where forms were paired within bees) to analyse the order in which they appeared in the faeces, and χ2-tests to analyse the prevalence of each form on each day. Because data points across days are not independent, the improved sequential Bonferroni technique was used to assess true statistical significance (Hochberg, 1988). All statistical analyses were done on SPSS 10 for the Macintosh.
RESULTS
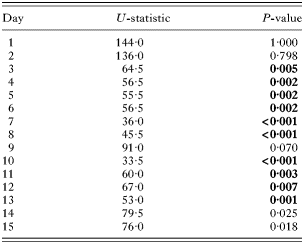
Of the 40 experimental bees, 3 died (2 from the No Pollen treatment and 1 from the Pollen treatment) and 2 escaped and were lost during the course of the experiment; only 1 bee (No Pollen treatment) failed to establish a C. bombi infection. There was a significant effect of treatment on the parasite population, with Pollen bees carrying consistently higher parasite loads (Table 1, Fig. 1). A day-by-day analysis showed that parasite loads were significantly higher on days 3 to 8, and days 10 to 13 of the experiment (Table 2, Fig. 1). There was also a significant effect of time, with parasite load generally increasing across the experiment (Table 1, Fig. 1). This trend was best captured by a linear relationship (F1,30=40·454, P<0·001) and represents the development of the parasitaemia. In contrast, there was no effect of colony-of-origin, or any of the interactions between these factors (Table 1).

Fig. 1. The population dynamics of Crithidia bombi infections in pollen-fed (–[bull ]–) and pollen-starved (–□–) bees. Data shown are mean±standard error. Note how the parasite population increases earlier and to higher levels in the pollen-fed bees. Bars with asterisks indicate the within-day comparisons that showed a significant difference between pollen-fed and pollen-starved bees (see Table 2 for statistics).
Table 1. Results from the repeated-measure ANOVA analysis of parasite population dynamics (Because the data did not meet the assumption of sphericity, statistics for the repeated measure and its interactions are the Greenhouse-Geisser values explaining the non-integer values for degrees of freedom.)

Table 2. Pollen-fed bees maintained significantly larger parasite populations (Results are from the Mann-Whitney U-test analyses of differences between food treatments within days. Significant values after Bonferroni correction are shown in bold. See Fig. 1 for parasite population dynamics.)
In the pilot experiment, we found similar results. Parasite counts were significantly higher in pollen-fed bees for days 10 to 15 (RMANOVA; Pollen, F1,11=8·286, P=0·015, Day, F4,44=1·143, P=0·349, Pollen×Day, F4,44=0·555, P=0·696), and significantly so for days 10, 12 and 13 (Mann-Whitney U-test; day 10, Z=2·666, P=0·008; day 11, Z=0·889, P=0·374; day 12, Z=2·062, P=0·039; day 13, Z=2·205, P=0·027; day 14, Z=1·389, P=0·165; day 15, Z=1·886, P=0·059).
The promastigote form of the parasite appeared earlier in faeces during the course of the experiment than either the choanomastigote (mean day of first appearance±S.E., 4·0±0·18 vs 5·0±0·19, D.F.=38, t=6·325, P<0·001; Fig. 2) or amastigote forms (mean±S.E., 4·0±0·18 vs 5·2±0·19, D.F.=38, t=5·972, P<0·001; Fig. 2). There was no significant difference between the appearance of the choanomastigote and amastigote forms (D.F.=38, t=1·156, P=0·255; Fig. 2).

Fig. 2. The comparative temporal dynamics for the prevalence of promastigote, choanomastigote and amastigote forms of the parasite in pollen-fed and pollen-starved bees. Contrast the absence of any significant pattern in the prevalence of the three types in the upper graph (pollen-starved bees) with statistically significant differences (shown with an asterisk above the relevant columns) in the increase and decrease in prevalence of the three forms in the lower graph (pollen-fed bees) (see text and Table 3 for statistical details).
Because of the significant differences between food treatments in the parasitaemia, we examined the relative prevalences of the three morphotypes across all bees and for each food treatment individually. After Bonferroni adjustment, across all bees and within the Pollen treatment, there were significant differences in morphotype prevalence for days 3, 4, 10, 11, and 13 of the experiment (Table 3, Fig. 2). These differences were due to a higher prevalence of the promastigote form on days 3 and 4, and a lower prevalence of the promastigote on days 10, 11 and 13 (Fig. 2). It should be noted that the promastigote was consistently the most prevalent form for days 2–5 of the experiment, after which it showed a general decline in prevalence concomitant with an increase in the prevalence of the two other forms (Fig. 2). In contrast, in the No Pollen treatment there were no significant differences in morphotype prevalence throughout the experiment, even without Bonferroni adjustment (Table 3).
Table 3. Results from the χ2 analyses of the relative prevalences of the three parasite morphotypes (i) across all bees, (ii) across bees within food treatments (Significant values after Bonferroni correction are shown in bold.)

DISCUSSION
Our results show that the dynamics of Crithidia bombi populations in their bumble bee hosts are dramatically affected by the host's nutritional status. Pollen-starved bees maintained significantly lower parasite populations that developed later after infection. Furthermore, pollen-starvation disrupted the order in which different developmental forms of the parasite appeared as transmission stages.
Given the opportunity, worker bumble bees will consume pollen throughout their natural life-span (Smeets & Duchateau, 2003; M.J.F.B., personal observation). Consequently, in conditions of high resource availability, populations of the parasite within individual hosts should be high. In contrast, when colonies are food-stressed, individual parasite populations should decline rapidly. The implications of such fluctuations for parasite transmission and epidemiology depend upon the transmission route being considered. In this host-parasite system, transmission can occur either intra-colony (within the nest and between nest-mates; Schmid-Hempel (2001)) or inter-colony (via flowers and between non-nestmates; Durrer & Schmid-Hempel (1994)). Intra-colony transmission is unlikely to be affected by the nutritional status of hosts. Previous work has shown that a dose of 5000 parasite cells is sufficient to allow the successful transmission of the parasite (Brown et al. 2003), equivalent to the number of cells present in a single defecation from a pollen-starved bee. In dark, warm and humid nest conditions such defecated cells are unlikely to suffer rapid environment-induced mortality and thus will remain a potent source of infection. In contrast, our results do have implications for inter-colony transmission via flowers. In a previous experiment, Schmid-Hempel et al. (1999) showed that exposure to the environment dramatically reduced the infection potential of parasite inocula. While the mechanism behind this reduction was not assessed, it seems likely that it is due to parasite mortality caused by dessication and UV-light. The reduced parasite population in the faeces of pollen-starved bees would enhance this effect, leading to a reduction in inter-colony transmission of the parasite and thus a reduction in the overall parasite population. Consequently, we would expect the parasite to be less prevalent in food-stressed host populations, in contrast to simple expectations based on host-susceptibility.
What is the mechanism behind the reduction in parasite populations? The framework of Bundy & Golden (1987), developed for vertebrate systems, suggests two potential explanations. First, decreased host nutrition may negatively impact parasite populations through a simple reduction in resource availability. We do not know how much of the nutritional requirements of C. bombi are absorbed directly from the gut contents compared to from the host itself. If direct absorption is important, then pollen-starvation will immediately impact on parasite population growth. However, the presence of sustained parasite populations in pollen-starved bees suggests that C. bombi does derive significant nutritional supplies directly from its host. Consequently, the reduction in parasite populations may be due to a reduction in host-derived resources. Previous work has shown that pollen-starved bees reallocate resources away from maintenance and growth to the costly immune system (Moret & Schmid-Hempel, 2000; Brown et al. 2003), potentially making resources less available to gut-parasites such as C. bombi. A second explanation is that the absence of pollen changes the gut environment to make it detrimental to parasite growth. Such effects have been shown in a trypanosome-vertebrate system (Ongele et al. 2002). Selenium is an important anti-oxidant, and a selenium-deficient diet resulted in reduced parasite growth in mice. Whether similar effects might be present in invertebrate hosts in general, and B. terrestris specifically, remains unknown.
To our knowledge, the only other trypanosomes of insects for which development and the impact of starvation and feeding have been quantified are Trypanosoma cruzi and Blastocrithidia triatomae in the reduviid bug Triatoma infestans (Kollien & Schaub, 2000, 2002, 2003). Unlike bumble bees, which show holometabolic development and are infected by C. bombi as adults only, T. infestans is a hemimetabolous insect, where development from one instar to the next depends upon a natural cycle of feeding and starvation, and infection can occur at any point in the host life-cycle. However, despite these apparently large host differences, the impact of starvation in this system on parasite populations shows strong parallels with that seen in our experiments. The response of T. cruzi and B. triatomae to host starvation involves both dramatic decreases in population size and changes in the relative presence of different developmental stages.
It is currently unclear what the functions of the three different developmental forms of C. bombi are, but the temporal pattern in their presence during an infection (except in the absence of pollen, when this pattern was disrupted) and correlated variation across an infection in the ability for the parasite to be transmitted successfully from one host to another (Schmid-Hempel & Schmid-Hempel, 1993) suggests that the parasite forms may have different roles in transmission. For example, the rapidly moving promastigote form, with its large surface area: volume making it prone to dessication, may be more important for transmission intra-colony, while the presumably more resistant, small surface area: volume amastigote and choanomastigote forms may be more important for inter-colony transmission, where the ability to withstand environmental stress is more important (Schmid-Hempel et al. 1999). Thus, the developmental pattern makes sense from the perspective of the parasite, as the propensity for bees to forage outside the nest increases as they age (Schmid-Hempel, 2001). An alternative, non-adaptive explanation is that the parasite life-cycle may be fixed within this group of trypanosomes, making its potential fit with transmission routes a non-adaptive, but fortuitous accident. It should be noted that both of these explanations assume that all parasite morphotypes have an equal probability of entering the host faeces. If there is niche-partitioning within the gut by morphotypes, and no migratory behaviour between niches, then temporal patterns within the faeces may simply reflect such niche partitioning by the parasite within the gut. All of these suggestions remain to be tested.
To conclude, our results suggest that host nutrition is an important determinant for the within-host demography of parasites of invertebrates, just as it is in the more well-studied parasites of vertebrates. However, further studies are required to determine both the mechanisms behind such impacts and the relative importance of them with respect to establishment, reproduction and transmission for parasites in these two fundamentally dissimilar types of host.
We would like to thank Peter Stafford and Alison Boyce for help in the laboratory. Comments from Professor Celia Holland and two anonymous reviewers improved the manuscript. This work was supported by a Start-Up grant from Trinity College Dublin and a Basic Research Grant from Enterprise Ireland SC/2002/209 to M.J.F.B.
References
REFERENCES
ANSTEAD, G. M.,
CHANDRASEKAR, B.,
ZHAO, W. G.,
YANG, J.,
PEREZ, L. E. &
MELBY, P. C. (
2001).
Malnutrition alters the innate immune response and increases early visceralization following Leishmania donovani infection.
Infection and Immunity
69,
4709–4718.CrossRefGoogle Scholar
BROWN, M. J. F.,
LOOSLI, R. &
SCHMID-HEMPEL, P. (
2000).
Condition-dependent expression of virulence in a trypanosome infecting bumblebees.
Oikos
91,
421–427.CrossRefGoogle Scholar
BROWN, M. J. F.,
MORET, Y. &
SCHMID-HEMPEL, P. (
2003).
Activation of host constitutive immune defence by an intestinal trypanosome parasite of bumble bees.
Parasitology
126,
253–260.CrossRefGoogle Scholar
BROWN, M. J. F.,
SCHMID-HEMPEL, R. &
SCHMID-HEMPEL, P. (
2003).
Strong context-dependent virulence in a host-parasite system: reconciling genetic evidence with theory.
Journal of Animal Ecology
72,
994–1002.CrossRefGoogle Scholar
BUNDY, D. A. P. &
GOLDEN, M. H. N. (
1987).
The impact of host nutrition on gastro-intestinal helminth populations.
Parasitology
95,
623–635.CrossRefGoogle Scholar
COOP, R. L. &
KYRIAZAKIS, I. (
2001).
Influence of host nutrition on the development and consequences of nematode parasitism in ruminants.
Trends in Parasitology
17,
325–330.CrossRefGoogle Scholar
DURRER, S. &
SCHMID-HEMPEL, P. (
1994).
Shared use of flowers leads to horizontal pathogen transmission.
Proceedings of the Royal Society of London, B
258,
299–302.CrossRefGoogle Scholar
EZENWA, V. O. (
2004).
Interactions among host diet, nutritional status and gastrointestinal parasite infection in wild bovids.
International Journal for Parasitology
34,
535–542.CrossRefGoogle Scholar
HOCHBERG, Y. (
1988).
A sharper Bonferroni procedure for multiple tests of significance.
Biometrika
75,
800–802.CrossRefGoogle Scholar
HOLMES, P. H.,
KATUNGUKA-RWAKISHAYA, E.,
BENNISON, J. J.,
WASSINK, G. J. &
PARKINS, J. J. (
2000).
Impact of nutrition on the pathophysiology of bovine trypanosomiasis.
Parasitology
120,
S73–S85.CrossRefGoogle Scholar
IMHOOF, B. &
SCHMID-HEMPEL, P. (
1998).
Single-clone and mixed-clone infections versus host environment in Crithidia bombi infecting bumblebees.
Parasitology
117,
331–336.CrossRefGoogle Scholar
IMHOOF, B. &
SCHMID-HEMPEL, P. (
1999).
Colony success of Bombus terrestris and microparasitic infections in the field.
Insectes Sociaux
46,
223–238.Google Scholar
ING, R.,
SU, Z.,
SCOTT, M. E. &
KOSKI, K. G. (
2000).
Suppressed T helper 2 immunity and prolonged survival of a nematode parasite in protein-malnourished mice.
Proceedings of the National Academy of Sciences, USA
97,
7078–7083.CrossRefGoogle Scholar
KEYMER, A.,
CROMPTON, D. W. T. &
WALTERS, D. E. (
1983).
Parasite population biology and host nutrition – dietary fructose and moniliformis (Acanthocephala).
Parasitology
87,
265–278.CrossRefGoogle Scholar
KOLLIEN, A. H. &
SCHAUB, G. A. (
2000).
The development of Trypanosoma cruzi in Triatominae.
Parasitology Today
16,
381–387.CrossRefGoogle Scholar
KOLLIEN, A. H. &
SCHAUB, G. A. (
2002).
The development of Blastocrithidia triatomae (Trypanosomatidae) in the reduviid bug Triatoma infestans (Insecta): influence of starvation.
Parasitology Research
88,
804–809.CrossRefGoogle Scholar
KOLLIEN, A. H. &
SCHAUB, G. A. (
2003).
The development of Blastocrithidia triatomae (Trypanosomatidae) in the reduviid bug Triatoma infestans (Insecta): influence of feeding.
Parasitology Research
89,
430–436.Google Scholar
KOSKI, K. G. &
SCOTT, M. E. (
2001).
Gastrointestinal nematodes, nutrition and immunity: breaking the negative spiral.
Annual Review of Nutrition
21,
297–321.CrossRefGoogle Scholar
MORET, Y. &
SCHMID-HEMPEL, P. (
2000).
Survival for immunity: the price of immune system activation for bumblebee workers.
Science
290,
1166–1168.CrossRefGoogle Scholar
NEVES, R. H.,
MACHADO-SILVA, J. R.,
PELAJO-MACHADO, M.,
OLIVEIRA, S. A.,
COUTINHO, E. M.,
LENZI, H. L. &
GOMES, D. C. (
2001).
Morphological aspects of Schistosoma mansoni adult worms isolated from nourished and undernourished mice: a comparative analysis by confocal laser scanning microscopy.
Memorias do Instituto Oswaldo Cruz
96,
1013–1016.CrossRefGoogle Scholar
OLIVEIRA, S. A.,
BARBOSA, A. A.,
GOMES, D. C.,
MACHADO-SILVA, J. R.,
BARROS, A. F.,
NEVES, R. H. &
COUTINHO, E. M. (
2003).
Morphometric study of Schistosoma mansoni adult worms recovered from undernourished infected mice.
Memorias do Instituto Oswaldo Cruz
98,
623–627.CrossRefGoogle Scholar
ONGELE, E. A.,
ASHRAF, M.,
NESBITT, R. A.,
HUMPHREY, P. A. &
LEE, C. M. (
2002).
Effects of selenium deficiency in the development of trypanosomes and humoral immune responses in mice infected with Trypanosoma musculi.
Parasitology Research
88,
540–545.CrossRefGoogle Scholar
PEDERSEN, S.,
SAEED, I.,
MICHAELSEN, K. F.,
FRIIS, H. &
MURRELL, K. D. (
2002).
Impact of protein energy malnutrition on Trichuris suis infection in pigs concomitantly infected with Ascaris suum.
Parasitology
124,
561–568.CrossRefGoogle Scholar
PETKEVICIUS, S.,
KNUDSEN, K. E. B.,
NANSEN, P. &
MURRELL, K. D. (
2001).
The effect of dietary carbohydrates with different digestibility on the populations of Oesophagostomum dentatum in the intestinal tract of pigs.
Parasitology
123,
315–324.CrossRefGoogle Scholar
SCHMID-HEMPEL, P. (
2001).
On the evolutionary ecology of host-parasite interactions: addressing the question with regard to bumblebees and their parasites.
Naturwissenschaften
88,
147–158.CrossRefGoogle Scholar
SCHMID-HEMPEL, P.,
PUHR, K.,
KRUGER, N.,
REBER, C. &
SCHMID-HEMPEL, R. (
1999).
Dynamic and genetic consequences of variation in horizontal transmission for microparasitic infection.
Evolution
53,
426–434.CrossRefGoogle Scholar
SCHMID-HEMPEL, P. &
SCHMID-HEMPEL, R. (
1993).
Transmission of a pathogen in Bombus terrestris, with a note on division of labour in social insects.
Behavioral Ecology and Sociobiology
33,
319–327.CrossRefGoogle Scholar
SCOTT, M. E. &
KOSKI, K. G. (
2000).
Zinc deficiency impairs immune responses against parasitic nematode infections at intestinal and systemic sites.
Journal of Nutrition
130,
1412S–1420S.CrossRefGoogle Scholar
SHI, H. N.,
SCOTT, M. E.,
KOSKI, K. G.,
BOULAY, M. &
STEVENSON, M. M. (
1995).
Energy restriction and severe zinc-deficiency influence growth, survival and reproduction of Heligmosomoides polygyrus (Nematoda) during primary and challenge infections in mice.
Parasitology
110,
599–609.CrossRefGoogle Scholar
SHI, H. N.,
SCOTT, M. E.,
STEVENSON, M. M. &
KOSKI, K. G. (
1994).
Zinc-deficiency impairs T-cell function in mice with primary infection of Heligmosomoides polygyrus (Nematoda).
Parasite Immunology
16,
339–350.CrossRefGoogle Scholar
SHYKOFF, J. A. &
SCHMID-HEMPEL, P. (
1991 a).
Parasites and the advantage of genetic variability within social insect colonies.
Proceedings of the Royal Society of London, B
243,
55–58.Google Scholar
SHYKOFF, J. A. &
SCHMID-HEMPEL, P. (
1991 b).
Genetic relatedness and eusociality: parasite-mediated selection on the genetic composition of groups.
Behavioral Ecology and Sociobiology
28,
371–376.Google Scholar
SHYKOFF, J. A. &
SCHMID-HEMPEL, P. (
1991 c).
Incidence and effects of four parasites in natural populations in bumble bees in Switzerland.
Apidologie
22,
117–126.Google Scholar
SHYKOFF, J. A. &
SCHMID-HEMPEL, P. (
1991 d).
Parasites delay worker reproduction in bumblebees: consequences for eusociality.
Behavioral Ecology
2,
242–248.Google Scholar
SIMOES, C.,
NEVES, R. H.,
BARROS, L. D.,
BRITO, P. D.,
CRAVO, C. O.,
DE MOURA, E. G. &
MACHADO-SILVA, J. R. (
2002).
Parasitological characteristics of Schistosoma mansoni infection in Swiss mice with underlying malnutrtion.
Memorias do Instituto Oswaldo Cruz
97,
143–147.CrossRefGoogle Scholar
SMEETS, P. &
DUCHATEAU, M. J. (
2003).
Longevity of Bombus terrestris workers (Hymenoptera: Apidae) in relation to pollen availability, in the absence of foraging.
Apidologie
34,
333–337.CrossRefGoogle Scholar
SUDATI, J. E.,
RIVAS, F. &
FRIED, B. (
1997).
Effect of a high protein diet on worm recovery, growth and distribution of Echinostoma caproni in ICR mice.
Journal of Helminthology
71,
351–354.CrossRefGoogle Scholar
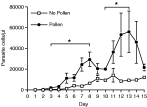
Fig. 1. The population dynamics of Crithidia bombi infections in pollen-fed (–[bull ]–) and pollen-starved (–□–) bees. Data shown are mean±standard error. Note how the parasite population increases earlier and to higher levels in the pollen-fed bees. Bars with asterisks indicate the within-day comparisons that showed a significant difference between pollen-fed and pollen-starved bees (see Table 2 for statistics).
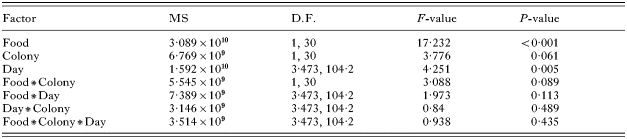
Table 1. Results from the repeated-measure ANOVA analysis of parasite population dynamics
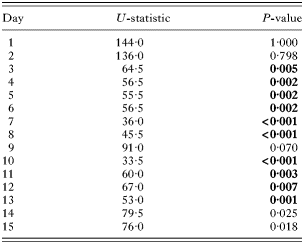
Table 2. Pollen-fed bees maintained significantly larger parasite populations
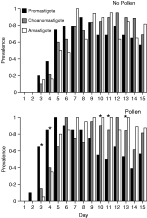
Fig. 2. The comparative temporal dynamics for the prevalence of promastigote, choanomastigote and amastigote forms of the parasite in pollen-fed and pollen-starved bees. Contrast the absence of any significant pattern in the prevalence of the three types in the upper graph (pollen-starved bees) with statistically significant differences (shown with an asterisk above the relevant columns) in the increase and decrease in prevalence of the three forms in the lower graph (pollen-fed bees) (see text and Table 3 for statistical details).
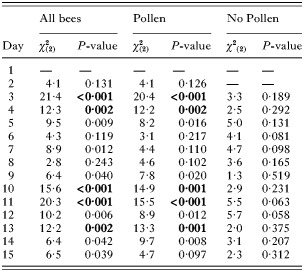
Table 3. Results from the χ2 analyses of the relative prevalences of the three parasite morphotypes (i) across all bees, (ii) across bees within food treatments
 You have
Access
- 83
- Cited by